Sample Category Title
Sunset Market Commentary
Markets
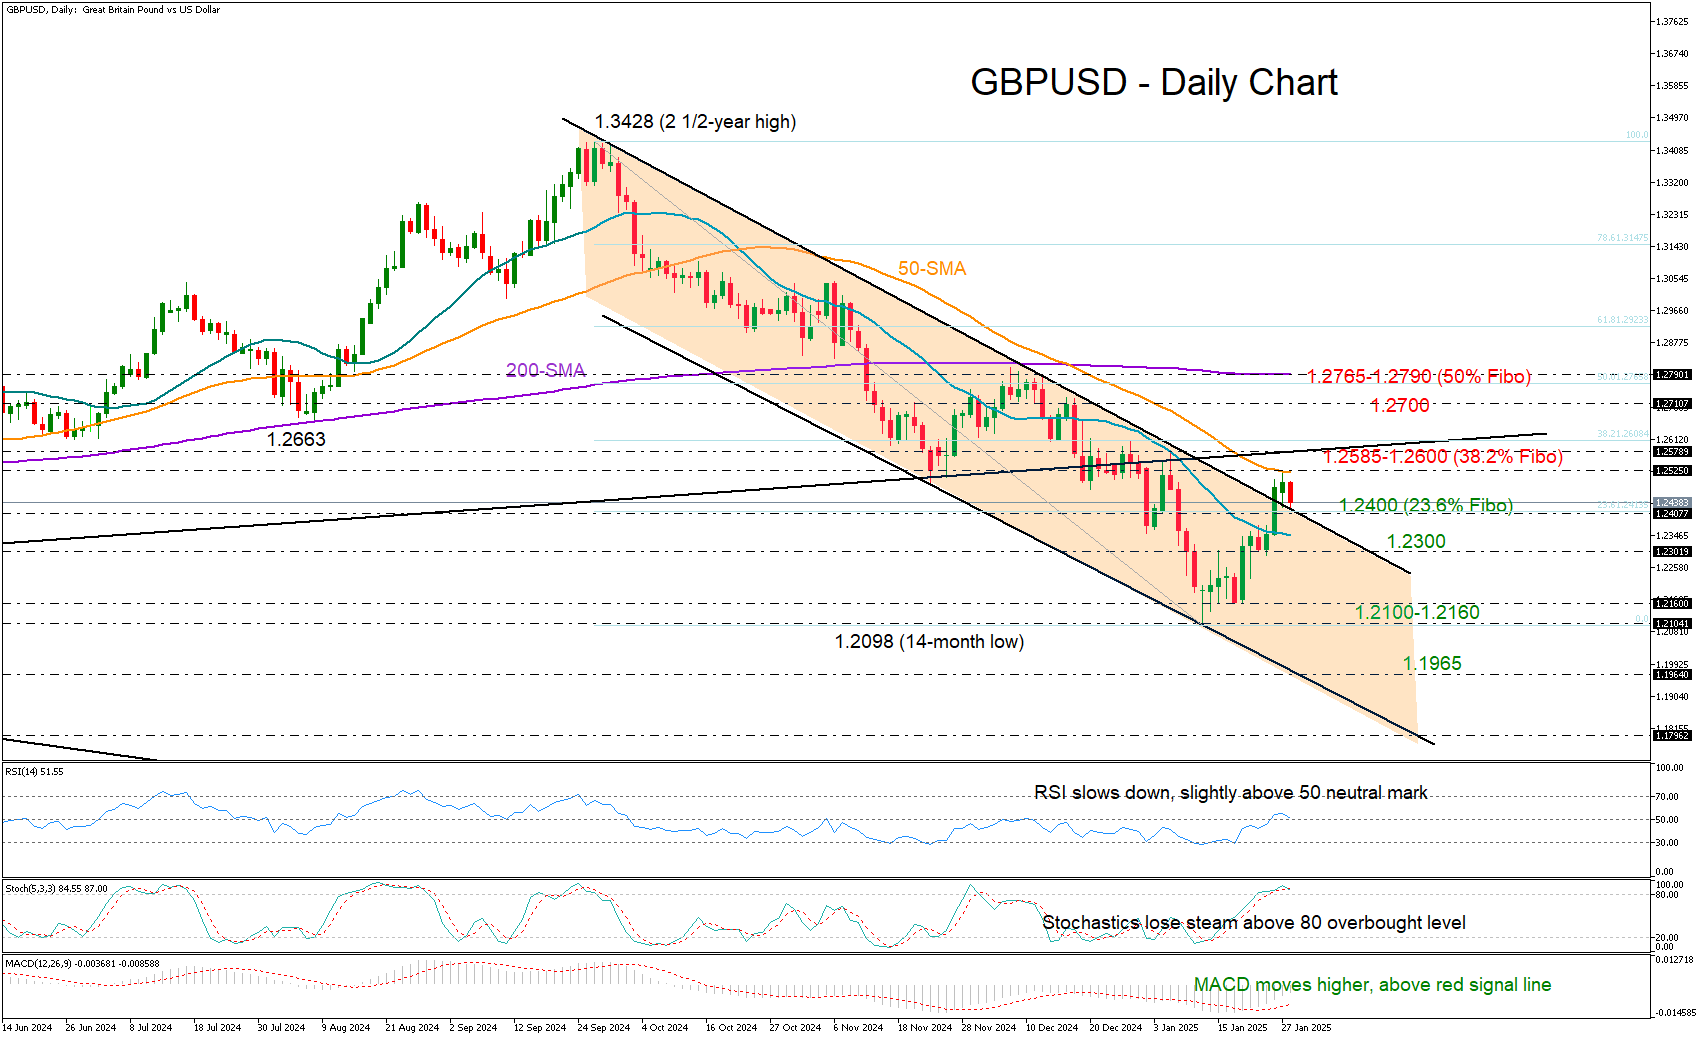
UK Chancellor Reeves in a keynote speech today failed to persuade sterling of her growth-reviving plans. It’s her first high-profile appearance since delivering the October Budget. A series of tax increases caused consumer and business confidence to have plummeted while her spending plans co-triggered sharply higher UK bond yields. Reeves defended the measures as taking on responsibility for repairing public finances while her pledge for going “further and faster” mostly relies on infrastructure projects. UK gilt yields ease a few basis points (up to 3 bps in the 10-yr) in a move shared by peers. German rates are down between 0.5-1.8 bps in a bull steepener. US rates barely budged with net daily changes of less than 1.5 bp. An early-morning attempt by the pound to eke out some gains ran into resistance pretty soon. EUR/GBP is now marginally lower for the day to change hands in the 0.838 region. The US dollar extends yesterday’s comeback with gains against every major currency but JPY. EUR/USD dives back sub 1.04. The trade-weighted greenback takes out the 108 lever. The Aussie dollar underperforms. This morning’s Q4 inflation print all but paved the way for the central bank to kick off its easing cycle at its February policy meeting. Stock optimism is back. If the EuroStoxx50 holds on to its 0.6% gain it will close at the highest level since 2000. Wall Street opens mixed ahead of tonight’s Fed policy meeting.
The Fed will hold rates steady at 4.25-4.5% against the backdrop of a healthy economy and still-above target inflation. Economic data since the Fed’s and chair Powell’s hawkish pivot in December has been outright strong and offered no reason to scale down the rhetoric. That should place a bottom below US yields and the dollar. Trump is a wildcard. Powell will probably keep his cards close to his chest in terms of what the central bank expects of his (yet-to-be-announced) policies going forward. Given the state of the economy the Fed has and will use the time to be at the sidelines. US money markets currently discount the first reduction not before June – a reasonable assumption for now. But POTUS will surely have a say on the Fed’s decision not to cut rates after doing so three times straight. Trump pressed for lower (global) policy rates during his virtual appearance in Davos last week. He might well trigger more market volatility than the decision itself.
News & Views
The Swedish Riksbank (RB) today as expected reduced its policy rate by 25 bps to 2.25%. This brings the cumulative amount of interest rate cuts since the start of the easing cycle in May last year at 175 bps. The Riksbank sees the outlook for inflation and growth broadly in line with the forecasts from December. Inflationary pressures are deemed to be consistent with inflation around two% (CPIF inflation was 0.3% M/M and 1.5% Y/Y in December). There are signs that an economic rebound is on the way, but activity remain weak for now. Interest rate cuts have yet to reach their full positive impact on households’ and companies’ finances. The RB didn’t change guidance from December that today’s rate cut might be the end of the easing cycle, but remains prepared to act if the outlook for inflation and economic activity changes. Amongst a long list of factors of uncertainty, the RB mentions the risks related to the recovery of the Swedish economy and the krona exchange rate. Markets are still pondering the chances of an additional RB rate cut later this year, e.g. if growth would turn out weaker than expected. The krone today gains marginally but the EUR/SEK cross rate remains blocked in a very tight range near 11.50 (currently 11.456).
The National Bank of Belgium’s flash estimate of 2024 Q4 GDP growth amounted to 0.2% Q/Q. Activity was 1.1% higher compared the final quarter of 2023. An initial analysis shows that, in comparison to the previous quarter, value added was down by 0.1% in industry. Value added rose by 0.7% in the construction industry. The services sector continued to report positive growth of 0.2%. For 2024 as a whole, GDP grew by 1.0%. Value added fell by 1.0% in industry. Value added was up by 1.0% in construction and 1.3% in services.
BoC cuts rates to 3.00%, flags trade risks and ends QT
BoC lowered its overnight rate target by 25bps to 3.00% as widely expected. In accompanying statement, the central bank warned that a prolonged trade conflict with the US could strain economic growth and drive inflation higher.
BoC noted that "if broad-based and significant tariffs were imposed, the resilience of Canada’s economy would be tested." Policymakers emphasized that they will closely monitor trade developments and assess their impact on economic activity, inflation, and future policy decisions.
The updated projections suggest a modest recovery in economic growth. Following an estimated 1.3% expansion in 2024, GDP is now expected to grow by 1.8% in both 2025 and 2026, slightly exceeding potential growth. Inflation is projected to remain near the 2% target over the next two years, reinforcing expectations that BoC will maintain a cautious approach to policy easing.
The central bank also announced plans to complete the normalization of its balance sheet by ending quantitative tightening. BoC will restart asset purchases in early March, adopting a gradual pace to ensure balance sheet stabilization while aligning with economic growth.
(BOC) Bank of Canada reduces policy rate by 25 basis points to 3%, announces end of quantitative tightening
The Bank of Canada today reduced its target for the overnight rate to 3%, with the Bank Rate at 3.25% and the deposit rate at 2.95%. The Bank is also announcing its plan to complete the normalization of its balance sheet, ending quantitative tightening. The Bank will restart asset purchases in early March, beginning gradually so that its balance sheet stabilizes and then grows modestly, in line with growth in the economy.
Projections in the January Monetary Policy Report (MPR) published today are subject to more-than-usual uncertainty because of the rapidly evolving policy landscape, particularly the threat of trade tariffs by the new administration in the United States. Since the scope and duration of a possible trade conflict are impossible to predict, this MPR provides a baseline forecast in the absence of new tariffs.
In the MPR projection, the global economy is expected to continue growing by about 3% over the next two years. Growth in the United States has been revised up, mainly due to stronger consumption. Growth in the euro area is likely to be subdued as the region copes with competitiveness pressures. In China, recent policy actions are boosting demand and supporting near-term growth, although structural challenges remain. Since October, financial conditions have diverged across countries. US bond yields have risen, supported by strong growth and more persistent inflation. In contrast, yields in Canada are down slightly. The Canadian dollar has depreciated materially against the US dollar, largely reflecting trade uncertainty and broader strength in the US currency. Oil prices have been volatile and in recent weeks have been about $5 higher than was assumed in the October MPR.
In Canada, past cuts to interest rates have started to boost the economy. The recent strengthening in both consumption and housing activity is expected to continue. However, business investment remains weak. The outlook for exports is being supported by new export capacity for oil and gas.
Canada’s labour market remains soft, with the unemployment rate at 6.7% in December. Job growth has strengthened in recent months, after lagging growth in the labour force for more than a year. Wage pressures, which have proven sticky, are showing some signs of easing.
The Bank forecasts GDP growth will strengthen in 2025. However, with slower population growth because of reduced immigration targets, both GDP and potential growth will be more moderate than was expected in October. Following growth of 1.3% in 2024, the Bank now projects GDP will grow by 1.8% in both 2025 and 2026, somewhat higher than potential growth. As a result, excess supply in the economy is gradually absorbed over the projection horizon.
CPI inflation remains close to 2%, with some volatility due to the temporary suspension of the GST/HST on some consumer products. Shelter price inflation is still elevated but it is easing gradually, as expected. A broad range of indicators, including surveys of inflation expectations and the distribution of price changes among components of the CPI, suggests that underlying inflation is close to 2%. The Bank forecasts CPI inflation will be around the 2% target over the next two years.
Setting aside threatened US tariffs, the upside and downside risks around the outlook are reasonably balanced. However, as discussed in the MPR, a protracted trade conflict would most likely lead to weaker GDP and higher prices in Canada.
With inflation around 2% and the economy in excess supply, Governing Council decided to reduce the policy rate a further 25 basis points to 3%. The cumulative reduction in the policy rate since last June is substantial. Lower interest rates are boosting household spending and, in the outlook published today, the economy is expected to strengthen gradually and inflation to stay close to target. However, if broad-based and significant tariffs were imposed, the resilience of Canada’s economy would be tested. We will be following developments closely and assessing the implications for economic activity, inflation and monetary policy in Canada. The Bank is committed to maintaining price stability for Canadians.
Information note
The next scheduled date for announcing the overnight rate target is March 12, 2025. The Bank will publish its next full outlook for the economy and inflation, including risks to the projection, in the MPR on April 16, 2025.
BoC Poised to Cut Rates, Can. Dollar Edges Lower
The Canadian dollar is steady on Wednesday. In the European session, USD/CAD is trading at 1.44236, up 0.23% on the day. It should be a busy day for the Canadian dollar, with the Bank of Canada and the Federal Reserve announcing rate decisions.
Bank of Canada expected to trim rates while Fed will hold
I can’t remember the last time that the Federal Reserve and the Bank of Canada held their rate meetings on the same day, which should make for a lively North American session. The Bank of Canada is expected to cut rates while the Fed is virtually certain to maintain rates.
The Bank of Canada has been aggressive in its easing cycle, chopping borrowing costs by 175 basis points since June 2024, including two consecutive oversize cuts of 50 basis points in October and December. This time, the BoC is expected to ease up and deliver a modest rate cut of 25 basis points, which would lower the cash rate to 3%, the lowest in over two years. It’s a very different world than a month ago, as US President Trump has clouded the global economic outlook with his threat of tariffs.
Trump’s tariffs could be devastating for the Canadian economy, which is heavily intertwined with its southern neighbor. The US is Canada’s biggest trade partner by far, with some 76% of Canada’s exports going to the US. Understandably, the prospect of a trade war with the US is a huge concern and Bank of Canada Governor Macklem called the trade threat a “major new uncertainty” in December, even before Trump took office.
Another headache for the BoC is the swooning loonie, which is down over 6% against the US dollar since September 2024. If the BoC cuts today and the Fed holds, as expected, there will be further downward pressure on the Canadian dollar as the US/Canada rate differential will widen.
The Federal Reserve is expected to maintain rates at the 4.25%-4.5% range today, after three straight reductions in 2024. The Fed has signaled that it plans to cut rates gradually, but the strong US economy could mean that the Fed will cut only once or twice in 2025.
USD/CAD Technical
- USD/CAD tested support at 1.4394 earlier. Next, there is support at 1.4341
- There is resistance at 1.4428 and 1.4455
Ethereum as a Canary in the Coal Mine
Market Picture
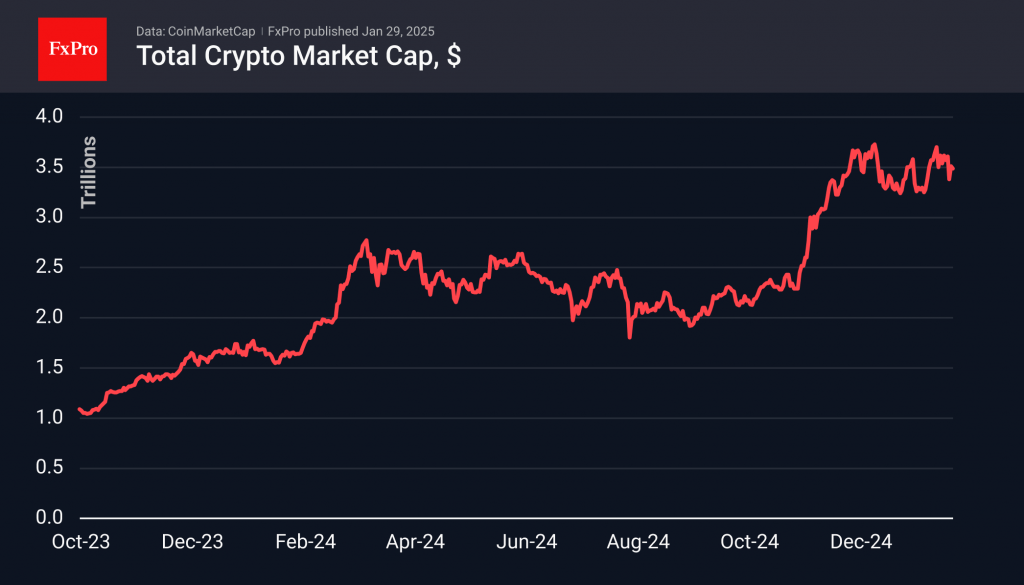
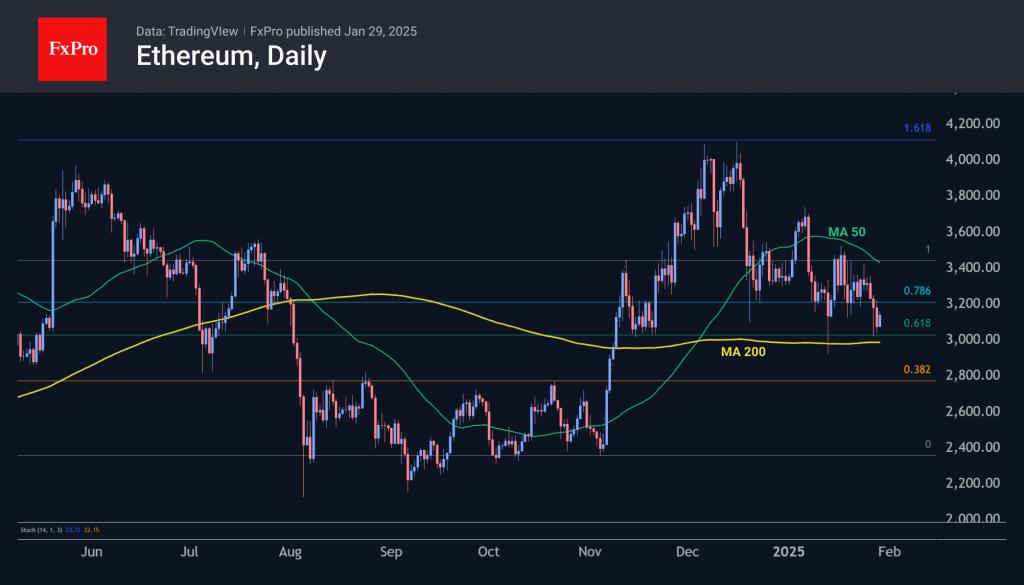
The crypto market is not yet showing sustained growth. The positive momentum seen on Tuesday morning was replaced by selling pressure. The cryptocurrency market quickly recovered to the $3.50 trillion level, where it consolidated after reaching the $3.6 trillion mark late last week.
Bitcoin gained 2% on Wednesday, trading around the $102.5K mark. The previous four daily candles closed with declines, undermining investor confidence. Nevertheless, bitcoin remains above its 50-day moving average, and the current lull can be attributed to risk aversion ahead of the Fed meeting.
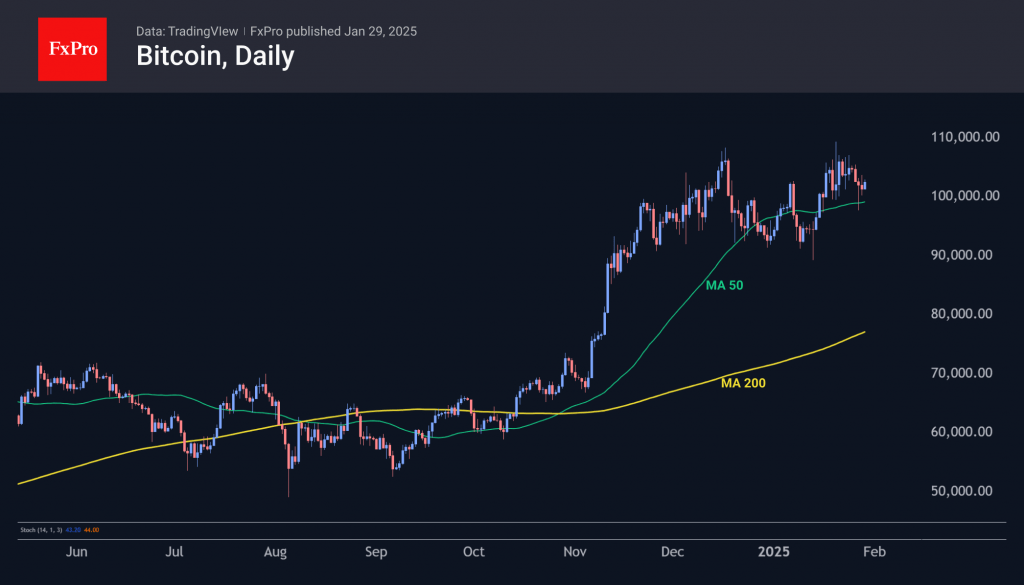
Ethereum bounced off the $3,000 level on Wednesday morning, near the 200-day moving average and 61.8% retracement level of the November rally. Ethereum may serve as the canary in the coal mine: a significant drop below the $3,000 mark could trigger a widespread sell-off in crypto assets.
News background
Experts at Standard Chartered see Bitcoin’s fall caused by DeepSeek as a buying opportunity ahead of potential market stabilisation. The Fed meeting and reports of high-tech companies on 30 January will play a key role in the dynamics.
Over the past week, MicroStrategy sold shares and additionally bought 10,107 BTC for about $1.1 billion at an average price of about $105,596. The company’s balance sheet shows 471,107 BTC purchased for $30.4 billion at an average price of $64,511 per coin.
Jim Cramer, former hedge fund manager at Cramer & Co. and host of the Mad Money show, said he’d rather invest in Bitcoin than MicroStrategy stock. MicroStrategy accounts for 76% of public company bitcoin reserves and 2.24% of its overall supply.
Tuttle Capital Management has filed a proposal with the SEC to register ten crypto-ETFs with leverage of 2x, including meme-based products TRUMP and MELANIA. Other ETFs will be based on XRP, Solana, Litecoin, Bonk, BNP, Cardano, Chainlink and Polkadot.
French law enforcement authorities have launched a judicial investigation against Binance, accusing the platform of money laundering and drug trafficking.
USDCHF: Upward Momentum
USDCHF, H4
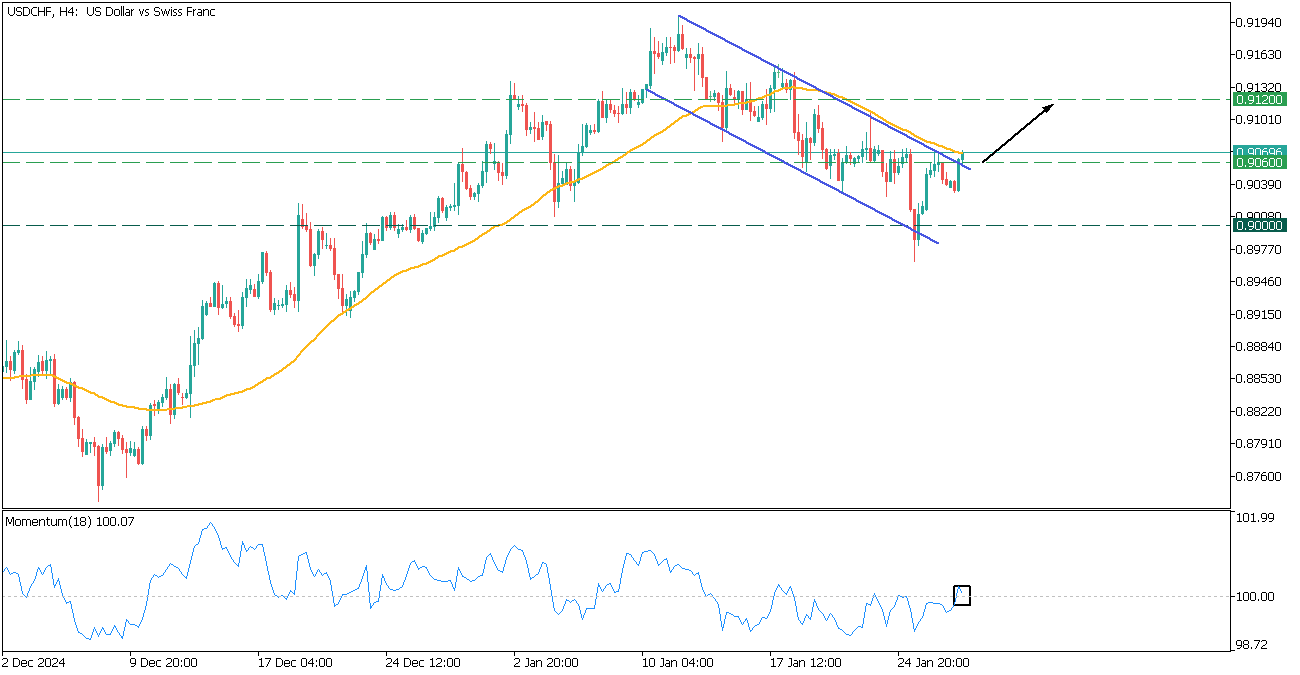
USDCHF breaks above the descending channel and 0.9060 resistance.
- Currently the price faces the 50-MA, while the Momentum crosses the 100-line up, giving a power for the further growth.
- Consider a long trade if the price breaks above the 50-MA with the target at 0.9120.
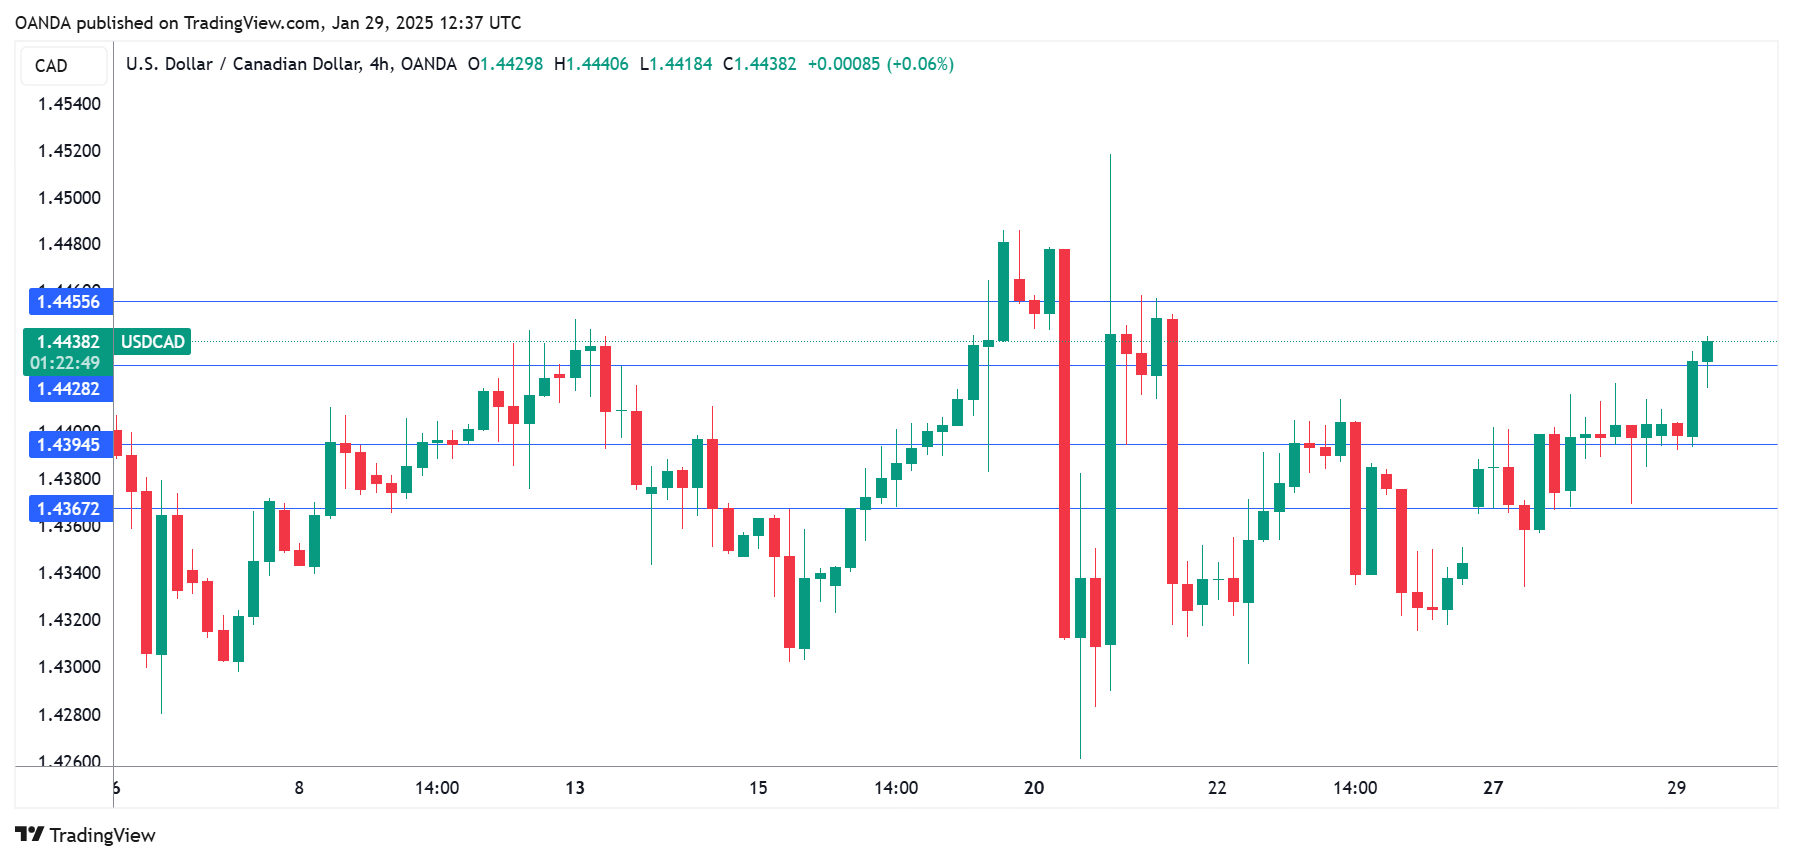
USD/CAD Holds Steady as BoC Decision Looms
- USD/CAD is in recovery mode but not out of the woods.
- Resistance within short distance at 1.4430-1.4465.
- Bank of Canada expected to lower interest rates.
USDCAD has been in a gradual recovery phase over the past week, resuming its sideways structure from mid-December after a temporary drop to 1.4259.
With the clock ticking down to the BoC policy announcement (14:45 GMT), which could reveal the sixth consecutive reduction to 3.0%, investors are wondering whether the bulls can lift the pair beyond its four-year high of 1.4484.
The upturn in the RSI and the stochastic oscillator looks promising, though the broken support trendline from September, which is now acting as resistance near 1.4430, remains a struggle. The upper band of the rectangle seen around 1.4465 will be closely watched as well. A break above this zone could trigger a surge towards the 2020 and 2016 highs encapsulated within the 14650-1.4700 zone, with the next major target seen near the constraining ascending line around 1.4780-1.4800.
In the event of a backward flip, the 20-day exponential moving average (EMA) at 1.4360 could provide a cushion ahead of the 1.4255-1.4290 area, which includes the 50-day EMA and the 23.6% Fibonacci retracement of the September-January uptrend. A step lower could signal a potential negative trend reversal, prompting a swift decline towards 1.4100.
For now, USDCAD is holding a neutral bias, with traders waiting for either a decisive move above 1.4430-1.4465 or below 1.4255-1.4290 to drive the pair accordingly.
Gold Prices Climb as Oil Takes a Hit
Gold price rallied further and traded above the $2,750 resistance. Crude oil is showing bearish signs and might decline below $72.20.
Important Takeaways for Gold and Oil Prices Analysis Today
- Gold price started a steady increase from the $2,715 zone against the US Dollar.
- It cleared a connecting bearish trend line with resistance at $2,750 on the hourly chart of gold at FXOpen.
- Crude oil prices failed to clear the $80.00 region and started a fresh decline.
- There is a key bearish trend line forming with resistance at $73.85 on the hourly chart of XTI/USD at FXOpen.
Gold Price Technical Analysis
On the hourly chart of Gold at FXOpen, the price found support near the $2,715 zone. The price remained in a bullish zone and started a strong increase above $2,730.
There was a decent move above the 50-hour simple moving average and $2,750. The bulls pushed the price above the $2,765 and $2,770 resistance levels. Finally, the price climbed as high as $2,785 before there was a pullback.
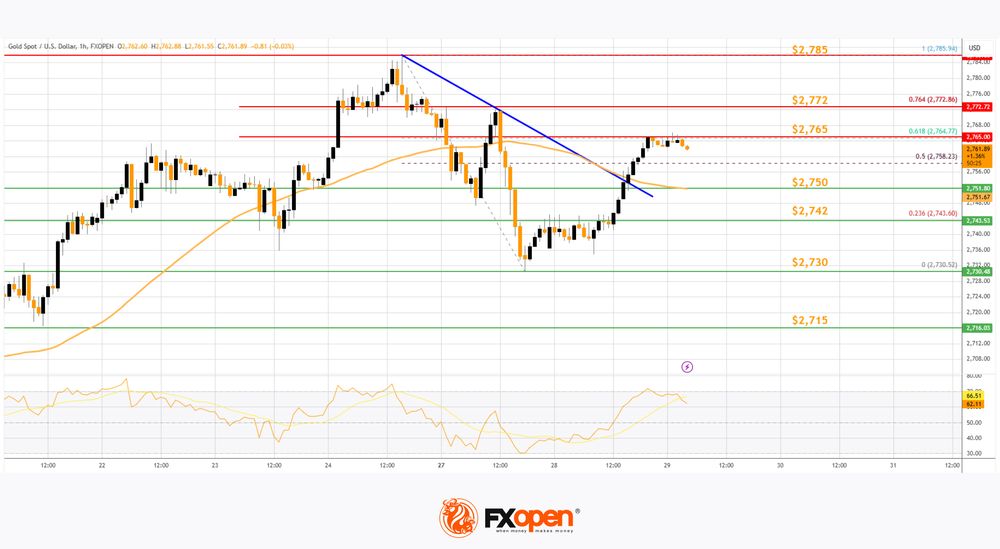
The price tested the $2,730 zone and is currently rising. There was a move above the 50% Fib retracement level of the downside correction from the $2,785 swing high to the $2,730 low, and the RSI is stable above 60.
Immediate resistance is near the $2,765 level and the 61.8% Fib retracement level of the downside correction from the $2,785 swing high to the $2,730 low.
The next major resistance is near the $2,772 level. An upside break above the $2,772 resistance could send Gold price toward $2,785. Any more gains may perhaps set the pace for an increase toward the $2,800 level.
Initial support on the downside is near $2,750 and the 50-hour simple moving average. The first major support is near the $2,742 zone. If there is a downside break below the $2,742 support, the price might decline further.
In the stated case, the price might drop toward the $2,730 zone. Any more losses might push the price toward the $2,715 level.
Oil Price Technical Analysis
On the hourly chart of WTI Crude Oil at FXOpen, the price struggled to clear the $80.00 resistance zone against the US Dollar. The price started a fresh decline below the $76.35 support.
The price even dipped below the $75.00 level and the 50-hour simple moving average. The bulls are now active near the $72.20 level. A low was formed at $72.16, and the price is now consolidating losses. If there is a fresh increase, it could face resistance near the 23.6% Fib retracement level of the downward move from the $79.44 swing high to the $72.16 low at $73.85.
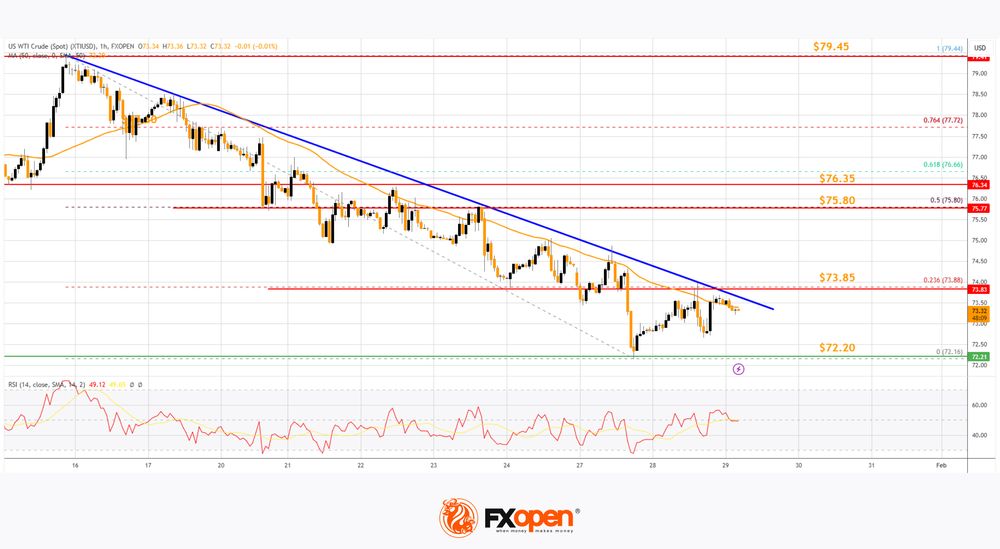
There is also a key bearish trend line forming with resistance at $73.85. The first major resistance is near the $75.80 level or the 50% Fib retracement level of the downward move from the $79.44 swing high to the $72.16 low.
Any more gains might send the price toward the $76.35 level. Any more gains might call for a test of $79.45. Conversely, the price might continue to move down and revisit the $72.20 support. The next major support on the WTI crude oil chart is $70.00.
If there is a downside break, the price might decline toward $70.00. Any more losses may perhaps open the doors for a move toward the $68.50 support zone.
Start trading commodity CFDs with tight spreads. Open your trading account now or learn more about trading commodity CFDs with FXOpen.
This article represents the opinion of the Companies operating under the FXOpen brand only. It is not to be construed as an offer, solicitation, or recommendation with respect to products and services provided by the Companies operating under the FXOpen brand, nor is it to be considered financial advice.
FTSE In Process Of 5 Waves Advance With Pullback Expectation
Short Term Elliott Wave View in FTSE index shows that the Index breaks to new all-time highs confirming the right side of the market remains bullish. The rally from 12.20.2024 low looks to be extending higher in an impulsive structure within wave 1. While pullback to 8002.28 low ended wave (4) as a triangle consolidation & made new highs supports more strength to continue. Up from wave (4), wave (i) ended at 8152.01 high and wave (ii) pullback ended at 8094.88 low.
The Index resumed higher in wave (iii) which ended at 8270.60 high. Pullback in wave (iv) ended at 8189.50 low. The final leg wave (v) ended at 8326.32 low which also completed wave ((i)) in higher degree. Index then pullback in wave ((ii)) which ended at 8192.31 low. Index has resumed higher again in wave ((iii)). Up from wave ((ii)) low, lesser degree wave (i) ended at 8244.31 high. Pullback in wave (ii) ended at 8193.54 low. Wave (iii) higher ended at 8584.73 high and pullback in wave (iv) ended at 8527.92 low. Then final push higher towards 8586.68 high ended wave (v) thus completed wave ((iii)). Down from there, wave ((iv)) pullback ended at 8462.18 low. Near-term, as far as dips remain above 8462.18 low the index is in process of 3 waves advance with 1 more push higher. Minimum towards 8616.11- 8663.95 area higher to end wave ((v)) of 1. Afterwards, a pullback in wave 2 is expected to take place in 3, 7 or 11 swings before more upside resumes.
FTSE 1-Hour Elliott Wave Chart From 1.29.2025

FTSE Elliott Wave Video
https://www.youtube.com/watch?v=Q2_NEDxzkAc
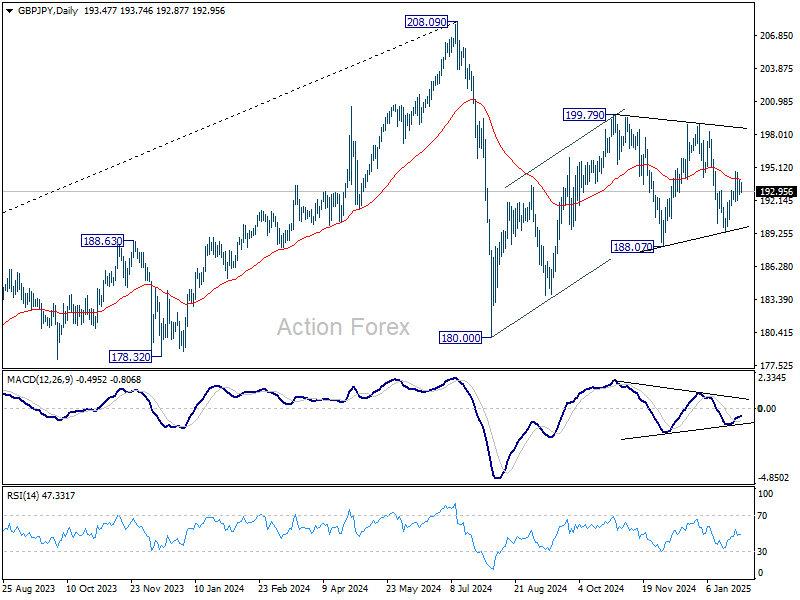
GBP/JPY Daily Outlook
Daily Pivots: (S1) 192.82; (P) 193.43; (R1) 194.13; More...
Intraday bias in GBP/JPY remains neutral at this point. Overall outlook is unchanged that corrective pattern from 180.00 might extend. On the upside above 194.73 will target 198.94/197.79 resistance zone. On the downside, however, break of 192.05 minor support will turn bias back to the downside for 189.31 support instead.
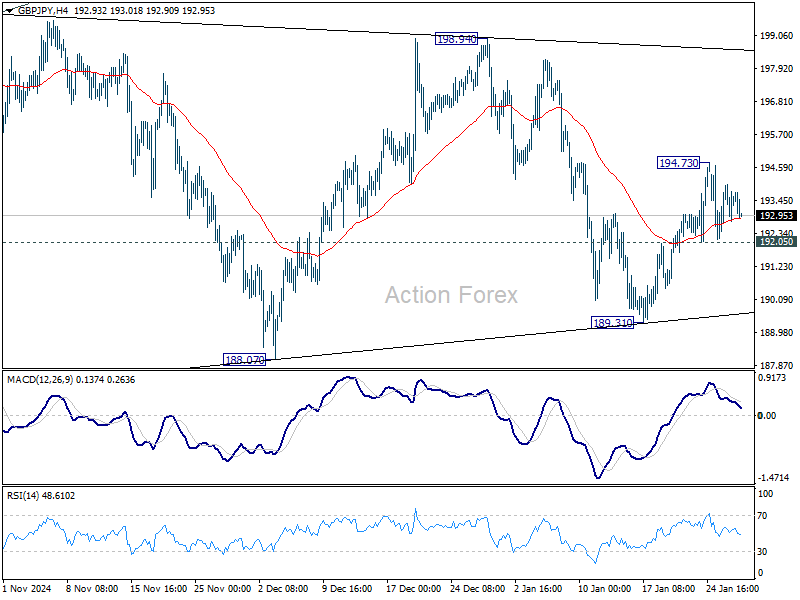
In the bigger picture, price actions from 208.09 are seen as a correction to whole rally from 123.94 (2020 low). The range of consolidation should be set between 38.2% retracement of 123.94 to 208.09 at 175.94 and 208.09. However, decisive break of 175.94 will argue that deeper correction is underway.