
Sample Category Title
AUD/USD Restarts Decline: More Losses Ahead? US GDP Next
Key Highlights
- AUD/USD struggled near 0.6330 and started a fresh decline.
- It traded below a key bullish trend line with support at 0.6240 on the 4-hour chart.
- EUR/USD started a fresh decline from the 1.0520 zone.
- The US GDP could grow 2.8% in Q4 2024 (Preliminary).
AUD/USD Technical Analysis
The Aussie Dollar failed to extend gains above 0.6330 against the US Dollar. AUD/USD started a decline below the 0.6300 and 0.6250 levels.
Looking at the 4-hour chart, the pair traded below a key bullish trend line with support at 0.6240. There was a clear move below the 50% Fib retracement level of the upward move from the 0.6131 swing low to the 0.6330 high.
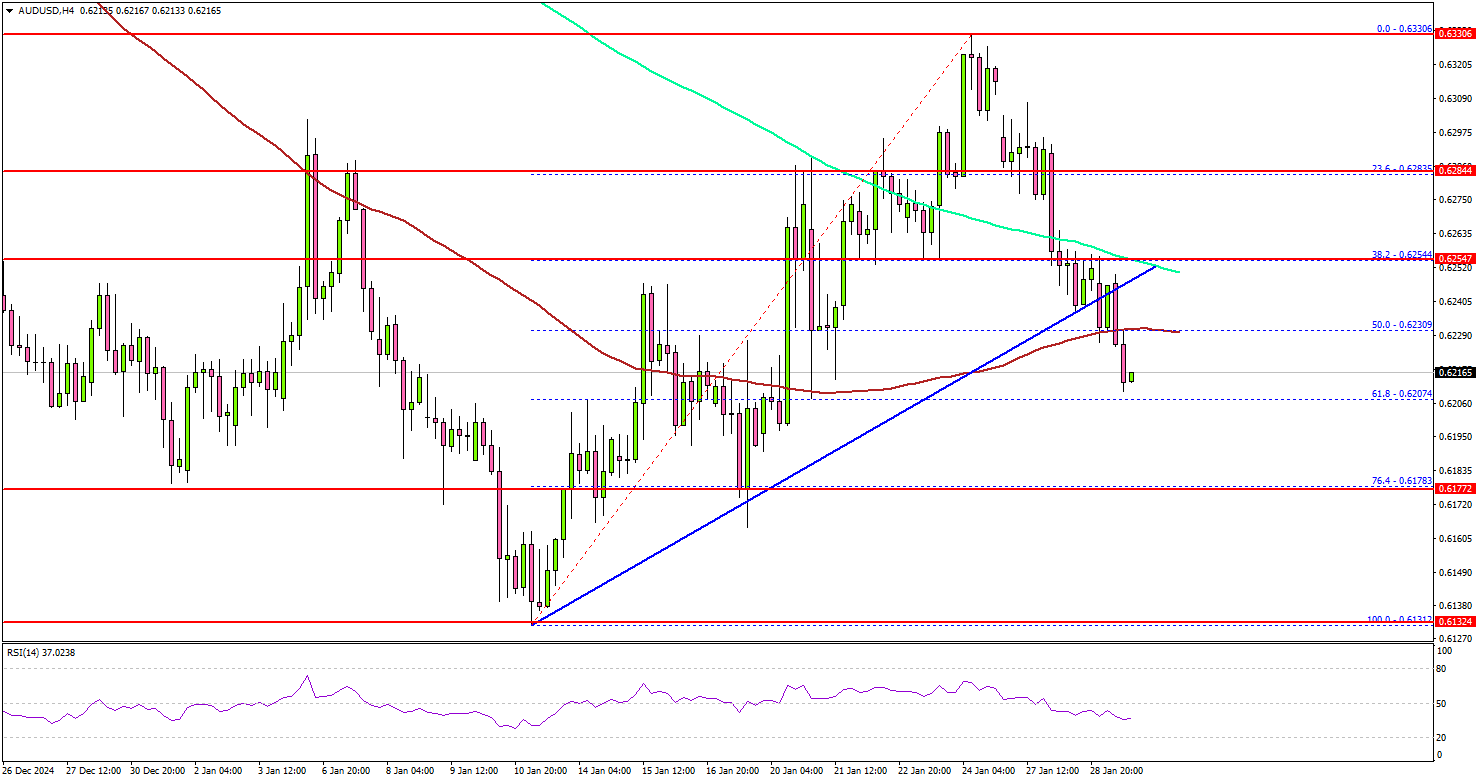
The pair even traded below the 100 simple moving average (red, 4-hour) and the 200 simple moving average (green, 4-hour). On the downside, immediate support sits near the 0.6200 level.
The next key support sits near the 0.6175 level and the 76.4% Fib retracement level of the upward move from the 0.6131 swing low to the 0.6330 high. Any more losses could send the pair toward the 0.6120 level.
On the upside, the pair seems to be facing hurdles near the 0.6250 level. The next major resistance is near the 0.6285 level. A close above the 0.6285 level could set the tone for another increase. In the stated case, the pair could even clear the 0.6330 resistance.
Looking at EUR/USD, the pair failed to start a fresh decline and started and extended losses below the 1.0420 support.
Upcoming Economic Events:
- US Initial Jobless Claims - Forecast 220K, versus 223K previous.
- US Gross Domestic Product for Q4 2024 (Preliminary) – Forecast 2.8% versus previous 3.1%.
Elliott Wave View on DAX Looking for Pullback to Find Buyers
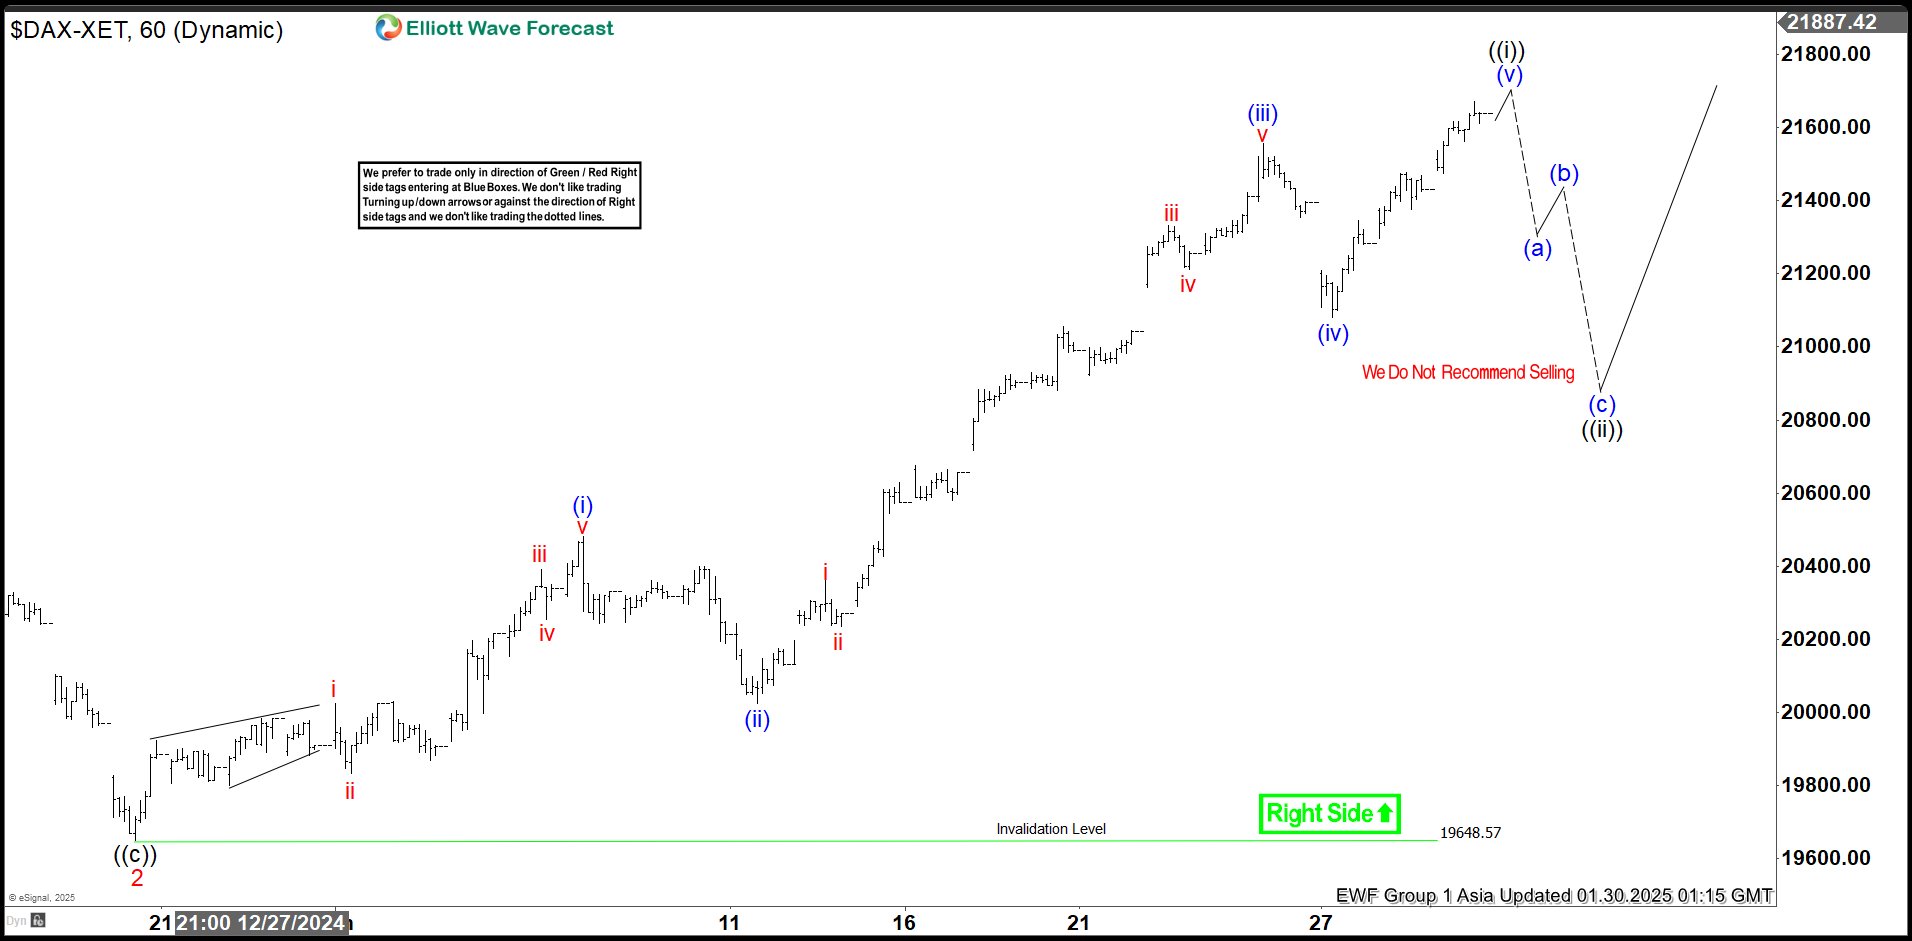
Short Term Elliott Wave View in DAX suggests that rally from 11.19.2024 low is in progress as a 5 waves nesting impulse. Up from 11.19.2024 low, wave 1 ended at 20522.82 and wave 2 dips ended at 19649.87. The Index nested higher in wave 3. Up from wave 2, wave i ended at 20024.79 and wave ii ended at 19833.82. Wave iii higher ended at 20391.17 and wave iv ended at 20255.85. Wave v higher ended at 20480.49 which completed wave (i).
Pullback in wave (ii) ended at 20025.28. Index has resumed higher in wave (iii). Up from wave (ii), wave i ended at 20362.59 and wave ii ended at 20234.26. Wave iii higher ended at 21330.87 and wave iv ended at 21212.25. Wave v higher ended at 21491.51 which completed wave (iii). Pullback in wave (iv) ended at 21081.61. Expect wave (v) to end soon which should complete wave ((i)) in higher degree. Afterwards, wave ((ii)) pullback should correct cycle from 12.20.2024 low before the rally resumes. Near term, as far as pivot at 19648.57 low stays intact, expect dips to find buyers in 3, 7, 11 swing for more upside.
DAX 1-Hour Elliott Wave Chart From 1.29.2025
DAX Elliott Wave Video
https://www.youtube.com/watch?v=Lu7OV4NQdBc
GBPAUD Price Action Breakdown
The AUDUSD pair declined on Wednesday, dropping to 0.6220 after the US Federal Reserve's latest decision. As expected, the Fed kept interest rates steady at 4.25%-4.50%, but its statement was cautious, removing previous comments about inflation improving. This signaled that future rate cuts might not come as soon as expected, boosting the US Dollar and putting pressure on the Aussie.
From a technical perspective, the pair remains weak, with indicators showing bearish momentum. If AUDUSD falls below 0.6200, it could reach 0.6170, while resistance is around 0.6230.
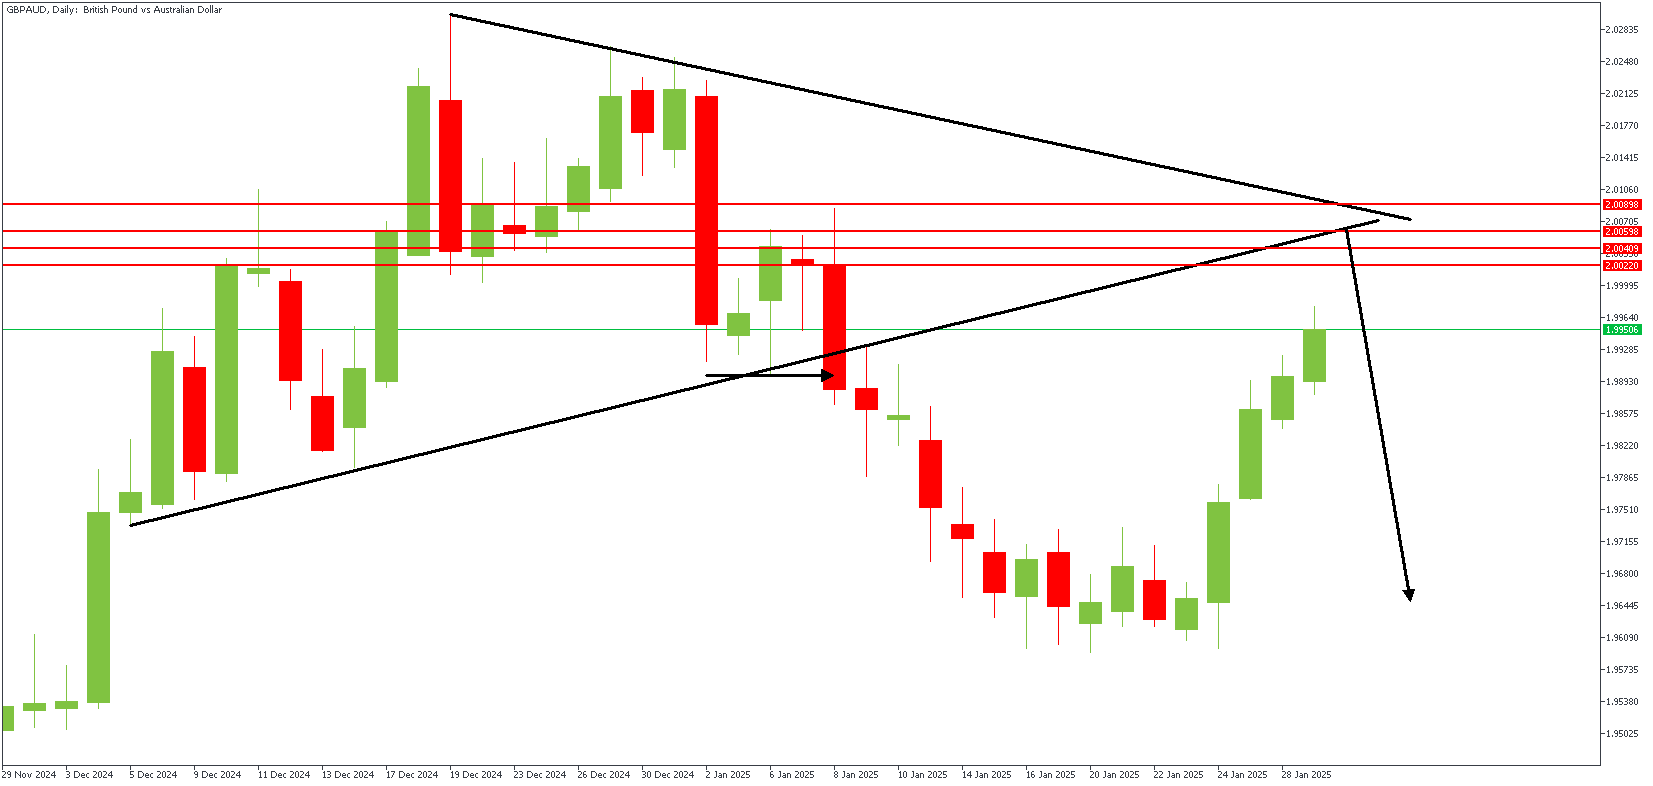
GBPAUD – D1 Timeframe
Typically, when a price breaks a trendline, the retest of the same trendline often confirms a change in the market's direction. In the case of the price action on the daily timeframe chart of GBPAUD, the price broke below the trendline support and seems to be heading back towards the same trendline, but now as resistance. A hidden rally-base-drop supply zone aligns perfectly with the area of interest at the intersection of the two resistance trendlines. The sentiment from the daily timeframe is bearish.
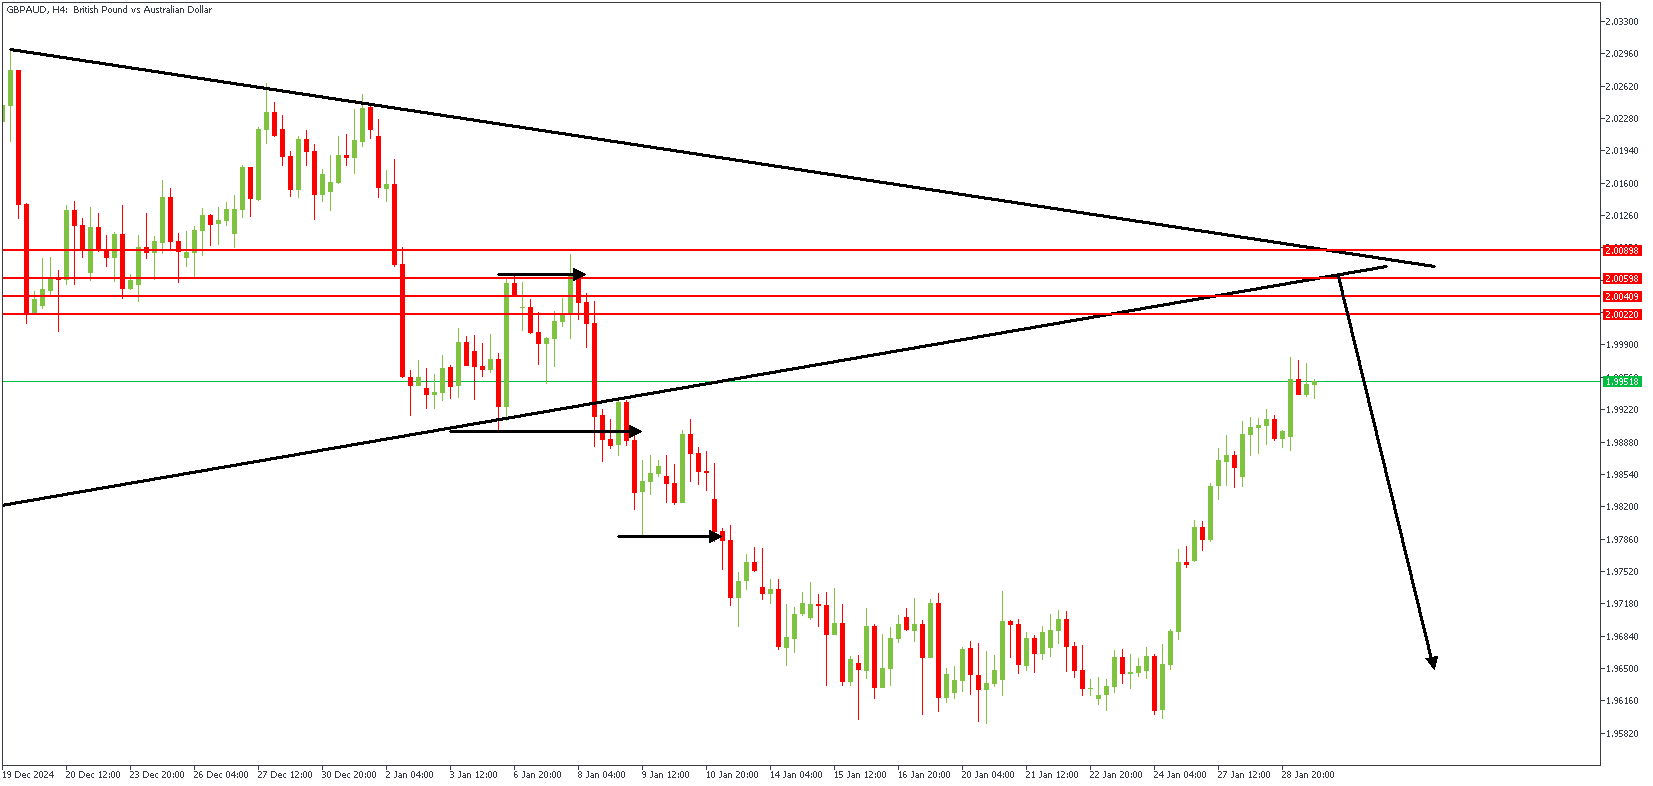
GBPAUD – H4 Timeframe
The 4-hour timeframe chart of GBPAUD lends more detail to the original setup on the daily timeframe chart. Here, we are able to see the FVG (Fair Value Gap) more clearly, with the supply zone being much more visible.
Analyst's Expectations:
- Direction: Bearish
- Target: 1.96794
- Invalidation: 2.01398
FOMC on Hold and In No Hurry to Cut Further
Summary
- As universally expected, the FOMC decided at its policy meeting today to keep rates unchanged. The decision to maintain the target range for the federal funds rate at 4.25%–4.50% was universally supported by all 12 voting members of the FOMC.
- The post-meeting statement continued to describe the pace of economic activity as "solid." It also upgraded its characterization of the labor market. Previously, the Committee said that "labor market conditions have generally eased." The FOMC now views labor market conditions as "solid."
- The FOMC continues to characterize inflation as "somewhat elevated."
- In sum, there was little in today's statement to suggest the FOMC is contemplating another rate cut in the near future.
- With the pace of real economic activity holding up and with inflation remaining above target, we think the FOMC will keep rates on hold until the second half of 2025.
FOMC Appears To Be in Little Hurry to Cut Further
As universally expected, the Federal Open Market Committee (FOMC) left its target range for the federal funds rate unchanged at 4.25%–4.50% at the conclusion of its meeting today. Unlike in December, when Cleveland Fed President Beth Hammack dissented from the decision to cut rates by 25 bps—she preferred to keep rates on hold at that meeting—today's decision was unanimously supported by all 12 voting members of the Committee.
The post-meeting statement continued to note that "economic activity has continued to expand at a solid pace." It also stated that "the unemployment rate has stabilized at a low level in recent months." In that regard, the unemployment rate trended up from 3.4% in April 2023 to 4.2% in mid-2024. But it has subsequently leveled off at just over 4% (Figure 1). The statement went on to characterize labor market conditions as "solid." This characterization of the labor market represents an upgrade from the December statement, which said that "labor market conditions have generally eased."
Additionally, the December statement noted that "inflation has made progress toward the Committee's 2 percent objective," although it continued to describe inflation as "somewhat elevated." Today's statement simply said that "inflation remains somewhat elevated." In that regard, the year-over-year change in the core PCE deflator, which Federal Reserve officials believe is the best measure of the underlying rate of consumer price inflation, has leveled off noticeably above the FOMC's target of 2% (Figure 2).
In sum, there was little in today's statement to suggest the FOMC is contemplating another rate cut in the near future. The Summary of Economic Projections (SEP), which is the quarterly document that summarizes the macroeconomic forecasts of the individual Committee members, that was released in December showed that the median Committee member thought that an additional 50 bps of rate cuts would be appropriate by the end of the year. If the FOMC views only 50 bps of rate cuts by December as appropriate, then it clearly does not need to be in a hurry to cut rates.
Outlook; FOMC on Hold Until Second Half of 2025
As highlighted in our most recent U.S. Economic Outlook, we look for the FOMC to maintain its current target range for the federal funds rate until the second half of the year (Figure 3). Indeed, Chair Powell noted in his post-meeting press conference that policy "is significantly less restrictive" today than it was before the FOMC started to cut rates, which "means we do not need to be in a hurry" to ease further. As noted above, real economic activity is holding up reasonably well. If, as we expect, real GDP grew at an annualized rate of 2.3% in Q4-2024 on a sequential basis, then the economy would have expanded at a solid rate of 2.5% on a year-over-year basis. (The Bureau of Economic Analysis will release Q4 data on Thursday, January 30.) Additionally, we estimate that nonfarm payrolls rose by a solid 185K in January. (The Bureau of Labor Statistics will release employment data for January on February 7.) With inflation remaining stubbornly above target, we see little reason for the FOMC to cut rates in the near term. But with policy remaining somewhat restrictive, albeit not as restrictive as a few months ago, we are penciling in another 50 bps of easing by the end of 2025 (25 bps in September and another 25 bps in December). Thereafter, we look for the FOMC to maintain its target range at 3.75%–4.00% through the end of 2026.

The FOMC also made no changes today to the pace of balance sheet runoff, commonly referred to as "quantitative tightening" (QT). Specifically, the monthly caps of $25 billion of Treasury securities and $35 billion of mortgage-backed securities (MBS) will remain in place. Since peaking in early 2022 at roughly $9 trillion, the Fed's balance sheet has shrunk by about $2 trillion (Figure 4). As we wrote in our recent "Flashlight" report, we look for balance sheet runoff to continue through May. Starting June, we look for the Fed to maintain a constant size for the balance sheet through at least the end of the year. That said, we believe that the central bank wants to continue to reduce its MBS holdings, which currently total $2.2 trillion. Therefore, we think the Fed will begin to replace MBS paydowns one-for-one with Treasury securities.

Fed Pauses Rate Cut Cycle as Tariffs Loom Large
The Federal Reserve Open Market Committee (FOMC) maintained the federal funds rate in the 4.25% to 4.50% range and announced it would continue its balance sheet runoff.
The Fed justified its decision to hold rates steady by highlighting that the economy "continued to expand at a solid pace", while inflation still remains "somewhat elevated".
On the future path of policy, the statement shows that the Fed thinks risks are roughly balanced. There was no mention of risks coming from Trump tariffs nor how it would respond should a worst-case scenario unfold.
All of the members of the FOMC voted in favor of the decision.
Key Implications
A policy rate pause was always expected today. The more pressing question relates to how the Fed's outlook has changed following a flurry of President Trump's executive orders and under the threat of tariffs to various countries. The policy statement failed to touch on this. We look to see if Chair Powell can shed more light on this during his presser.
Markets are expecting the Fed to remain on hold through the spring. While the President's policies have had an impact on Fed pricing, the strength of the economy remains the main driver. The Fed benefits from strength in consumer spending and jobs, alongside wage gain stabilization. Inflation has also been more restrained, with the Fed's preferred core PCE index running at 2.5% on a three-month annualized basis. Solid growth and stable inflation mean that the bar for rate cuts is high. Unless we start to see weaker U.S. economic growth, we expect the Fed to remain on the sidelines.
Fed holds, offers no clear guidance for next cuts
FOMC left interest rates unchanged at 4.25–4.50% in a unanimous decision, as widely expected. However, the accompanying statement provided little clarity on the duration of the pause.
Fed simply reiterated that the timing and extent of future rate cuts will depend on incoming economic data, the evolving outlook, and the balance of risks..
The statement highlighted that the US economy continues to "expand at a solid pace," with the unemployment rate remaining stable at low levels and labor market conditions still "solid." Inflation remains "somewhat elevated."
Additionally, Fed emphasized that it remains "attentive to the risks to both sides of its dual mandate."
(FED) Federal Reserve Issues FOMC Statement
Recent indicators suggest that economic activity has continued to expand at a solid pace. The unemployment rate has stabilized at a low level in recent months, and labor market conditions remain solid. Inflation remains somewhat elevated.
The Committee seeks to achieve maximum employment and inflation at the rate of 2 percent over the longer run. The Committee judges that the risks to achieving its employment and inflation goals are roughly in balance. The economic outlook is uncertain, and the Committee is attentive to the risks to both sides of its dual mandate.
In support of its goals, the Committee decided to maintain the target range for the federal funds rate at 4-1/4 to 4-1/2 percent. In considering the extent and timing of additional adjustments to the target range for the federal funds rate, the Committee will carefully assess incoming data, the evolving outlook, and the balance of risks. The Committee will continue reducing its holdings of Treasury securities and agency debt and agency mortgage‑backed securities. The Committee is strongly committed to supporting maximum employment and returning inflation to its 2 percent objective.
In assessing the appropriate stance of monetary policy, the Committee will continue to monitor the implications of incoming information for the economic outlook. The Committee would be prepared to adjust the stance of monetary policy as appropriate if risks emerge that could impede the attainment of the Committee's goals. The Committee's assessments will take into account a wide range of information, including readings on labor market conditions, inflation pressures and inflation expectations, and financial and international developments.
Voting for the monetary policy action were Jerome H. Powell, Chair; John C. Williams, Vice Chair; Michael S. Barr; Michelle W. Bowman; Susan M. Collins; Lisa D. Cook; Austan D. Goolsbee; Philip N. Jefferson; Adriana D. Kugler; Alberto G. Musalem; Jeffrey R. Schmid; and Christopher J. Waller.
Mired in Uncertainty, Bank of Canada Cuts Again
The Bank of Canada cut its policy rate by 25 basis points as expected, but the focus of its commentary had less to do with its current assessment of the Canadian economy and much more on how to navigate an economy that potentially gets significantly knocked off course by U.S. tariffs.
The BoC had a good understanding (and confidence in) how the economy is currently travelling. With 200 bps of easing already in the pipeline, Canadian growth is low but slowly improving, the unemployment rate is near a peak, and inflation is now well within the BoC’s target range. We agree. Without any shocks, the central bank would likely continue to gradually ease towards, we think, 2% by year end, but in smaller magnitudes and at a slower pace than in 2024.
But, the BoC isn’t facing standard run-of-the-mill uncertainty in its outlook. Both the Monetary Policy Report and Governor Tiff Macklem’s communication took a very different tone this time around. If central banks use the idea that setting monetary policy in uncertain times is like walking around in a dark room and trying not to trip on furniture, the BoC could more appropriately be described as blindfolded with projectiles being thrown at it.
Indeed, the BoC is fighting two particular demons that make its base case forecasts and current assessment of the state of affairs far less useful than usual. Instead, the value of their communication is in the clues they drop about how they might navigate the shocks ahead. We think most signs continue to point to further declines in interest rates, the magnitude and speed of which will be determined by the details of a potential U.S.-Canada trade conflict.
1. The BoC is facing “more than unusual uncertainty.”
It mentions “uncertainty” 42 times in the report, and, even before launching into the MPR, the BoC states its economic outlook doesn’t include any specific U.S. tariff policies yet. Governor Macklem says that we are simply missing too many pieces of information to know exactly what a trade war means for Canada.
“There’s a lot of things we don’t know, when and for how long,” he says. “We don’t know what retaliatory measure… or fiscal measures will be taken in advance”.
As we highlighted in our A playbook for how to measure a tariff shock in Canada, those details can be very significant on the direction and size of the impact in Canada.
However, the forecasts recognize that tariff threats are already impacting financial markets and business decisions. We’ve also been highlighting that tariff threats creates a negative “uncertainty” shock that weighs on growth. Downward revisions to the BoC’s forecasts for growth in 2025 and 2026 to 1.8% reflects some of this.
Moreover, Governor Macklem noted tariff threats alone “weighed on our decision” and that the more the BoC could get the economy on “solid footing” ahead of the shock, the better. We think the mere possibility of tariffs will keep the BoC on a dovish bias as it tries to prepare Canada for a potential shock. Unlike a provincial or federal government, the BoC doesn’t have to keep any “powder dry” for what’s ahead. The central bank has the luxury of preparing the economy with this cut, and, we expect, future cuts as inflation is now comfortably below 2% for three of the past four months. Put differently, the risks of excess easing are quite low in Canada, especially relative to the U.S.
2. The BoC is challenged by the complexity of modelling a tariff shock on Canada and the central bank’s role in it.
Similarly to how RBC Economics described the transmission of a tariff shock in Canada, the BoC engages in an illustrative example that highlights the challenges of measuring how badly a tariff would hurt an economy and how many assumptions would need to go into the forecast. Policymakers appear to have avoided the idea that a single number can neatly summarize the risks ahead. Governor Macklem adds that the central bank is busy running scenarios and engaging in outreach with Canadians.
Still, how the BoC would respond in a prolonged trade conflict isn’t clear. Governor Macklem said it would depend on what ended up dominating the economy once tariffs arrived—the downsides on growth or the upsides of inflation. However, there were some important takeaways about how the BoC may be thinking about its role:
- A tariff shock is a negative growth shock, but also increases inflation. It is, effectively, a “stagflationary” shock. The BoC noted it is “equally concerned about inflation rising above the 2% target or falling below it,” and there is both upside and downside risks surrounding the outlook. Our take is the BoC should focus on the downside risks around growth versus a supply-driven inflation shock (e.g. if the unemployment rate is rising, then even an inflation-targeting central bank would have to concede that rate hikes would do little to solve for inflation driven by tariffs except to create deflation in other areas of the economy). But, the BoC doesn’t appear to be determined on where it would land. That’s likely why it removed more explicit forward guidance from its statement (even as a dovish bias is clearly still in play).
- And yet, Governor Macklem emphasized that solving the damage to Canada’s economy couldn’t just be the bank’s job.
“Monetary policy cannot offset the economic consequences of a protracted trade conflict. The reality is the economy is going to work less efficiently, Canada’s going to produce less and going to earn less. Monetary policy cannot change that, it cannot offset it. It can help the economy adjust to that, a source of stability through that adjustment so that the adjustment is less unpleasant.”
(That reads like a call for fiscal policy to also help support the shock, though, of course, the BoC cannot opine directly on this topic). It also is another nod to the challenges of a stagflationary shock for a central bank, where the best course of action will remain murky even as details of a trade conflict materialize.
USDCAD: BoC Rate Cut and US Tariff Threats Weaken Loonie
Fundamental Analysis:
On January 29, 2025, the Bank of Canada (BoC) cut its interest rate by 25 basis points, bringing it to 3%. This decision, the sixth consecutive reduction, stems from a weak economy and persistently low inflation. Additionally, the BoC warned that the 25% tariffs the United States plans to impose on Canadian imports could cause significant economic harm. In response, the Canadian dollar weakened against the U.S. dollar, with the USD/CAD pair reaching levels near 1.4400.
Conversely, the U.S. Federal Reserve is expected to keep its interest rate unchanged in the 4.25%-4.50% range. Attention is focused on statements from Fed Chair Jerome Powell, especially regarding the impact of President Donald Trump's economic policies, such as the proposed tariffs, which could influence the future stance of monetary policy.
In summary, while the Bank of Canada continues with an expansionary monetary policy due to internal economic concerns and external threats like U.S. tariffs, the Federal Reserve maintains a more cautious stance, observing the development of trade policies and their impact on the economy. These divergences in monetary policies and trade tensions have contributed to the recent depreciation of the Canadian dollar against the U.S. dollar.
Technical Analysis
USDCAD, H2
Supply Zones (Sell): 1.45
Demand Zones (Buy): 1.4439, 1.4396, and 1.4330
The pair has been consolidating for just over a month after reaching March 2020 levels. However, it maintains a bullish bias, with the last validated intraday support at the 1.4369 level.
In this context, we observe a rebound in the initial sessions, breaking through supply zones at 1.4439 and 1.4465, confirming bullish dominance. Additionally, the rebound leaves a demand zone at the origin, very close to the daily opening around 1.4396, a zone that may be revisited in search of liquidity to continue purchases with targets in the average bullish range at 1.4484, 1.45, and 1.4516 in the short term.
However, a more aggressive decline below the demand zone around 1.4396 may signal bearish intent if it attempts to break the last validated intraday support at 1.4369.
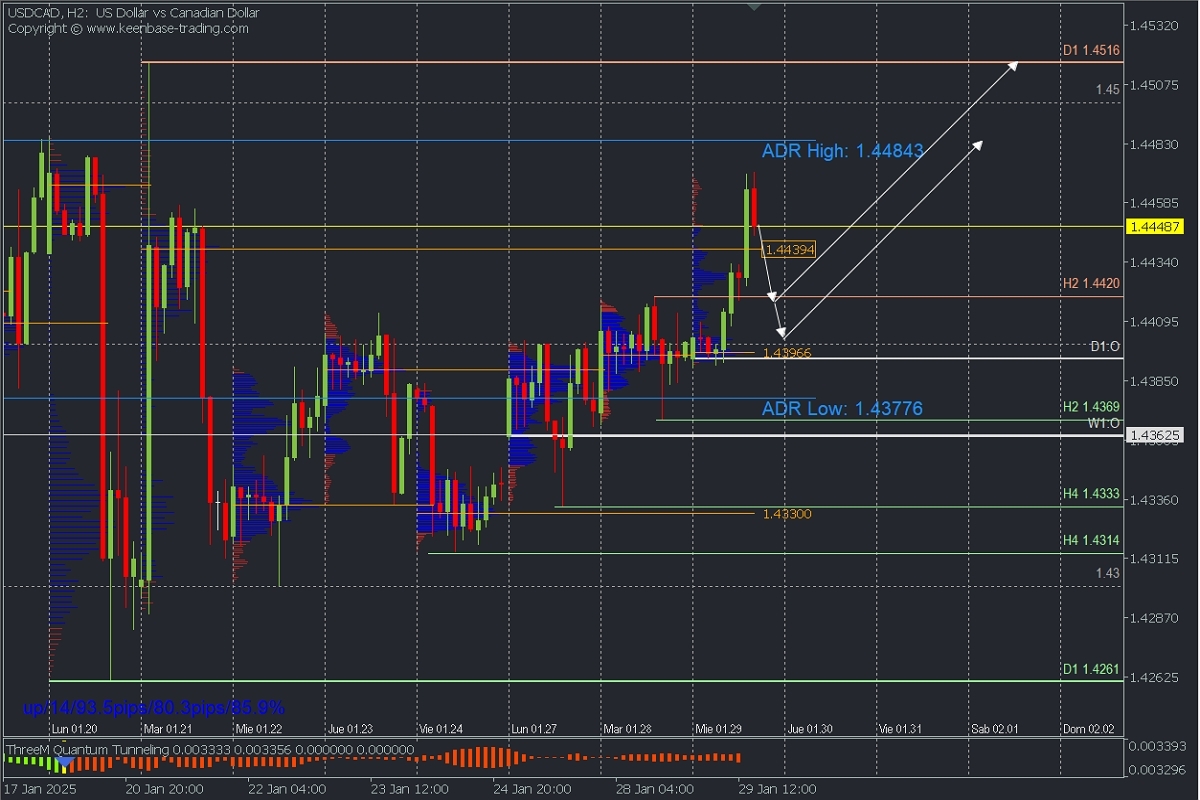
Technical Summary
- Bullish Continuation Scenario: Consider buying at a price above 1.4420 and 1.44, with targets at 1.4484, 1.45 and 1.4516 in extension.
- Bearish Corrective Scenario: Sell below 1.45, with targets at 1.4470 and 1.4450, from where purchases could be considered.
- Bearish Reversal Scenario: Activated after the support at 1.4369 is broken, with the target at the demand zone of 1.4330.
Always wait for the formation and confirmation of an Exhaustion/Reversal Pattern (ERP) on the M5 timeframe, as taught here: https://t.me/spanishfbs/2258, before entering any trade in the key zones indicated.
Uncovered POC: POC = Point of Control: It is the level or zone where the highest concentration of volume occurred. If previously, a downward movement originated from it, it is considered a sell zone and forms a resistance area. Conversely, if an upward impulse originated from it, it is considered a buy zone, usually located at lows, forming support areas.