
Sample Category Title
Oil Price Update – Brent Continues to Struggle as Technicals Offer Bulls Hope
- Oil prices are struggling due to uncertainty around tariffs and their impact on global demand.
- Libya supply fears were alleviated as exports returned to normal after discussions with protesters.
- US inventories rose, but total US oil demand also increased, offsetting downward pressure on oil prices.
- From a technical analysis standpoint, Brent has tapped into a key area of support and formed a double bottom pattern.
Oil prices continue to struggle to gain any sort of bullish traction as uncertainties around tariffs and the impact it will have on Global Demand continue to weigh on the minds of market participants. Meanwhile, comments earlier this week by US President Trump have put OPEC in a corner with the President saying he will speak to the group about lowering prices.
Libya Supply Fears Alleviated
Oil prices received a bit of a boost yesterday with news that protesters in Libya threatened to block Crude Oil exports via two terminals.
These fears were alleviated as the State Oil company reportedly talked to protesters and exports returned to normal.
The National Oil Corporation released a statement on Tuesday per Reuters, stating that operations are proceeding without interruption across all fields and ports, subsequent to discussions held with protesters who conducted a demonstration this morning at the ports of (Es Sider) and Ras Lanuf.
Tariff Threats Continue to Offer Support to Crude Oil Prices. A Double Edged Sword of Sorts?
Tariff threats continue to ramp up with markets expecting US President Donald Trump to slap a 25% tariff on all goods from Canada and Mexico.
The President has said this will come into effect on February 1st, with many market participants and analysts of the view that this will make Brent Crude more expensive.
For context, In 2023, Canada sent 3.9 million barrels of oil per day to the U.S., making up about half of all U.S. oil imports. Mexico supplied 733,000 barrels per day, according to the Energy Information Administration. Tariffs may also impact refined products such as gasoline, while an increase in transport costs may also factor in.
At the moment there does appear to be some back and forth between President Trump and Treasury Secretary Scott Bessent on the tariff issue. According to reports, Bessent would like to introduce tariffs gradually,starting at 5%. However, yesterday President Trump pushed back against this idea suggesting tariffs on individual products and items.
Such uncertainty will do little to ease the concerns of market participants who are already adopting a cautious approach as they weigh up the potential impact of tariffs. Much like with Gold, this is a double edged sword as market participants are concerned about the impact on global growth, while on the other hand we have the idea that tariffs will lead to an increase in Oil and refined products.
US Inventories on the Rise
Earlier we had data from the EIA regarding US crude inventories which rose by 3.5 million barrels to 415.1 million barrels in the week ended Jan. 24. This could have added further strain to Oil prices but the data also showed total U.S. oil demand rose last week.
This could have offset any downward pressure on Oil prices as demand continues to thrive.
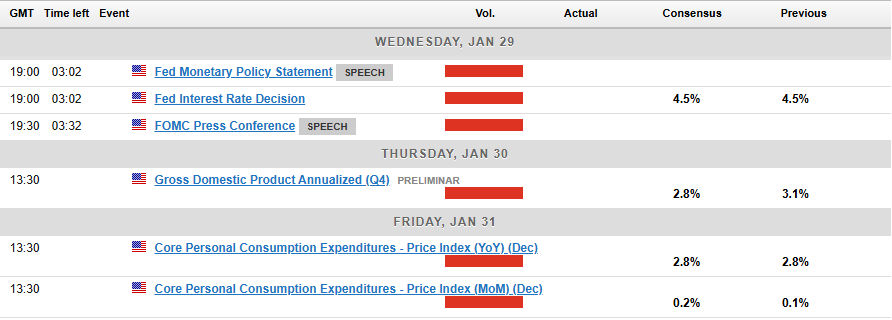
Looking ahead, we do have a significant amount of US Dollar news to end the week. However, I do not expect many surprises with the tariff picture and geopolitical risks remaining the biggest factors to pay attention to.
Technical Analysis – Brent Crude
This is a follow-up analysis of my prior report “Oil Prices Slide – Brent Crude Taps 200-day MA. Can it Snap 4-day Losing Streak?” published on 13 January 2025.
From a technical analysis standpoint, Brent has tapped into a key area of support where the previous impulsive move to the upside began following a period of consolidation.
The key level serving as support is 76.35 with crude oil hovering above for the past three days. A sign of bearish exhaustion?
Brent Crude Oil Daily Chart, January 29, 2025
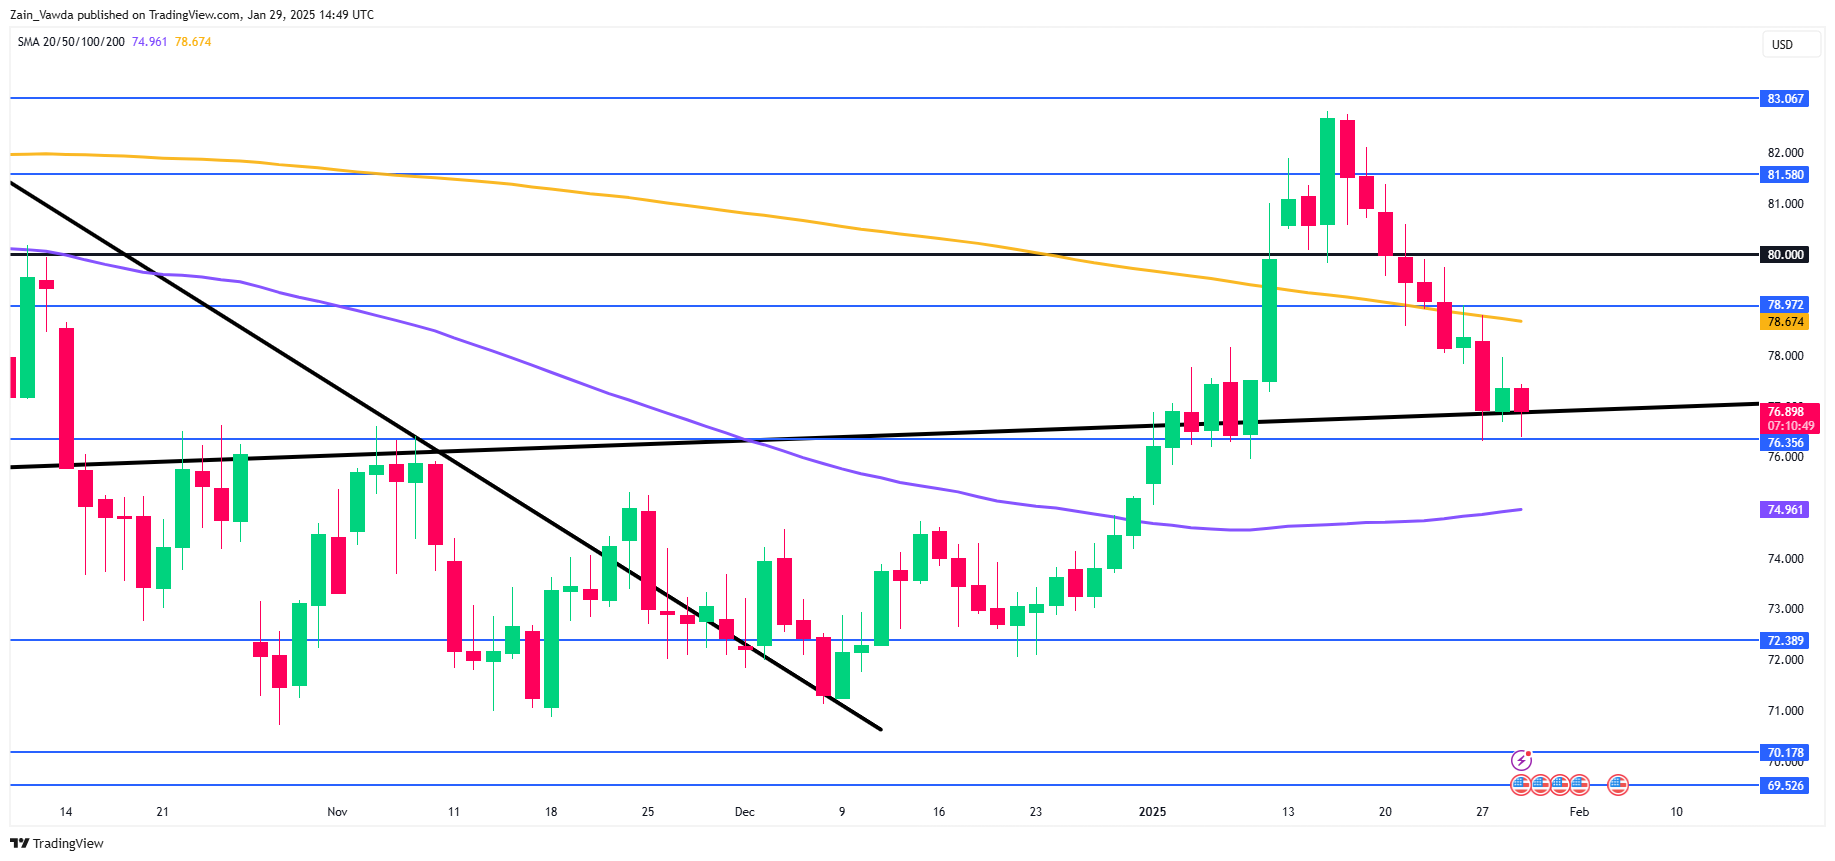
Source: TradingView (click to enlarge)
Dropping down to a four-hour chart and as you can see price has formed a double bottom pattern at the key support level of 76.35.
The 200-day MA adds another layer of support as it rests at 76.65 and currently supports prices.
In order for the double bottom pattern to play out, oil prices need to record a four-hour candle close above the previous swing high resting at 77.57 which could embolden bulls and see prices make a swift return toward the psychological 80.00 a barrel mark.
Oil is another prime example of the conundrum facing market participants at the moment where the fundamental and technical outlooks appear to be diverging. This makes it hard for market participants and may not get any easier until a clear path forward on tariffs is established.
Brent Crude Oil Four-Hour (H4) Chart, January 29, 2025
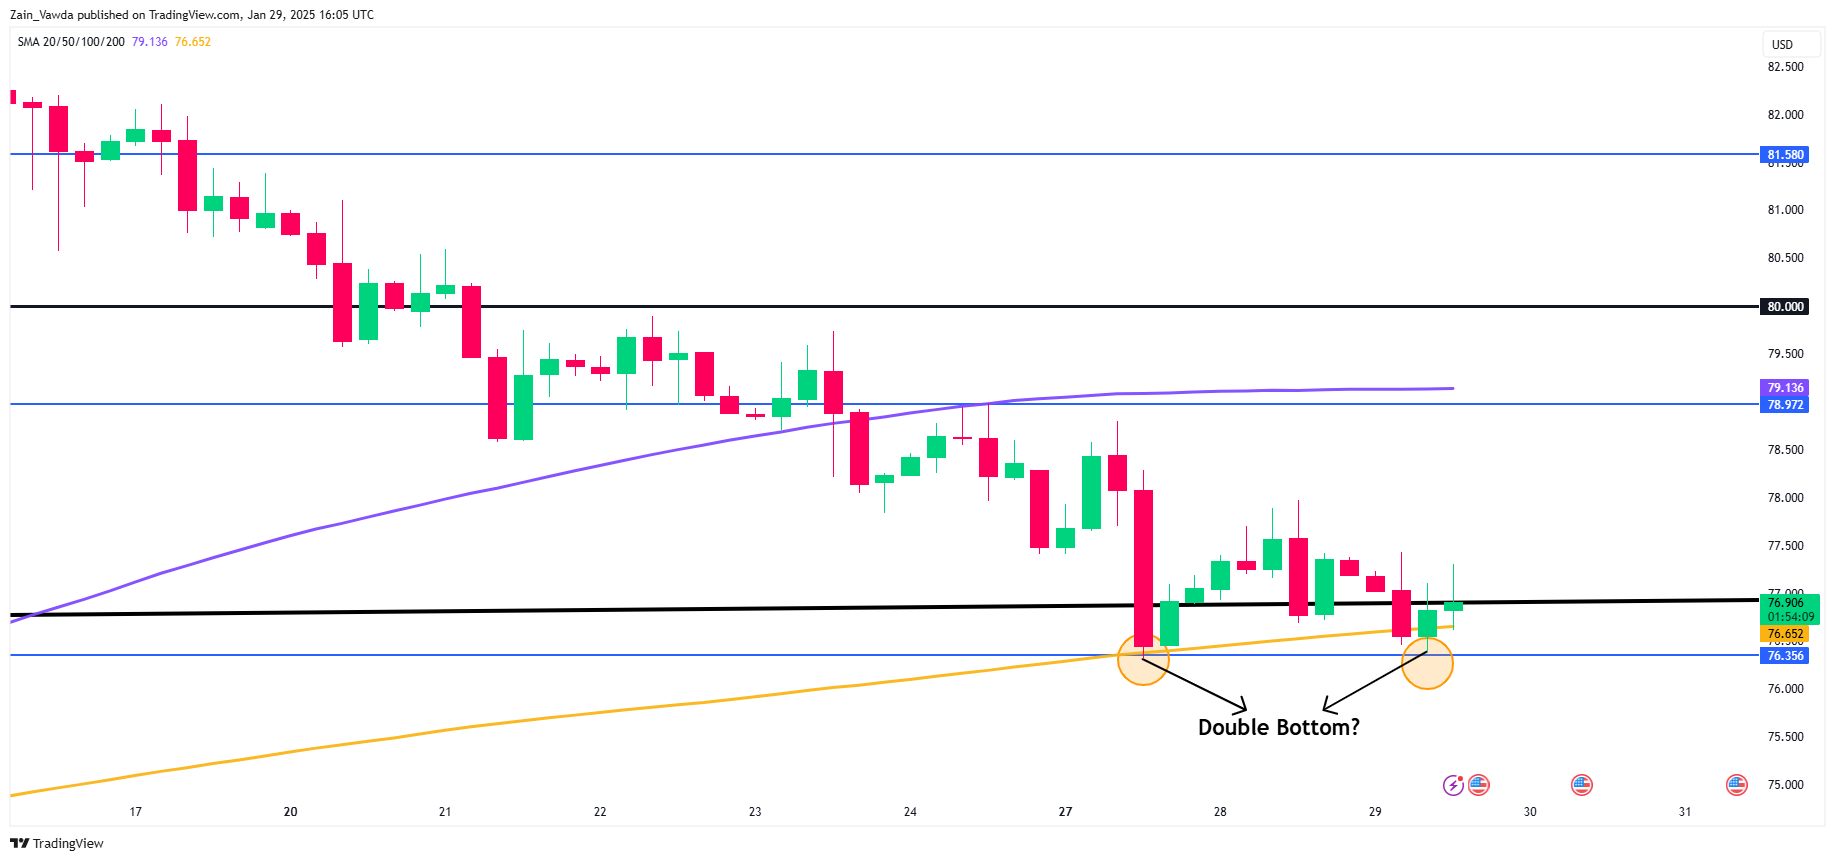
Source: TradingView (click to enlarge)
Support
- 76.35
- 75.00 (psychological level)
- 72.38
Resistance
- 78.97
- 80.00 (psychological level)
- 81.58
Australian Dollar Extends Losses on Soft Aussie CPI
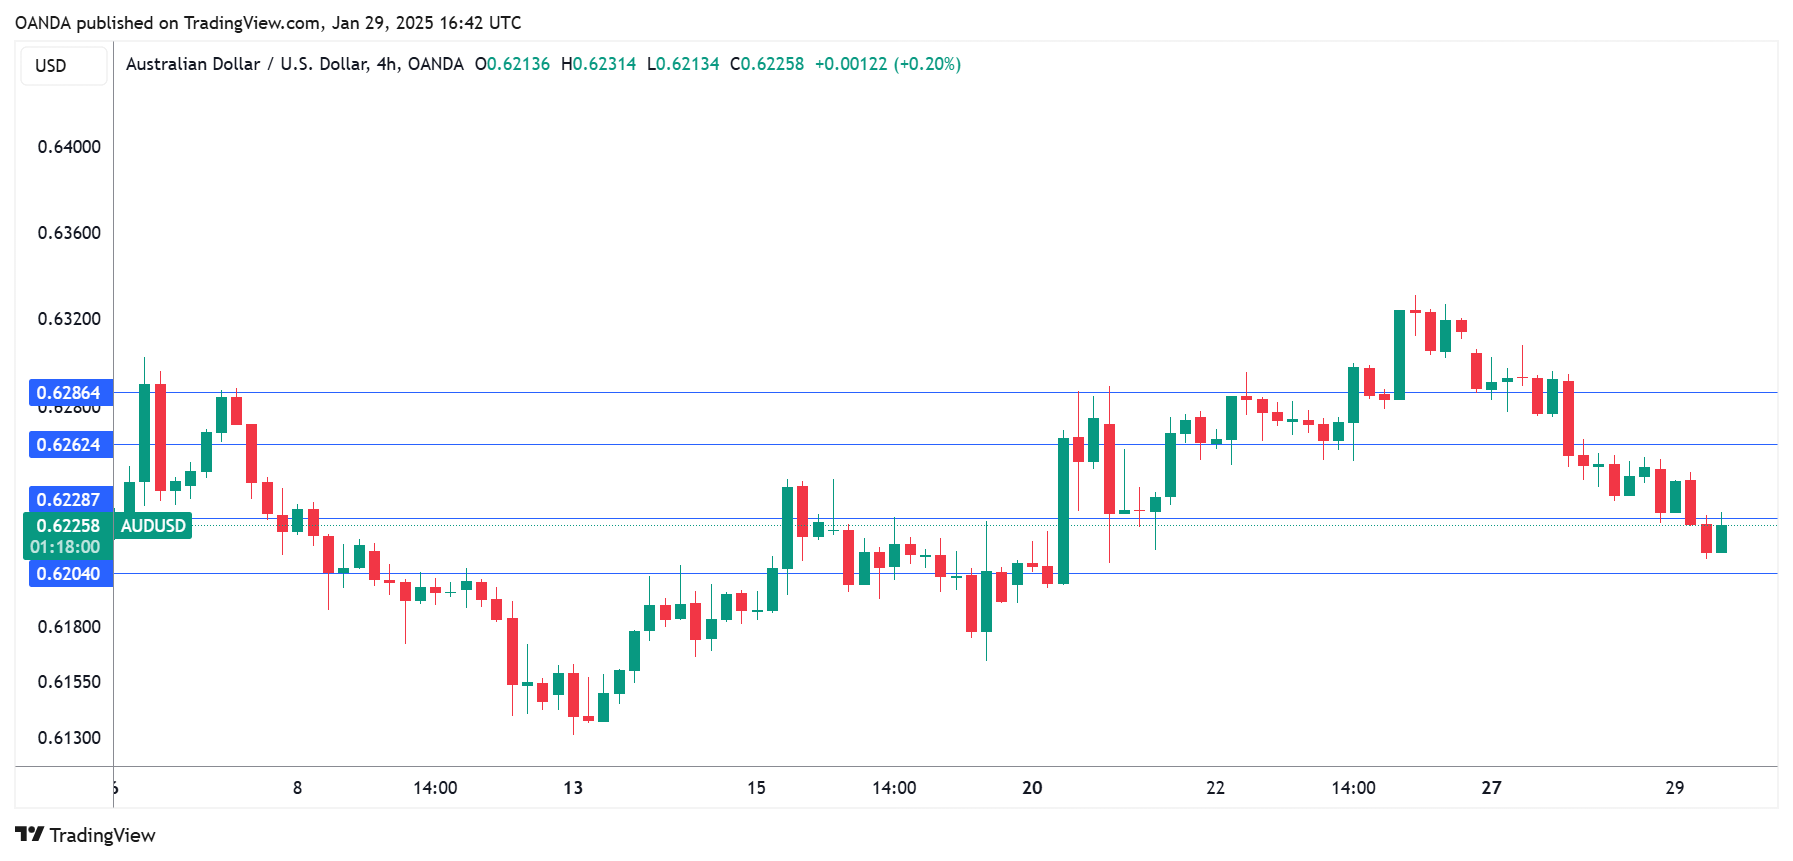
The Australian dollar is down for a third straight trading day and has declined 1.3% this week. In the North American session, AUD/USD is trading at 0.6228, down 0.37% on the day.
Australian CPI falls to 2.4%
Australia’s annual inflation rate dropped to 2.4% in the fourth quarter of 2024 from 2.8% in Q3. This was below the market estimate of 2.5% and was the lowest reading since Q1 2023. Electricity prices were sharply lower due to an energy bill rebate and services inflation dropped to 4.3% from 4.6%, its lowest level in three quarters. On a quarterly basis, CPI remained unchanged at 0.2% in Q4, below the market estimate of 0.3%.
The Reserved Bank of Australia’s trimmed mean CPI, a key indicator of underlying inflation, slowed to 0.5% q/q in Q4, lower than 0.8% in Q3 and below the market estimate of 0.6%. Annually, trimmed mean CPI fell to 3.2%, compared to a revised 3.6% in Q3 and below the market estimate of 3.3%.
The soft inflation report has raised expectations that the RBA will lower rates at the Feb. 18 meeting, with the market pricing in a quarter-point cut at 80%. That would bring the cash rate to 4.10%, its lowest since Oct. 2023. Today’s inflation report has added significance as it is the final tier-1 event prior to next month’s rate meeting.
Investors are awaiting the Federal Reserve’s rate announcement later today, although it would be a massive surprise if the Fed did not maintain the current benchmark interest rate of 4.25%-4.5%. The Fed has cut rate three consecutive times, including a jumb0 half-point chop in September 2024, but the resilient US economy has stalled plans to aggressively lower rates further and currently the Fed is projected to cut rates only once or twice in 2025.
AUD/USD Technical
- AUD/USD is testing support at 0.6228. Below, there is support at 0.6204
- 0.6262 and 0.6286 are the next resistance lines
Euro Pressured by German Pessimism
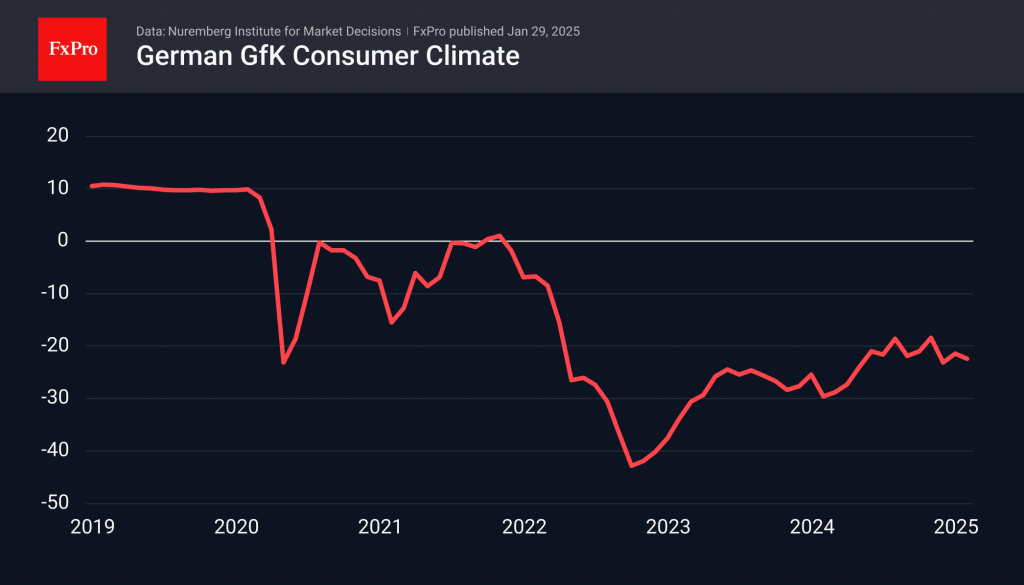
The German Consumer Climate Index declined in January, impacting the eurozone’s largest economy and applying pressure on the single currency. The index fell by 1 point to -22.4 by February, having remained deeply negative since late 2021 without showing an upward trend since mid-last year. The report highlights a decrease in income expectations and purchase intentions, potentially linked to an increase in inflation.
Furthermore, the German Ministry of Economic Affairs adjusted its GDP growth forecast for 2025 from 1.1% to 0.3%, following contractions of 0.3% and 0.2% in 2023 and 2024, respectively. This economic situation underscores the need for continued monetary policy easing by the ECB despite indications of rising inflation.
Market participants are anticipating further rate cuts from the ECB, with expectations of a quarter-point reduction this coming Thursday and additional cuts later this year. In contrast, about two cuts are expected from the Fed and the Bank of England, with the possibility of fewer reductions in the US.
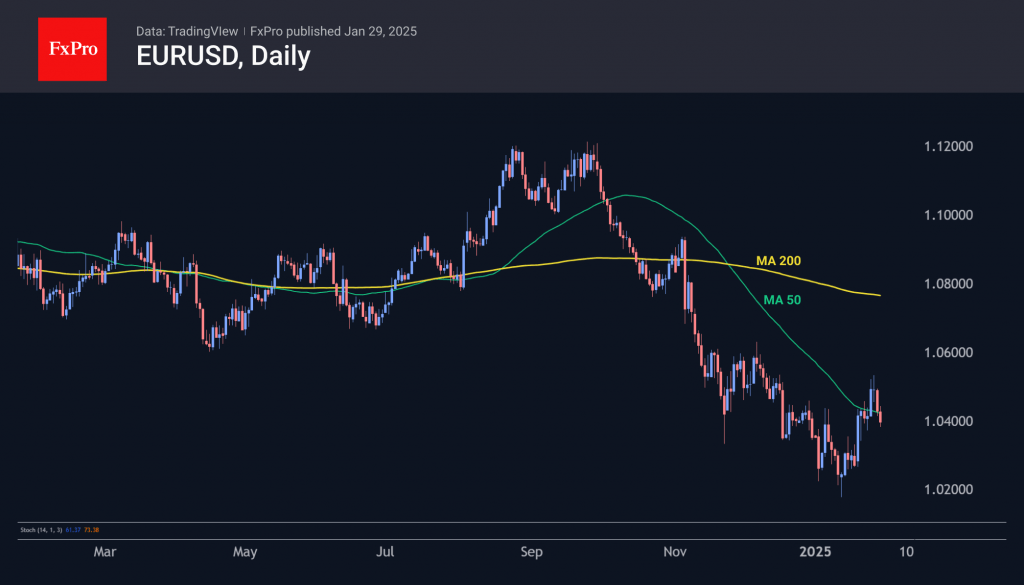
These market expectations suggest a potential decline in the euro against the dollar and pound, influenced by technical factors. The EURUSD rally from 13 to 27 January appears to be a technical rebound following the decline since October. The recovery lost momentum after surpassing the 50-day moving average and the 1.05 level. EURUSD is likely to consolidate below the 1.05 level, which could lead to declines below parity.
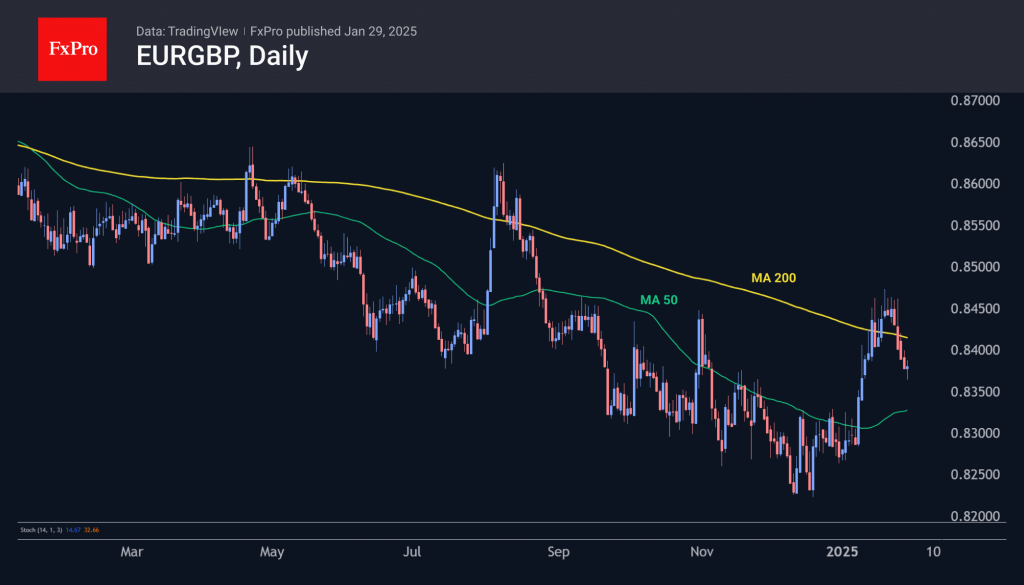
Regarding macroeconomic factors, especially consumer demand, the euro also seems weaker compared to the pound. The EURGBP pair declined for the fifth consecutive trading session, completing its technical rebound. Bearish sentiment resumed after reaching the 200-day moving average level. The euro has been depreciating against the pound since October 2023. The pair is approximately 1.75% above cyclical lows at 0.8250 but may retest these levels in the coming weeks. Consolidation below this mark could result in a fundamental reassessment of attitudes towards the euro, similar to the period in 2014-2015 when EURGBP fell below 0.7000.
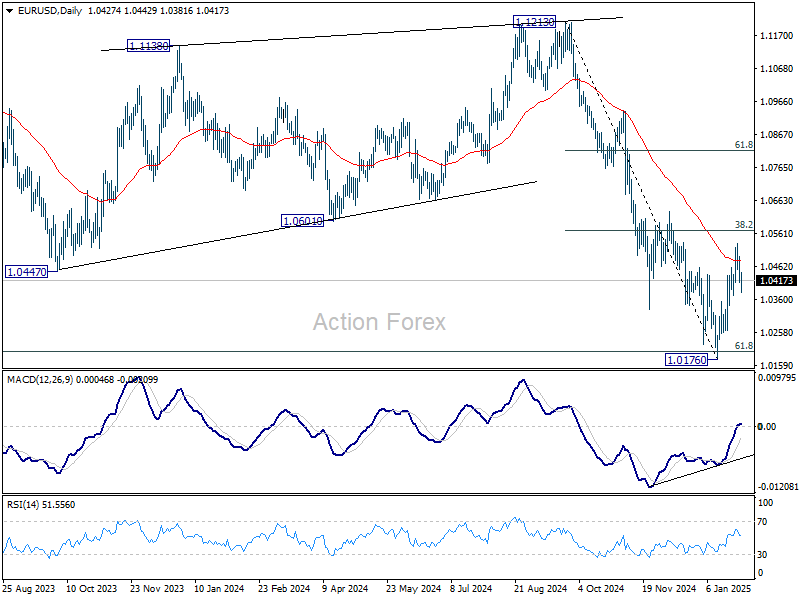
EUR/USD Mid-Day Outlook
Daily Pivots: (S1) 1.0398; (P) 1.0447; (R1) 1.0480; More...
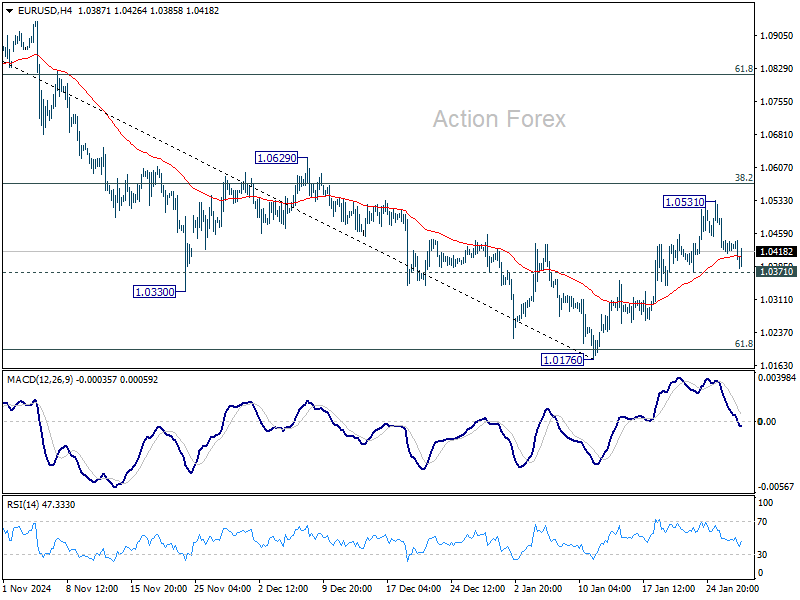
Outlook in EUR/USD is unchanged and intraday bias remains neutral. On the downside, break of 1.0371 support will indicate rejection by 38.2% retracement of 1.1213 to 1.0176 at 1.0572 and retain near term bearishness. Retest of 1.0176 low should be seen next. On the upside, though, decisive break of 1.0572 will raise the chance of bullish reversal, and target 61.8% retracement at 1.0817.
In the bigger picture, outlook is mixed as fall from 1.1274 (2023 high) could either be the second leg of the corrective pattern from 0.9534 (2022 low), or another down leg of the long term down trend. Strong support from 61.8 retracement of 0.9534 to 1.1274 at 1.0199 will favor the former case, and sustained break of 55 W EMA (now at 1.0722) will argue that the third leg might have started. However, sustained trading below 1.0199 will favor the latter case and bring retest of 0.9534 low.
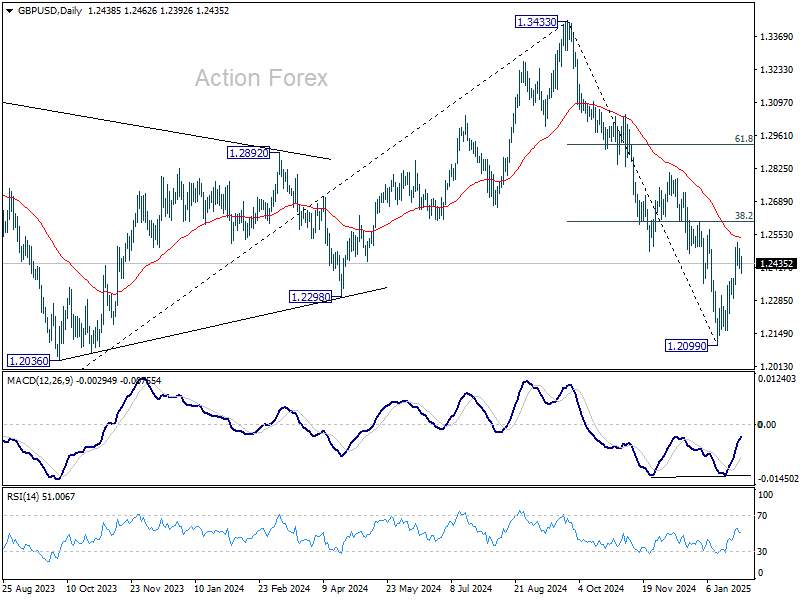
GBP/USD Mid-Day Outlook
Daily Pivots: (S1) 1.2404; (P) 1.2453; (R1) 1.2491; More...
Outlook in GBP/USD is unchanged and intraday bias stays neutral first. Rebound from 1.2099 is seen as a corrective move. While another rise cannot be ruled out, strong resistance could be seen 38.2% retracement of 1.3433 to 1.2099 at 1.2609 to limit upside. On the downside, below 1.2292 minor support will bring retest of 1.2099 low. However, sustained trading above 1.2609 will raise the chance of reversal and target 61.8% retracement at 1.2923.
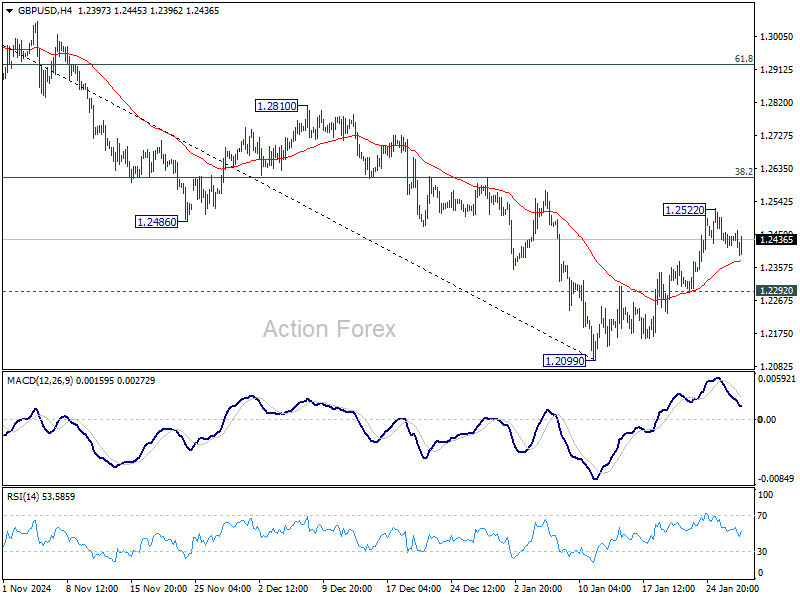
In the bigger picture, rise from 1.0351 (2022 low) should have already completed at 1.3433 (2024 high), and the trend has reversed. Further fall is now expected as long as 1.2810 resistance holds. Deeper decline should be seen to 61.8% retracement of 1.0351 to 1.3433 at 1.1528, even as a corrective move. However, firm break of 1.2810 will dampen this bearish view and bring retest of 1.3433 high instead.
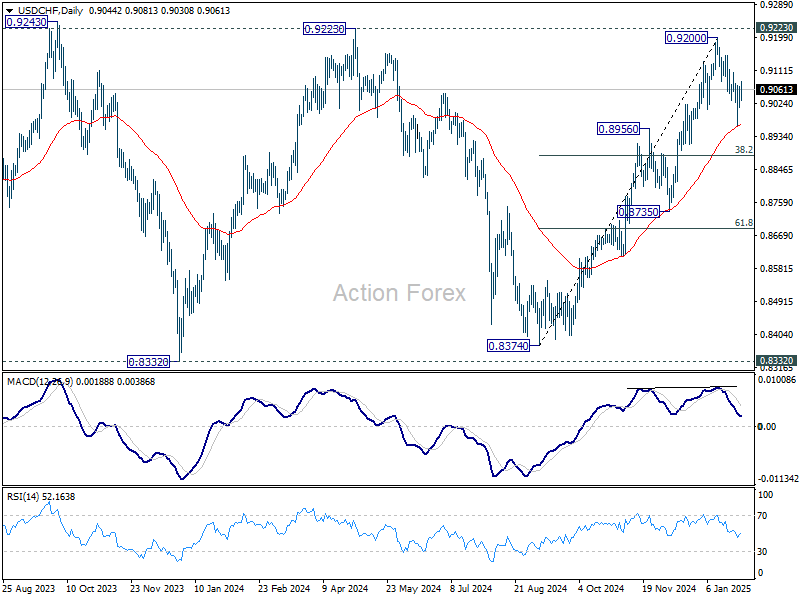
USD/CHF Mid-Day Outlook
Daily Pivots: (S1) 0.9012; (P) 0.9041; (R1) 0.9071; More…
Outlook in USD/CHF is unchanged and intraday bias remains neutral. Rise from 0.9374 remains intact so far with strong support seen from near term rising channel. On the upside, break of 0.9107 will target 0.9200 and 0.9223 key resistance. On the downside, however, break of 0.8964 will resume the fall from 0.9200 to 38.2% retracement of 0.8374 to 0.9200 at 0.8884 next.
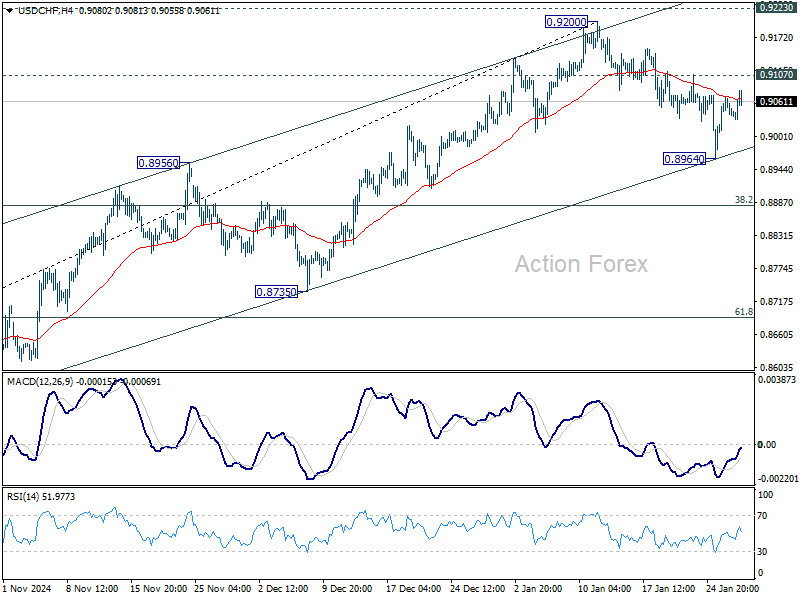
In the bigger picture, as long as 0.9223 resistance holds, price actions from 0.8332 (2023 low) are seen as a medium term corrective pattern. That is, long term down trend is in favor to resume through 0.8332 at a later stage. However, sustained break of 0.9223 will be an important sign of bullish trend reversal.
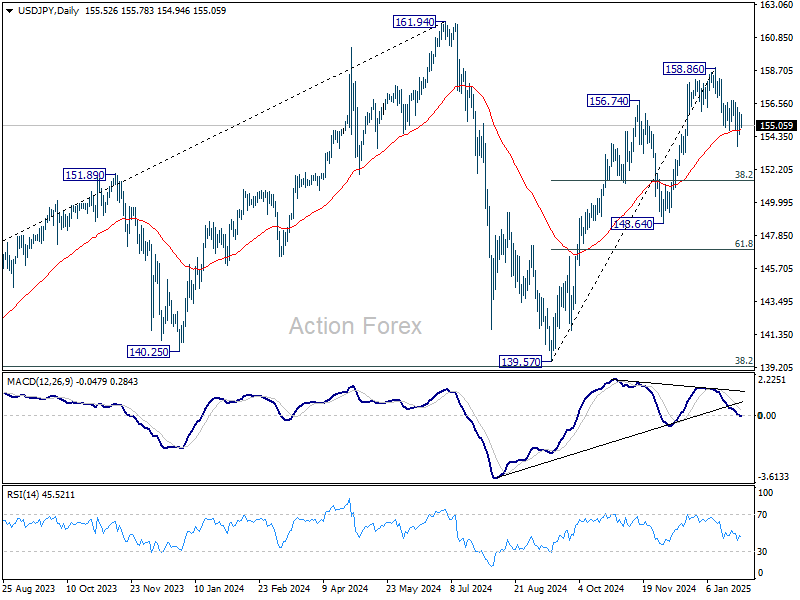
USD/JPY Mid-Day Outlook
Daily Pivots: (S1) 154.61; (P) 155.30; (R1) 156.21; More...
Outlook in USD/JPY remains unchanged and intraday bias stays neutral. On the upside, break of 156.74 resistance will indicate that fall from 158.86 has completed as a correction. Intraday bias will be back on the upside for 158.86 and above to resume the whole rally from 138.57. On the downside, below 153.70 will resume the fall from 158.86 to 38.2% retracement of 139.57 to 158.86 at 151.49.
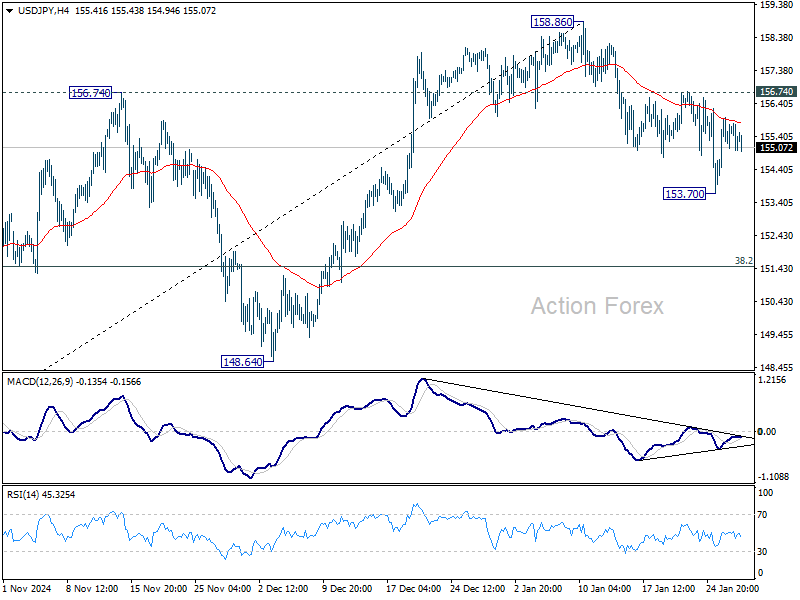
In the bigger picture, price actions from 161.94 are seen as a corrective pattern to rise from 102.58 (2021 low). The range of medium term consolidation should be set between 38.2% retracement of 102.58 to 161.94 at 139.26 and 161.94. Nevertheless, sustained break of 139.26 would open up deeper medium term decline to 61.8% retracement at 125.25.
Bank of Canada Slows Pace of Rate Cuts, Highlights Downside Risks from Trade Tariffs
The Bank of Canada (BoC) slowed down the pace of rate cuts, with a 25 basis point move today, bringing the policy rate to 3.0%. It also stated that it will end Quantitative Tightening (QT) and restart asset purchases in March - This isn't a stimulative policy but rather helps match liquidity with the size of the economy.
The bank noted "more-than-usual uncertainty" surrounding its outlook due to the threat of trade tariffs. Although no specific tariff assumption was included within their forecast, it does recognize the threat has an impact on financial markets and business decisions. The bank is forecasting solid economic growth, averaging 1.8% in 2025 and 2026, while core inflation is forecasted to reach 2.1% by end-2025.
In explaining why the BoC decided to slow the pace of cuts, it highlighted the cumulative reduction in the policy rate since June, which has boosted consumer spending and housing. This means the economy requires less monetary support from the central bank.
Key Implications
The slowdown in the pace of rate cuts was widely expected. This more conservative approach makes sense for an economy that churned out 91k jobs last month and is likely to see solid GDP growth for the fourth quarter of 2024 of around 2%. At the same time, inflation remains under control, allowing the BoC to focus on the state of the economy. This approach also mitigates the risk that the policy rate diverges too much from the Fed (which is clearly on hold). The loonie remains under pressure, but seems to have stabilized at around 69 U.S. cents.
The economic outlook has become highly uncertain with Donald Trump threatening to make an announcement on tariffs this Saturday. Canada exports $1.9 billion daily in goods and services south of the border. This sums to around 20% of Canada's economy, with nearly two million jobs dependent on U.S. trade. We are still hopeful that tariff threats are more of a negotiation tactic, meaning they would be temporary and carry less long term impacts. Yet, this is a tail risk that remains front and center in the mind of the BoC. Our baseline forecasts remains that the BoC will cut rates to 2.25% by year-end, but should 25% tariffs come into play for more than a few months, we'd expect the central bank to cut more aggressively in order to cushion the economy.
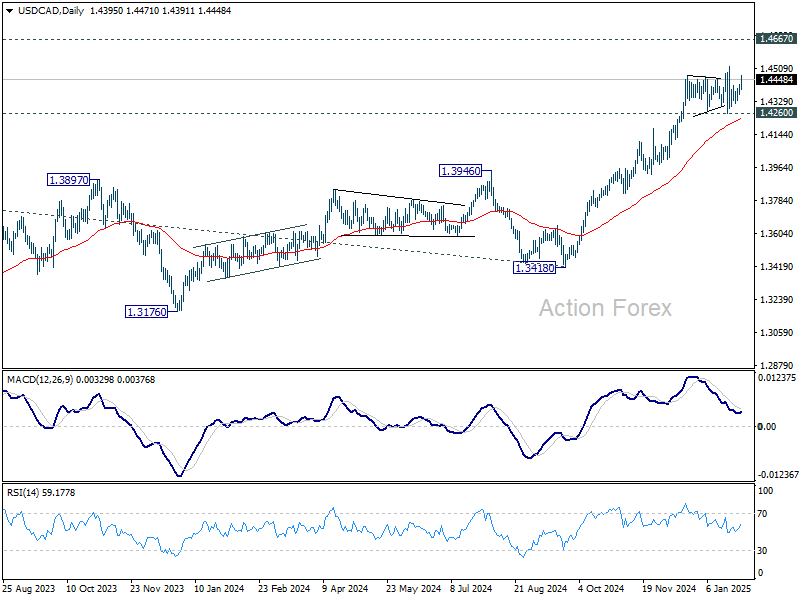
USD/CAD Mid-Day Outlook
Daily Pivots: (S1) 1.4367; (P) 1.4394; (R1) 1.4428; More...
USD/CAD rebounded notably today but stays in range below 1.4516 short term top. Intraday bias remains neutral and more consolidations could be seen. Further rally is expected as long as 1.4260 support holds. On the upside, firm break of 1.4516 will resume larger up trend to 1.4667/89 key resistance zone. Nevertheless, firm break of 1.4260 will turn bias to the downside for deeper pullback to 55 D EMA (now at 1.4235) and below.
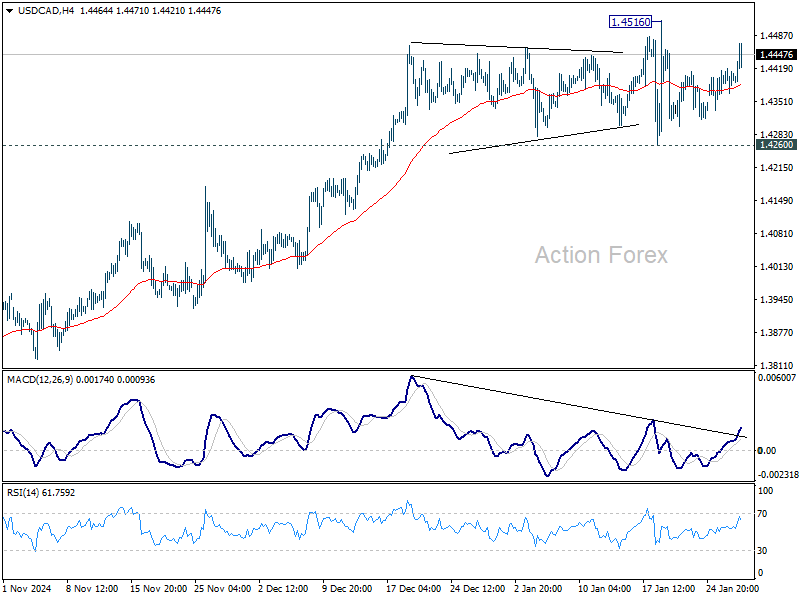
In the bigger picture, up trend from 1.2005 (2021) is in progress for retesting 1.4667/89 key resistance zone (2020/2015 highs). Decisive break there will confirm long term up trend resumption. Next target is 100% projection of 1.2401 to 1.3976 from 1.3418 at 1.4993. Medium term outlook will remain bullish as long as 1.3976 resistance turned holds (2022 high), even in case of deep pullback.
CAD Steady After BoC Cut, DOW Nears Record Ahead of FOMC Hold
Canadian Dollar is steady after BoC delivered its sixth consecutive rate cut, lowering its policy rate by 25bps to 3.00% as expected. The pace of easing has slowed from December’s 50bps reduction, reflecting a more measured approach as interest rate sits inside neutral zone. BoC explicitly warned of risks stemming from potential US tariffs, noting that a prolonged trade conflict could weigh on economic growth while simultaneously exerting upward pressure on inflation.
Governor Tiff Macklem reinforced this concern in his press conference, describing US trade policy as a "major source of uncertainty," with multiple possible outcomes. He also noted that tariffs reduce economic efficiency and cannot be offset by monetary policy alone, adding that with only one policy tool—the interest rate—the BoC cannot simultaneously combat "weaker output and higher inflation."
Attention now shifts to Fed, which is widely expected to hold its policy rate steady at 4.25–4.50% today. The key question is whether Fed will signal an extended pause in its rate-cutting cycle, either through its statement or Chair Jerome Powell’s press conference. Powell’s tone will be crucial in shaping market expectations—any indication of a prolonged pause could bolster the Dollar and weigh on risk assets, while a more dovish stance could encourage renewed risk-taking.
In equities, DOW’s response to FOMC decision will be closely watched. The index has remained resilient despite this week’s tech sector volatility and is now approaching the record high of 45073.63.
Decisive break above this level would confirm long-term uptrend resumption, and target 61.8% projection of 38499.27 to 45073.63 from 41844.89 at 45907.85. In this bullish scenario, risk-on sentiment could spread to other sectors and take S&P 500 and NASDAQ higher too.
However, break of 44026.27 support will delay the bullish case and bring another fall to extend the consolidation from 45073.63 instead.
Overall in the currency markets, Yen is trading as the strongest for the week so far, followed by Dollar and then Swiss Franc. Aussie is the worst, followed by Kiwi, and then Euro. Sterling and Loonie are positioning in the middle.
BoC cuts rates to 3.00%, flags trade risks and ends QT
BoC lowered its overnight rate target by 25bps to 3.00% as widely expected. In accompanying statement, the central bank warned that a prolonged trade conflict with the US could strain economic growth and drive inflation higher.
BoC noted that "if broad-based and significant tariffs were imposed, the resilience of Canada’s economy would be tested." Policymakers emphasized that they will closely monitor trade developments and assess their impact on economic activity, inflation, and future policy decisions.
The updated projections suggest a modest recovery in economic growth. Following an estimated 1.3% expansion in 2024, GDP is now expected to grow by 1.8% in both 2025 and 2026, slightly exceeding potential growth. Inflation is projected to remain near the 2% target over the next two years, reinforcing expectations that BoC will maintain a cautious approach to policy easing.
The central bank also announced plans to complete the normalization of its balance sheet by ending quantitative tightening. BoC will restart asset purchases in early March, adopting a gradual pace to ensure balance sheet stabilization while aligning with economic growth.
German Gfk consumer sentiment falls to -22.4, recovery hopes fade
Germany’s GfK Consumer Sentiment Index for February fell to -22.4, down from -21.4 and missing expectations of -20.5.
In January, economic expectations dropped by 1.9 points to -1.6, while income expectations declined by 2.5 points to -1.1. The most concerning development came from willingness to buy, which fell 3 points to -8.4, its lowest level since August 2024,.
Rolf Bürkl, consumer expert at NIM, noted that “the Consumer Climate has suffered another setback and starts gloomy into the new year.”
The moderate optimism seen in late 2024 has faded, with Bürkl adding that the trend since mid-2024 has been stagnation at best. A key concern is inflation, which has recently picked up again, limiting prospects for a meaningful rebound in consumer demand.
Australia's CPI slows to 2.4% in Q4, trimmed mean CPI down to 3.2%
Australia’s Q4 CPI rose just 0.2% qoq, same as the prior quarter, falling short of expectations of 0.4% yoy. Trimmed mean CPI also undershot forecasts, rising 0.5% qoq versus the expected 0.6% qoq.
On an annual basis, headline CPI slowed from 2.8% yoy to 2.4% yoy, slightly below 2.5% yoy consensus. Trimmed mean CPI fell from 3.6% yoy to 3.2% yoy, missing 3.3% yoy estimate.
These weaker inflation prints reinforce expectations that RBA may begin easing policy as early as its February 17-18 meeting.
The decline in annual inflation was largely driven by steep drops in electricity prices (-25.2%) and automotive fuel (-7.9%). Goods inflation slowed sharply to 0.8% yoy, down from 1.4% yoy in Q3. Meanwhile, services inflation remained elevated at 4.3% yoy, though slightly lower than the 4.6% yoy in the previous quarter.
In December, monthly CPI rebounded from 2.3% yoy to 2.5% yoy, matched expectations.
RBNZ's Conway sees cautious OCR path to neutral
RBNZ Chief Economist Paul Conway stated in a speech today that Official Cash Rate at 4.25% remains "north of neutral". The central bank estimates the neutral rate between 2.5% and 3.5%.
"Easing domestic pricing intentions and the recent drop in inflation expectations help open the way for some further easing," Conway added.
However, Conway emphasized a cautious approach, noting that policymakers will "feel our way" as rates approach neutral. RBNZ will continuously reassess its neutral rate estimate, adjusting based on economic conditions.
If neutral is underestimated, stronger-than-expected activity and inflation would signal a less restrictive policy than intended, prompting recalibration, he added.
The central bank expects potential output growth to range between 1.5% and 2% annually over the next three years, reflecting a lower economic "speed limit." This weaker outlook stems from sluggish productivity and reduced net immigration, limiting long-term economic capacity.
USD/CAD Mid-Day Outlook
Daily Pivots: (S1) 1.4367; (P) 1.4394; (R1) 1.4428; More...
USD/CAD rebounded notably today but stays in range below 1.4516 short term top. Intraday bias remains neutral and more consolidations could be seen. Further rally is expected as long as 1.4260 support holds. On the upside, firm break of 1.4516 will resume larger up trend to 1.4667/89 key resistance zone. Nevertheless, firm break of 1.4260 will turn bias to the downside for deeper pullback to 55 D EMA (now at 1.4235) and below.
In the bigger picture, up trend from 1.2005 (2021) is in progress for retesting 1.4667/89 key resistance zone (2020/2015 highs). Decisive break there will confirm long term up trend resumption. Next target is 100% projection of 1.2401 to 1.3976 from 1.3418 at 1.4993. Medium term outlook will remain bullish as long as 1.3976 resistance turned holds (2022 high), even in case of deep pullback.