Sample Category Title
EUR/USD Short-Term Bullish Pressures
EUR/USD is way into a bearish trend. Yet, short-term bullish momentum increases. Hourly resistance can be found at 1.1833 (29/09/2017 high). Strong support is given at a distance at 1.1662 (17/08/2017 low). Expected to show renewed bearish pressures if the pair remains below 1.1800.
In the longer term, the momentum is now turning largely positive. We favour a continued bullish bias. Key resistance is holding at 1.2252 (25/12/2014 high) while strong support lies at 1.0341 (03/01/2017 low).
Technical Outlook: USDJPY – Break Below Tenkan-Sen Is Bearish Signal For Test Of Key 200SMA Support
Near-term action is gaining further negative tone on fresh bearish acceleration on Tuesday. The pair broke below daily Tenkan-sen / 10SMA which now act as resistances and generated bearish signal.
Floor of near-term congestion at 112.32 is under increased pressure and sustained break here would generate new bearish signal for test of next pivots at 112.09 (20SMA) and 111.90 (200SMA). Close below here is needed to generate firmer reversal signal and open way for further retracement of 107.31/113.43 (08 Sep / 06 Oct rally).
Conversely, lift and close above Tenkan-sen (112.82) would sideline downside threats and shift focus higher for renewed attempts at 113.25/43 pivots).
Res: 112.65, 112.82, 113.25, 113.43
Sup: 112.32, 112.09, 111.90, 111.47
USD Bulls Sidelined, Silver Rally Continues
USD suffers hangover after holiday
After experiencing a solid recovery in the second half of September the US dollar reversed gains, partially at least, and started the week on the back foot. The dollar index traded as low as 93.43 before inching up to 93.54 in late Asian session. The dollar lost ground against most of its peers, falling the most against the AUD (-0.35%), the SEK (-0.32%) and EUR (-0.26%). EM currencies were also better bid as the risk sentiment improved. The South Africa rand, Mexican pesos and Turkish lira reversed losses and surged 0.55%, 0.30% and 0.45% respectively.
Investors are struggling to have a clear vision on the USD outlook as the final mix of political and monetary policies could have various effects. On the monetary policy side, Janet Yellen’s re-election is far from being a done deal, which has unleashed speculation about her potential successor, should she passes the cut. Donald Trump will give his final decision within the next couple of weeks. The range of candidates, in term of monetary policy stance, is quite wide with Kevin Warsh, Gary Cohn, Jerome Powell and Janet Yellen being in the President’s shortlist.
On the political side, following the important steps recently undertaken by the Congress toward advancing the tax reform, there is no real fresh news so far. Although there are some tensions within the Republican Party about the proposed tax cut, mostly between Trump and Corker, which could delay somewhat the implementation of the new tax plan.
All in all, uncertainties are mostly stemming from temporary factor. Therefore, we believe that this week dollar weakness will prove temporary as investors focus will see the glass half-full again.
Risk not out of Catalonia
We suspect the markets is underestimating the risk involved with the Catalonia independence movements. EURUSD 1 month implied volatility continue to decline despite potential event risk. Markets generally price the most obviously path of events. Hence why markets always get caught flat-footed by extreme events. Depending on what media you chose to watch will significantly influence your view of the situation. Over the weekend, demonstrations in Barcelona against independence helped lessen uncertainty. While threats of migration of large corporations out of Barcelona convince capitalist thinkers that logic and 'common' sense would find a markets friendly resolution.
Pundits suggested momentum had sifted to moderate independent groups. However, we should use Noble prizewinner Richard Thaler’s work in behavioral economies dealing with 'irrationally' to guide us. Or we can just remember how a similar corporate-line mislead most investors on Brexit. No, after Spain and Europe recent actions we suspect that Catalonia’s have harden their resolve for independence. The separates have been extremely quick since Monday that would hint as to coming strategy. Yet Madrid raise the stakes as Spain’s Deputy Prime Minister, Soraya Saenz de Santamaria, announced in a press release that the Spanish government s would trigger article 155 if Puigdemont declares independence. A move widely expect but one drew a clear line in the sand. Pushed in a corner, in our view the separatist only next move will be the declarations of independence most likely today. Madrid would trigger Art 155 of the constitution which dissolved key Catalonia powers and allow the central government to take control. The article has never been activated and guide lines are gray.
Yet the move will be seen as a clear escalation. What come next in our view is extremely unclear. Yet we are not ready to concede an orderly solution that requires constitutional changes and reliance of ratification by two-thirds of the Spanish parliament. The act of declaring independence would indicated that the movement no longer considers Spain legitimate and unlikely to continue through traditional constitutional process. In the near term we remain short EUR and see current EURUSD rally to 1.1780 as an opportunity to reload short position.
Silver: Institutional investors are bullish
Silver has strongly bounced back since the start of October and is back above 17$. The precious metal has been very volatile lately.
The price of precious metals such as Gold and Silver have been weighed down by the number of 'paper' contracts banks have used and abused over the last decade. According to the most recent 13F filling from the SEC (Securities & Exchange Commission), JPMorgan, Commerzbank or the Swiss National bank have increased their stake in Silver Wheaton.
We believe that this reveals the changing underlying fundamentals, in particular the fact that this may look like a reflation trade that would drive precious metals price higher. On top of that the strong exposure of financial institutions to Silver paper contract makes the increasing stake in Silver Wheaton very logic. It hedges big institutions exposure to Silver.
On a pure technical standpoint the precious metal is trading above its 100-Day moving average and we believe there are definitely more upside potential for the commodity.
GBP/USD Elliott Wave Analysis
GBP/USD – 1.3183
Sterling’s much stronger-than-expected retreat signals a temporary top has been formed at 1.3658 last month, and although current recovery from 1.3027 may bring further gain to 1.3240-50, reckon upside would be limited to 1.3295-00 and bring another decline later. Below 1.3027 would extend the fall from 1.3658 top to 1.3000, then towards 1.2950 but support at 1.2909 should limit downside and another previous support at 1.2852 would remain intact.
Our preferred count on the daily chart is that cable's rebound from 1.3500 (wave (A) trough) is unfolding as a wave (B) with A ended at 1.7043, followed by triangle wave B and wave C as well as wave (B) has possibly ended at 1.7192, below support at 1.4232 would add credence to this count, then further fall to 1.4000 level would follow but reckon downside would be limited to 1.3655 support and price should stay above previous support at 1.3500.
On the upside, although sterling has recovered from 1.3027 and initial bounce to 1.3240-50 cannot be ruled out, reckon upside would be limited to 1.3295-00 and bring another decline later. Above previous support at 1.3343 would defer and risk a stronger rebound to 1.3400 and possibly towards resistance at 1.3455, however, if our view that top has been formed at 1.3658 is correct, upside would be limited and bring another decline later.
Recommendation: Sell at 1.3300 for 1.3050 with stop above 1.3400.
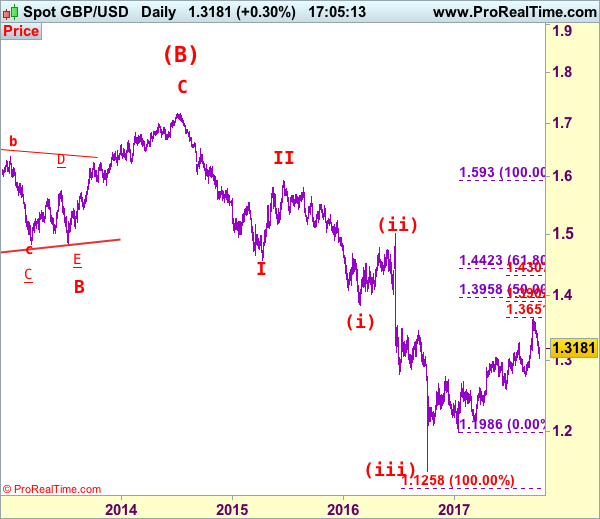
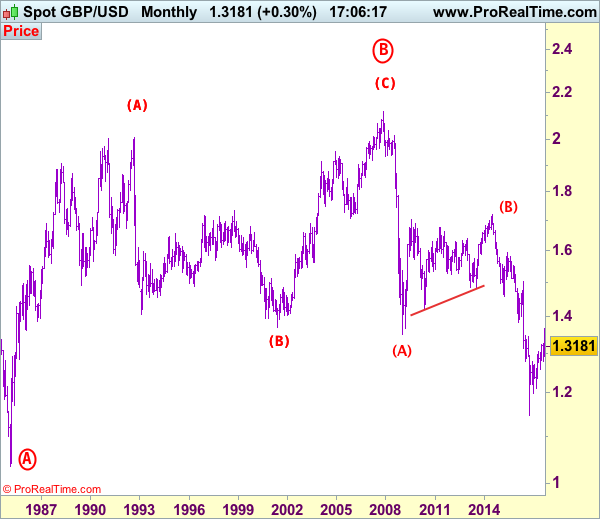
Longer term - Cable's rise from 1.0520 (Feb 1985) to 2.0100 (September 1992) is seen as [A], the decline to 1.3682 is labeled as (B) and (C) wave rally has ended at 2.1162 (9 Nov, 2007) which is also the top of larger degree wave B with circle. The selloff from there is a 5-waver with wave (A) ended at 1.3500 (23 Jan 2009), wave (B) itself is labeled as A: 1.6733, triangle wave B: 1.4813 and wave C as well as top of wave (B) ended at 1.7192 (2014), hence the selloff from there is an impulsive wave (C) with wave I : 1.4566, wave II 1.5930, an extended wave III is unfolding and already exceeded our downside target at 1.3500 and 1.3000, hence weakness to 1.2500 and possibly 1.2000 cannot be ruled out, however, price should stay well above psychological level at 1.0000.
WTI Oil Futures Hold Bearish Short-Term Bias Below 50 Key Level
WTI oil futures shifted to a more bearish bias after breaking below the psychological level at 50. The short-term outlook points to further weakness in the market since technical signals are bearish.
On the 4-hour chart, both MACD and RSI are in bearish territory. The 20 and 50-period moving averages are negatively aligned and sloping down, while prices are trading below them.
The market paused its decline at a key area, just above the 50% Fibonacci retracement level of the upleg from 45.56 to 52.83. This level at 49.17 is expected to act as support.
To the upside, the 20-period MA will likely provide resistance around 49.83. Should prices rise above this level, more resistance is expected at the key 50 level, as it is both a psychological level as well as the 38.2% Fibonacci retracement level. The October 5 high at 51.20 will be an important target since it acted as both support and resistance in the past and is also the 23.6% Fibonacci. Above this, prices would test the 52.83 peak.
Falling below the 50% Fibonacci would put WTI oil futures under more pressure and see the market starting to reverse the August to September uptrend to target the next major low at 46.95 and then 45.56.
The short-term analysis on the 4-hour chart showed the market is at a pivotal point now and is expected to consolidate just above the 50% Fibonacci. The short-term bearish outlook is still in play and the decline from 52.83 is expected to continue as long as prices are capped by the 20-period MA.
EURUSD Analysis: Returns To 1.1780
Although many technical indicators pointed out on recovery of the Dollar, the pair made a breakthrough in the opposite direction. The surge was mainly based on better than expected German Industrial Production data and hawkish comments from the ECB official. As a result, the pair returned to the 1.1780 level, from which it started to rapidly fall last Thursday. From technical perspective, now the rate is located above both moving averages and retracement level, which means that the surge could continue towards the weekly R1 at 1.1810. On the other hand, there is couple of fundamental factors that should be beard in mind, as they might notable affect valuation of the Euro. This list includes not only the EU Finance Ministers meeting in Brussels but also possible Catalonia’s declaration of independence.
GBP/CHF Elliott Wave Analysis
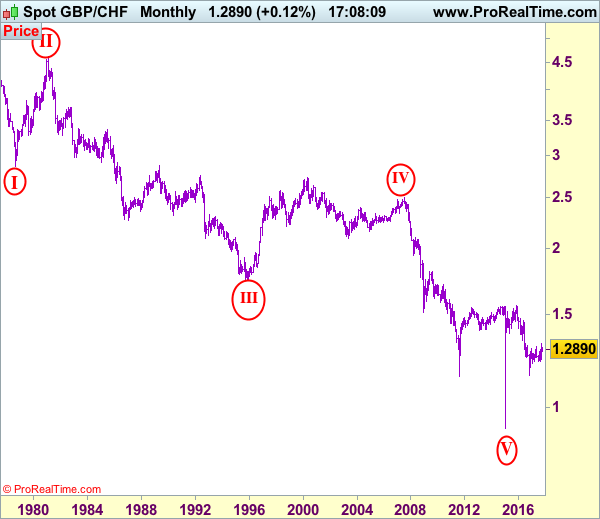
GBP/CHF – 1.2885
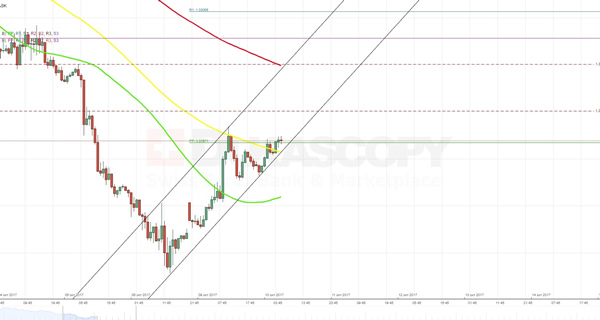
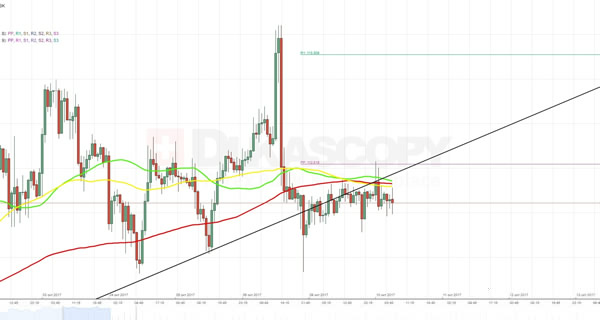
As sterling found support at 1.2746 and has rebounded, retaining our bullishness and as long as said support holds, mild upside bias remains for test of resistance at 1.2980-85, break there would suggest the retreat from 1.3195 (last month’s high) has ended, bring further gain to 1.3050-60 but reckon upside would be limited to 1.3105-10 and price should falter well below said resistance at 1.3197, bring retreat later. In the event sterling is able to penetrate said resistance at 1.3195, this would indicate early erratic rise from 1.1475 has resumed for further gain to 1.3250, then towards 1.3300-10 but overbought condition should prevent sharp move beyond 1.3400 and reckon 1.3526 (previous support) would remain intact.
To recap the larger degree count, the selloff from 2.4965 (July 2007) is the beginning of wave V with circle and is labeled as 1: 2.3760, 2: 2.4425, wave 3 extension ended at 1.1470, followed by wave 4 at 1.5547, the quick rebound from 0.9106 suggests wave 5 as well as entire circle wave V could have ended there, hence consolidation with mild upside bias is seen for major correction to take place, bring initial test of 1.5547 (previous 4th of a lesser degree).
On the downside, expect pullback to be limited to 1.2800-10 and as long as said support at 1.2746 holds, prospect of another rebound remains. Below 1.2746 would signal the fall from 1.3197 top is still in progress for retracement of recent rise to support at 1.2716, a daily close below this level would suggest a temporary top has been formed, bring correction to 1.2650-60 and later towards 1.2600.
Recommendation: Hold long entered at 1.2800 for 1.3050 with stop below 1.2745.
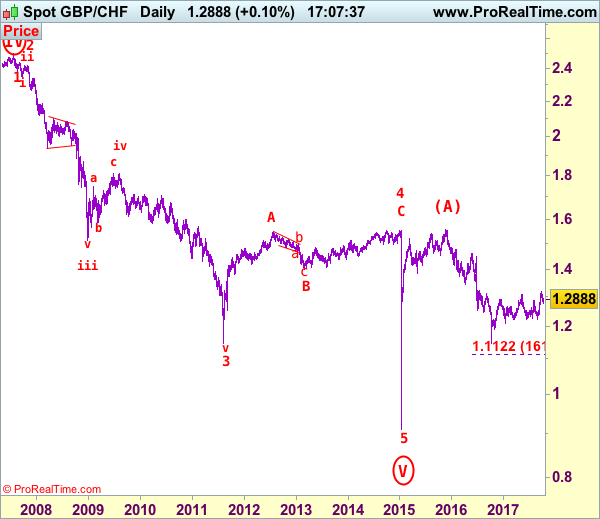
On the Monthly chart, the longer-term count is that major downtrend is under way with circle wave I at 2.8645 (Sep 1.978), then wave II with circle at 4.6175 (Feb 1981), the wave III with circle ended at 1.7425 (Nov 1995) and followed by wave IV with circle at 2.4965 (July 2007 with a short wave C) and wave V with circle has possibly ended at 0.9106. A monthly close above 1.5547 would add credence to this view, bring major correction to 1.7000, then towards psychological level at 2.0000.
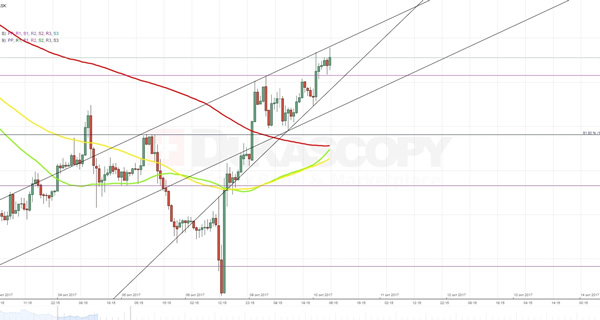
GBPUSD Analysis: Tries To Get Back To 1.32
In result of the previous trading session, the Pound managed to break through a combined resistance level formed by the 55-hour SMA and the upper edge of a descending channel that was additionally backed up by the 38.2% Fibonacci retracement level. During the surge, the pair has formed a junior ascending channel that together with the bullish market sentiment is likely to elevate the pair to the 1.3200 or even 1.3250 levels. However, in order to reach these targets the Pound needs a release of better than expected data about the UK manufacturing activity. In larger perspective, there is a need to take into account that the pair is moving in a general downtrend that is continuously fuelled by ineffectual Brexit talks.
USDJPY Analysis: Fails To Soar To 112.80
An assumption about further movement of the pair was partially confirmed yesterday. On the one hand, bulls made not less than five attempts to break to the top and restore lost positions. On the other hand, a combination of the 55-, 100- and 200-hour SMAs as well as the weekly PP at 112.81 blocked each one of them. As long as investors continue to fear further escalation of the North Korean crisis, the Yen is likely to continue to gain value against the Dollar. In support of this assumption, the average market sentiment continues to be 61% bearish. From technical perspective, there is a need to take into account that while the northern side is full of many technical indicators, the southern side contains only the weekly S1 that is located at the 112.19 level.
XAUUSD Analysis: Soars Towards 1,290.00
Because of the robust demand on gold from two largest Asian countries as well as continuous fears related to the North Korean crisis, the exchange rate continued to head to the top towards the 1,290.00 target. During the surge, the pair has even formed a minor rising wedge pattern whose breaking point is located exactly near the above mark. In addition to that, there is a need to take into account that an area near the 1,294.00 level represents a location of the 55-day SMA. Hence, one of those technical barriers is likely to turnaround the pair and gives it an impulse to continue to plunge towards the bottom edge of a senior ascending channel. However, if geopolitical situation continued to be as intense as it is now, investors will continue to seek safe heavens, such as gold.