Sample Category Title
Economic Data Back In Focus Tuesday
After a quiet start to the week, the economic newswire is back in focus for Tuesday. In particular, investors will be eyeing key reports from the Eurozone and the United Kingdom, as well as a policy speech from a top US Federal Reserve policymaker.
Action begins at 05:45 GMT with a report on Swiss unemployment. The national unemployment rate is forecast to hold steady at 3.2%.
Shortly after the Swiss report, Germany will report on international trade for the month of August. The Federal Statistics Office is expected to show an August trade surplus of €20.3 billion, up from €19.5 billion the month before. Exports are projected to rise 1% on month, higher than the expected rise in imports.
Reports on industrial production from France and Italy will also make headlines over the next two hours.
Attention shifts to the United Kingdom at 08:30 GMT with reports on manufacturing production and industrial production scheduled for release. Manufacturing output is forecast to rise 1.9% in the 12 months through August following an identical increase the month before. Industrial production, which is a broader measure of factory output, is expected to gain 2.6% year-over-year.
The Office for National Statistics will also report on the goods trade balance. Britain’s trade deficit for August is expected to narrow slightly to £2.8 billion from £2.87 billion.
Reports on Greek industrial production and consumer inflation will round out the European release schedule.
In North America, the Canadian government will report on housing starts and building permits at 12:15 GMT and 12:30 GMT, respectively. The reports will be used to gauge the health of the Canadian housing market.
In the United States, Federal Open Market Committee (FOMC) member Neel Kashkari will deliver a speech at 14:00 GMT.
USD/CAD
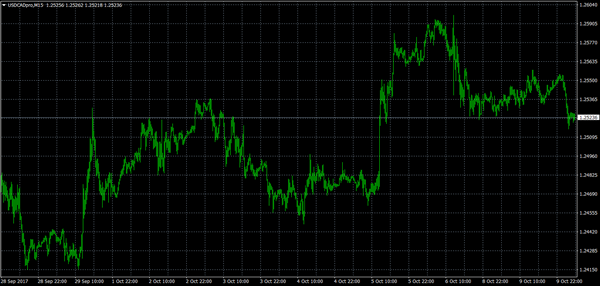
The Canadian dollar strengthened against its US counterpart on Monday, a trend that continued well into Tuesday’s session. The USD/CAD was last down 0.2% at 1.2523. The pair continues to trade above a key technical support, but is locked in a relatively neutral range. A recovery attempt north of 1.2770 is needed to ensure further bullish momentum for the pair in the weeks ahead.
EUR/USD
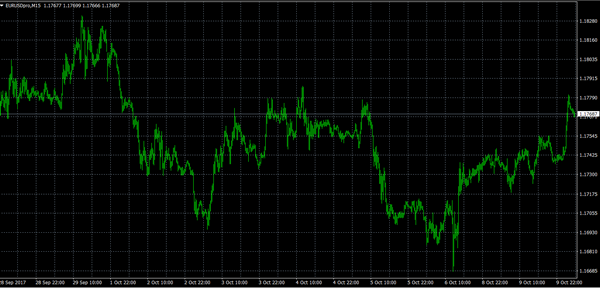
The euro also capitalized on broad dollar weakness at the start of the week. The EUR/USD was up another 0.2% at 1.1768 through Tuesday’s Asian session. Despite the pair’s recent struggles, the outlook remains generally favourable so long as prices hold above 1.1716. Those levels appear to be secured at the time of writing.
GBP/USD
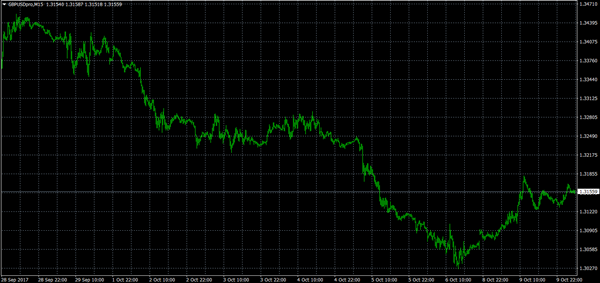
The British pound maintained its rangebound state against the dollar on Tuesday, with prices edging up slightly toward the 1.3160 range. The bulls are targeting the 1.32 level, although worries over Brexit could dampen cable’s near-term outlook.
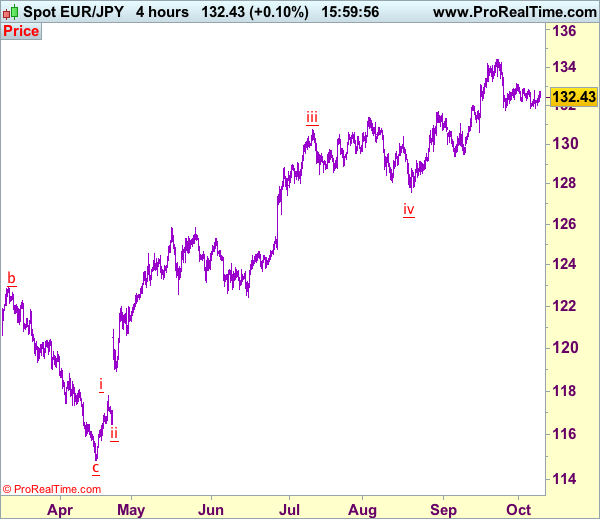
Trade Idea: EUR/JPY – Hold short entered at 132.40
EUR/JPY - 132.40
Original strategy:
Sold at 132.40, Target: 130.70, Stop: 133.00
Position: - Short at 132.40
Target: - 130.70
Stop: - 133.00
New strategy :
Hold short entered at 132.40, Target: 130.70, Stop: 133.00
Position: - Short at 132.40
Target: - 130.70
Stop:- 133.00
Euro’s recovery after holding above support at 131.84 has retained our view that further consolidation would take place, however, still reckon resistance at 132.77 would limit upside and bring another decline later, below indicated support at 131.75 would add credence to our view that top has been formed at 134.41, bring retracement of recent rise to 131.00-05, break there would extend decline from 134.41 towards support at 130.62 which is likely to hold on first testing.
In view of this, we are holding on to our short position entered at 132.40. Above said resistance at 132.77 would risk test of indicated resistance at 133.12 but break there is needed to retain near term bullishness and extend the rebound from 131.75 to previous support at 133.43, however, upside should be limited to 134.00 and price should falter well below said resistance at 134.41, bring further consolidation.
Our latest preferred count is that wave (ii) is ABC-X-ABC which ended at 123.33 and wave (iii) is unfolding with wave iii ended at 100.77, followed by wave iv at 111.57 and wave v as well as the wave (iii) has ended at 97.04, followed by wave (iv) at 111.43 and wave (v) has ended at 94.12 which is also the end of the larger degree v, this also implied the major wave (C) has also ended there, hence major correction has commenced from there with (A) leg unfolding in its lower degree wave c which has possibly ended at 145.69. Under this count, A-B-C wave (B) has commenced with A leg ended at 136.23, wave B at 143.79 and wave C has possibly ended at 149.79.
Our larger degree count is that the decline from 139.26 is wave (C) and is sub-divided into a diagonal triangle i-ii-iii-iv-v with wave i - 105.44, wave ii- 123.33, wave iii - 97.03, wave iv - 111.43, followed by the final wave v as well as the end of wave (C) at 94.12, this also mark the bottom of larger degree wave B. Under this count, major rise in wave C has commenced as an impulsive wave with minor wave III ended at 145.69, wave V is still in progress for further gain to 150.00. Having said that, this so-called wave V could well be the first leg of larger degree 5-waver wave C and this wave C should bring at least a retest of wave A top at 169.97 (July 2008).
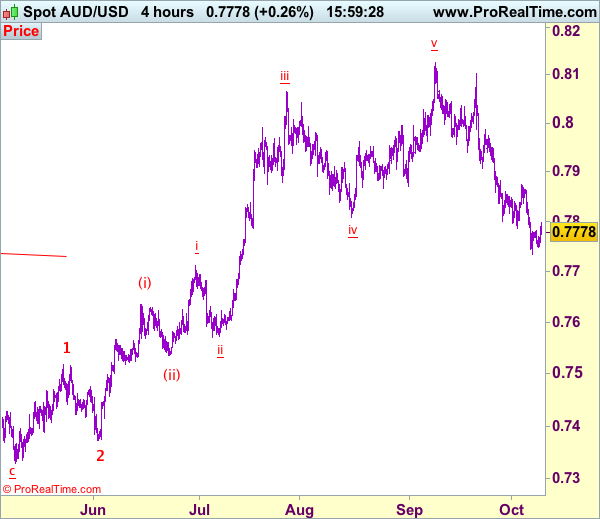
Trade Idea: AUD/USD – Sell at 0.7860
AUD/USD – 0.7780
Original strategy:
Sell at 0.7850, Target: 0.7700, Stop: 0.7910
Position: -
Target: -
Stop:-
New strategy :
Sell at 0.7860, Target: 0.7700, Stop: 0.7920
Position: -
Target: -
Stop:-
Aussie has recovered again after holding above last week’s low at 0.7733, suggesting further sideways trading above this level would take place and corrective bounce to 0.7830-35 cannot be ruled out, however, reckon resistance at 0.7875 would cap upside and bring another decline later, below said support at 0.7733 would add credence to our view that the fall from 0.8125 top is still in progress for weakness to 0.7700-10 but loss of near term downward momentum should prevent sharp fall below 0.7660-65 and reckon 0.7600-10 would hold from here, bring rebound later.
In view of this, we are looking to sell aussie again on recovery as said resistance at 0.7875 should limit upside and bring another decline. Above previous support at 0.7908 (now resistance) would defer and risk a stronger rebound to 0.7950 but resistance at 0.7986 should remain intact and bring another decline later.
On the 4-hour chart, recent upmove from 0.7329 is unfolding as an impulsive rise with wave 3 as well as smaller degree wave (iii) extending, only minor wave v of (iii) has ended at 0.8125, hence bullishness remains for this move to extend headway to 0.8200, then towards 0.8300, however, reckon upside would be limited to 0.8400 and the final wave 5 should falter below 0.8500, bring correction later.
New Zealand Dollar To Depreciate Further Vs US Dollar
Key Highlights
- The New Zealand Dollar started a major downtrend and settled below 0.7150 against the US Dollar.
- There is a crucial bearish trend line forming with resistance at 0.7100 on the 4-hours chart of NZD/USD.
- New Zealand's Electronic Card Retail Sales in Sep 2017 increased 0.1% (MoM).
- Today in the US, the IBD/TIPP Economic Optimism Index for Oct 2017 will be released, which is forecasted to increase from 53.4 to 54.2.
NZDUSD Technical Analysis
The New Zealand Dollar struggled a lot above 0.7250 against the US Dollar. The NZD/USD pair started a downtrend and is currently trading below 0.7150.
The pair was under a lot of pressure and even succeeded in breaking the 0.7160-0.7150 support area, which might now act as a resistance. Recently, the pair traded as low as 0.7055 and is currently recovering.
An initial resistance is around the 23.6% Fib retracement level of the last decline from the 0.7243 high to 0.7055 low. Moreover, there is a crucial bearish trend line forming with resistance at 0.7100 on the 4-hours chart.
If the pair continues to correct higher, it is likely to face sellers near 0.7100. Above 0.7100, the 0.7150 and $0.7160 resistances might act as major hurdles.
New Zealand's Electronic Card Retail Sales
Recently in New Zealand, the Electronic Card Retail Sales for Sep 2017 was reported by Statistics New Zealand. The forecast was slated for a rise of 0.7% in sales compared with the previous month.
The actual result was on the lower side, as there was an increase of 0.1% in sales. However, the last reading was revised up from -0.2% to +0.1%. In terms of the yearly change, there was a rise of 2.9%, which was lower than the last +4.4%.
Commenting on the report, the retail manager, Sue Chapman, stated:
This drop in fuel spending coincided with lower fuel prices at the beginning of the quarter. We can't draw any firm conclusions about the impact of the general election on electronic card spending in September.
The overall sentiment is neutral for NZD/USD, which means there can be a tiny correction towards 0.7120-0.7150 in the near term.
Other Economic Releases to Watch Today
UK Industrial Production for August 2017 (MoM) – Forecast +0.2%, versus +0.2% previous.
UK Manufacturing Production for August 2017 (MoM) – Forecast +0.3%, versus +0.5% previous.
UK Trade Balance non-EU for August 2017 – Forecast £-3.60B, versus £-3.84B previous.
UK Goods Trade Balance for Oct 2017 – Forecast £-11.20B, versus £-12.58B previous.
US IBD/TIPP Economic Optimism Index for Oct 2017 (MoM) – Forecast 54.2, versus 53.4 previous.
GBP/USD Candlesticks and Ichimoku Analysis
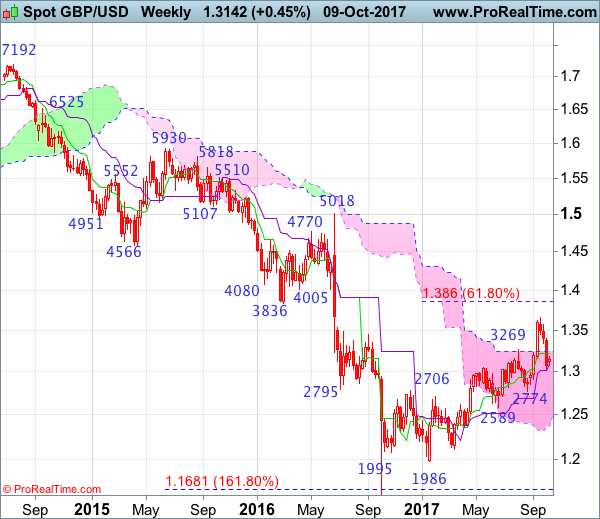
Weekly
• Last Candlesticks pattern: Shooting star
• Time of formation: 31 Jul 2017
• Trend bias: Down
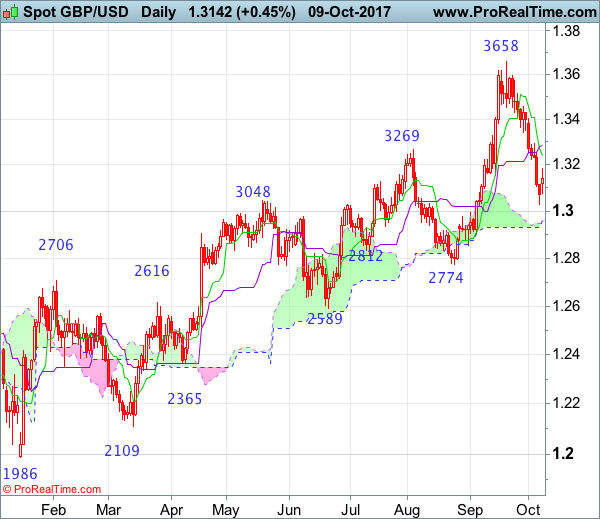
Daily
• Last Candlesticks pattern: Morning star
• Time of formation: 25 Aug 2017
• Trend bias: Near term up
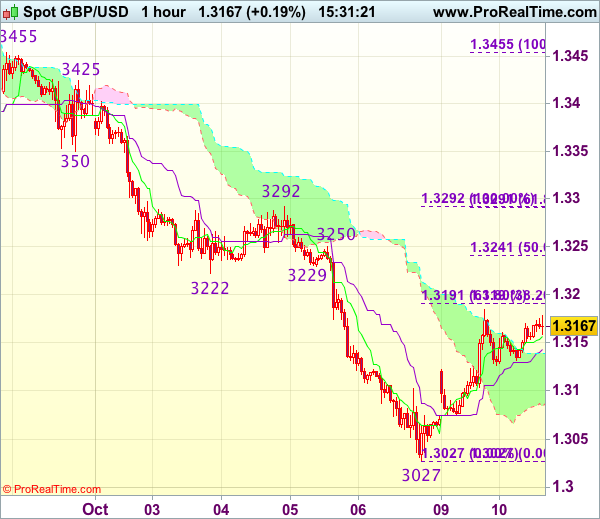
GBP/USD – 1.3142
Cable’s stronger-than-expected retreat from 1.3658 (last month’s high) suggests recent upmove has possibly formed a temporary top there and consolidation with mild downside bias is seen for test of the Ichimoku cloud (now at 1.2953-62), however, a daily close below this level is needed to add credence to this view, bring retracement of recent upmove to 1.2774 support, having said that, near term oversold condition should limit downside to 1.2700 and price should stay well above support at 1.2589.
On the upside, whilst initial recovery to the Tenkan-Sen (now at 1.3241) cannot be ruled out, reckon the Kijun-Sen (now at 1.3284) would limit upside and bring another decline later. A daily close above the Kijun-Sen would defer and risk a stronger recovery to 1.3365-70, however, if our view that a temporary top has been formed at 1.3658 is correct, upside should be limited and resistance at 1.3455 should remain intact, bring another leg of corrective decline later.
Recommendation: Sell at 1.3235 for 1.3035 with stop above 1.3335.
On the weekly chart, last week’s selloff formed a long black candlestick (third one in a row), suggesting a temporary top has possibly been formed earlier at 1.3658 last month, hence consolidation with downside bias is seen, below last week’s low at 1.3027 would add credence to this view, bring retracement of recent upmove to 1.3000, then towards support at 1.2909, however, near term oversold condition should prevent sharp fall below previous chart support at 1.2774 and price should stay well above another previous chart support at 1.2589, bring rebound later.
On the upside, expect recovery to be limited to the Tenkan-Sen (now at 1.3216) and renewed selling interest should emerge around the upper Kumo (now at 1.3247), bring another decline later. Above previous support at 1.3343 would risk test of resistance at 1.3403 but still reckon upside would be limited to 1.3505-10 and bring another leg of corrective decline later. Only break of 1.3571 resistance would signal the pullback from 1.3658 has ended instead, risk retest of this last month’s high, break there would extend recent erratic rise from 1.1986 low to 1.3750-60 and 1.3800 but overbought condition should prevent sharp move beyond 1.3860 (61.8% Fibonacci retracement of 1.5018-1.1986).
USD/CHF Candlesticks and Ichimoku Analysis
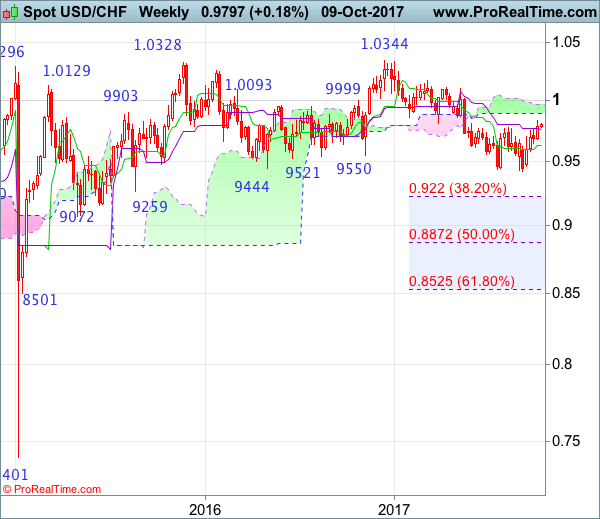
Weekly
• Last Candlesticks pattern: Shooting star
• Time of formation: 7 Mar 2017
• Trend bias: Sideways
Daily
• Last Candlesticks pattern: Morning star
• Time of formation: 9 May 2017
• Trend bias: Near term up
USD/CHF – 0.9690
Although the greenback extended recent rise from 0.9421 to as high as 0.9837 late last week, the subsequent retreat on Friday suggests consolidation below this level would be seen and pullback to the Tenkan-Sen (now at 0.9754) is likely, below there would minor correction to support at 0.9710 but reckon downside would be limited to 0.9685-90 and bring another rise later, above said resistance at 0.9837 would extend the aforesaid rise from 0.9421 to 0.9845-50 (61.8% Fibonacci retracement of 1.0108-0.9421), then 0.9900-10, however, reckon upside would be limited and price should falter below psychological resistance at 1.0000.
On the downside, whilst initial pullback to the Tenkan-Sen (now at 0.9754) cannot be ruled out, reckon minor support at 0.9710 would limit downside and renewed buying interest should emerge around 0.9680-90 and bring another rise later. Below support at 0.9670 would risk test of support at 0.9642 but a daily close below latter level is needed to signal top is formed instead, bring retracement of recent rise to the Kijun-Sen (now at 0.9629) and then test of the upper Kumo (now at 0.9600), however, lower Kumo (now at 0.9582) should hold on first testing and price should stay well above support at 0.9565.
Recommendation: Buy at 0.9695 for 0.9895 with stop below 0.9595.

On the weekly chart, the greenback surged again last week and broke above previous resistance at 0.9773, adding credence to our view that low has been formed earlier at 0.9421, hence consolidation with mild upside bias is seen for the rebound from 0.9421 to bring retracement of recent decline to 0.9845-50 (61.8% Fibonacci retracement of 1.0108-0.9421), then test of the lower Kumo (now at 0.9894) but upside should be limited to the upper Kumo (now at 0.9970), price should falter well below resistance at 1.0100-08.
On the downside, although initial pullback to 0.9710 is likely, reckon last week’s low at 0.9676 would limit downside and bring another rise. A drop below the Tenkan-Sen (now at 0.9629) would suggest the first leg of rebound from 0.9421 low has ended, bring weakness to 0.9580 support but still reckon downside would be limited to support at 0.9565 and price should stay above 0.9490-00, bring another rebound later this month. .
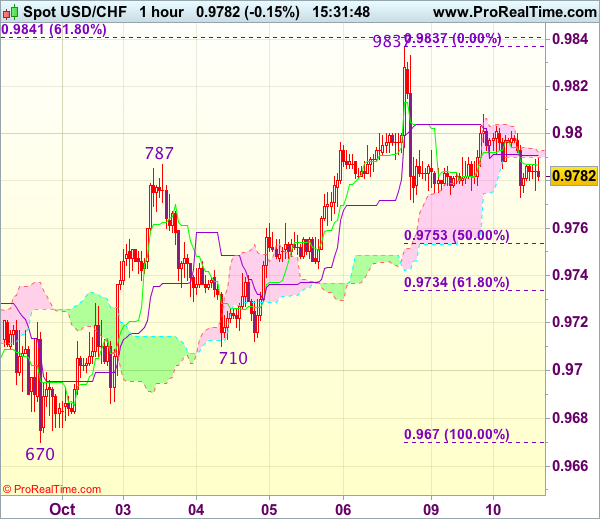
Trade Idea : USD/CHF – Stand aside
USD/CHF - 0.9783
Most recent candlesticks pattern : N/A
Trend : Near term up
Tenkan-Sen level : 0.9787
Kijun-Sen level : 0.9791
Ichimoku cloud top : 0.9792
Ichimoku cloud bottom : 0.9790
New strategy :
Stand aside
Position : -
Target : -
Stop : -
Despite last week’s late rise to 0.9837, the subsequent retreat to 0.9771 suggests top has possibly been formed there and consolidation with mild downside bias is seen for weakness to 0.9750-55 (50% Fibonacci retracement of 0.9670-0.9837), however, break of 0.9730-35 (61.8% Fibonacci retracement) is needed to add credence to this view, bring further fall towards support at 0.9710 which is likely to hold on first testing.
On the upside, whilst recovery to 0.9805-10 cannot be ruled out, reckon said resistance at 0.9837 would hold and bring another retreat later. Above said resistance at 0.9837 would shift risk back to upside and signal the rise from 0.9421 low is still in progress, then gain to 0.9875-80 would follow but reckon 0.9900 would hold from here. As near term outlook is still mixed, would be prudent to stand aside for now.
Dollar Slips Further From 10-Week High, Is The Rally Over?
The dollar index fell for a third consecutive day early Tuesday, despite market expectations of a rate hike in December, hovering near 90%. Since 8 September, the index has rallied almost 3% in a clear sign that the greenback has finally found its feet, after declining more than 12% from January highs. However, investors have almost wholly priced in a third-rate increase for 2017 and now require another catalyst to decide on whether to push the dollar higher from current levels.
The dollar’s strength since early September has been accompanied by a rally in U.S. Treasury yields. U.S. 10-year Treasury yields gained 15% from September lows, sending U.S.- German 10-year rate differentials to a four-month high. It is highly likely that EUR/USD and other major currency pairs will continue to track the interest rate differentials, so traders should keep a close eye on how bond yields behave in the last quarter of 2017.
Another factor supporting the dollar isthe belief that a reduction in taxes and other forms of fiscal stimulus, will materialize in the coming months, leading to tighter monetary policy and further increases in interest rates in 2018 and 2019. However, this depends a lot on Trump’s choice of the next Fed chair.
Higher interest rates will undoubtedly disrupt the current U.S. administration’s economic policy plans. I firmly believe that Trump wants a dovish Fed to keep the U.S. dollar lower,in order to support his economic agenda. In the next couple of weeks, we will start hearing about how Mr. Trump is willing to politicize the independent government agency, the Federal Reserve. In my opinion, this would be a dangerous phase that will lead to a lot of criticism and suspicions amongst investors holding the U.S. currency.
The short-term rally might not be over yet for the dollar, but I prefer selling the rallies than buying the dips at this stage. Let’s not forget that other central banks are also planning to tighten their monetary policies, particularly the BoE and ECB, thus reducing the interest rate advantage currently held by the U.S. dollar.
GBP/JPY Daily Outlook
Daily Pivots: (S1) 147.15; (P) 147.85; (R1) 148.79; More
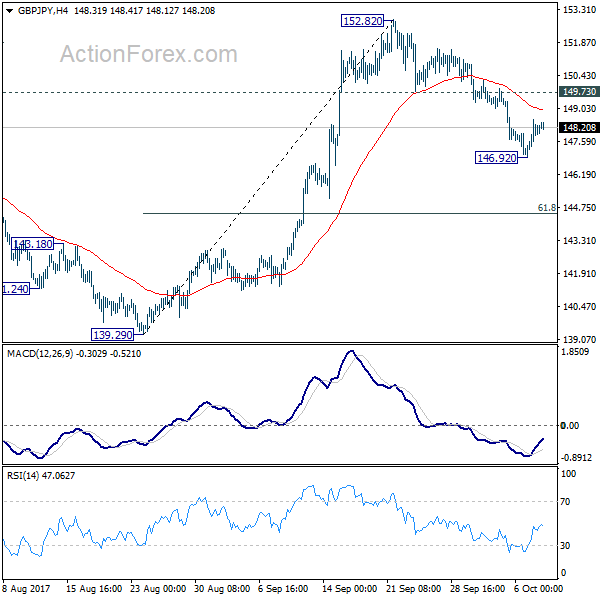
A temporary low is formed at 146.92 and intraday bias is turned neutral first. Another decline is expected with 149.73 intact. Below 146.92 will target 61.8% retracement of 139.29 to 152.82 at 144.45. Such decline is seen as a correction and we'd look for strong support from 144.45 to bring rebound. On the upside, break of 149.73 support turned resistance will argue that the pull back is completed and turn bias back to the upside for retesting 152.82 high. However, sustained break of 144.45 will put 139.29 key support in focus.
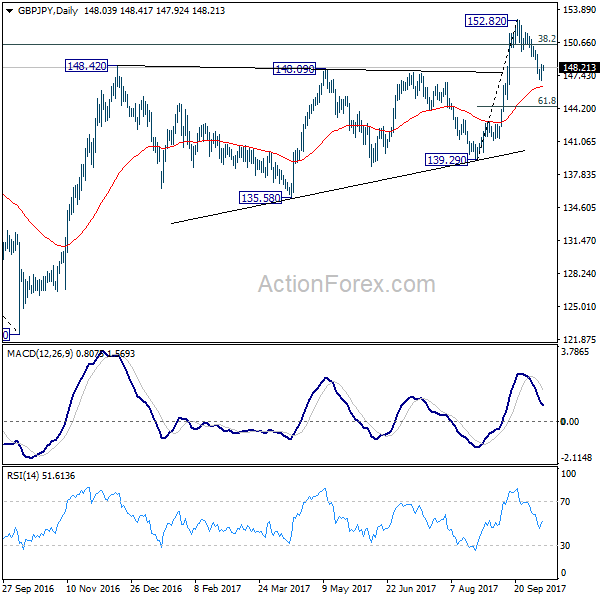
In the bigger picture, medium term rebound from 122.36 is still expected to resume after corrective pull back from 152.82 completes. Firm break of 38.2% retracement of 196.85 to 122.36 at 150.43 will carry long term bullish implications. In that case, GBP/JPY could target 61.8% retracement at 167.78. However, break of 139.29 will indicate rejection from 150.43 key fibonacci level. And the three wave corrective structure of rebound from 122.36 will argue that larger down trend is resuming for a new low below 122.26.
Trade Idea : GBP/USD – Hold short entered at 1.3170
GBP/USD - 1.3169
Most recent candlesticks pattern : N/A
Trend : Down
Tenkan-Sen level : 1.3157
Kijun-Sen level : 1.3143
Ichimoku cloud top : 1.3139
Ichimoku cloud bottom : 1.3084
Original strategy :
Sold at 1.3170, Target: 1.3070, Stop: 1.3185
Position : - Short at 1.3170
Target : - 1.3070
Stop : - 1.3185
New strategy :
Hold short entered at 1.3170, Target: 1.3070, Stop: 1.3195
Position : - Short at 1.3170
Target : - 1.3070
Stop : - 1.3195
Although cable has maintained a relatively firm undertone after rising to 1.3184 yesterday, still reckon 1.3190-95 (61.8% Fibonacci retracement of 1.3292-1.3027 as well as 38.2% Fibonacci retracement of 1.3455-1.3027) would cap upside and bring retreat later, below 1.3125-30 would bring test of 1.3100, break there would suggest top is formed, bring subsequent fall to 1.3065-75, break there would suggest the rebound from 1.3027 has ended, bring retest of this level, below there would extend recent decline to psychological support at 1.3000 next.
In view of this, we are holding on to our short position entered at 1.3170. Above 1.3190-95 would risk test of previous support at 1.3222-29 (now resistance), break there would abort and signal low has been formed at 1.3027 instead, bring further gain to 1.3250 but price should falter below resistance at 1.3292.