
Sample Category Title
Euro Recovers Broadly as Markets Looking Past Catalonia, Pound Dives after PMI Construction
Euro recovers broadly today as markets are looking past the political turmoil in Spain, with focus back on ECB and economic outlook. European markets, except Spain, are steady with Germany on holiday. At the same time, thousands of people protest in Barcelona against police violence during the referendum on Catalonia independence on Sunday. The European parliament will be holding a special session on the issue tomorrow and European commission spokesman Margaritis Schinas urged that "violence can never be an instrument in politics". Elsewhere, Sterling is trading as one of the weakest one today after shockingly bad construction data. Dollar stays firm but struggles to find follow through buying.
UK PMI construction dropped to lowest since July 2016
UK PMI construction dropped sharply to 48.1 in September, down from 51.1 and missed expectation of 51.1. That's also the lowest level in more than a year since July 2016. Markit noted that "a shortfall of new work to replace completed projects has started to weigh heavily on the UK construction sector." Also, "survey respondents widely commented on a headwind from political and economic uncertainty, alongside extended lead times for budget approvals among clients". And CIPS noted that ""Respondents pointed to obstructive economic conditions and the Brexit blight of uncertainty, freezing clients into indecision over new projects".
BoE FPC minutes: Substantial risk of disruption of cross-border clearing activity
In the minutes of BoE's September 20 Financial Policy Committee meeting, the central bank noted that "there remained a substantial risk of disruption of cross-border clearing activity" after Brexit. And therefore the central bank was "was continuing to engage financial market infrastructure and firms on their contingency planning." BoE pointed out that some clearing houses are looking at contingency plans like moving activities from UK. However, in some cases, "complexity and cost of any migration was significant" and it's not an option.
RBA stands pat, few changes to statement
RBA left the cash rate unchanged at 1.50% today. The accompanying statement contained few changes from the previous one. This perhaps explains the modest drop in Aussie after the release, as the market had expected a more hawkish message. The central bank is upbeat over the economic developments, hinging on the improving non-mining investment. Policymakers also acknowledged the strength in the job market, pointing to the rise in participation rate as well as a number of forward-looking indicators. Comments on the exchange rate were limited, with the central bank reiterating the impact of a strong Aussie on inflation, GDP growth and employment. We expect the central bank to keep the policy rate unchanged until 2H18. More in RBA Upbeat On Economic Growth, No Rush To Hike Rates.
PBoC adopts targeted RRR cut
In China, PBOC announced to adopt targeted RRR cut in 2018 in some banks to 'encourage inclusive financing, such as credit support for small and micro-sized enterprises (SMEs), startups and agricultural production, as well as small business owners, impoverished groups and students. We believe the move is a fine-tuning of PBOC's other tightening measures, rather than a shift towards a loosening monetary stance. Indeed, by choosing a targeted RRR cut, instead of a broad-based cut or a rate reduction, the central bank is sending a signal that it has not changed the monetary policy stance which remains 'prudent and neutral". More in PBOC Announced Targeted RRR Cut, Just Fine-Tuning Of Monetary Policy.
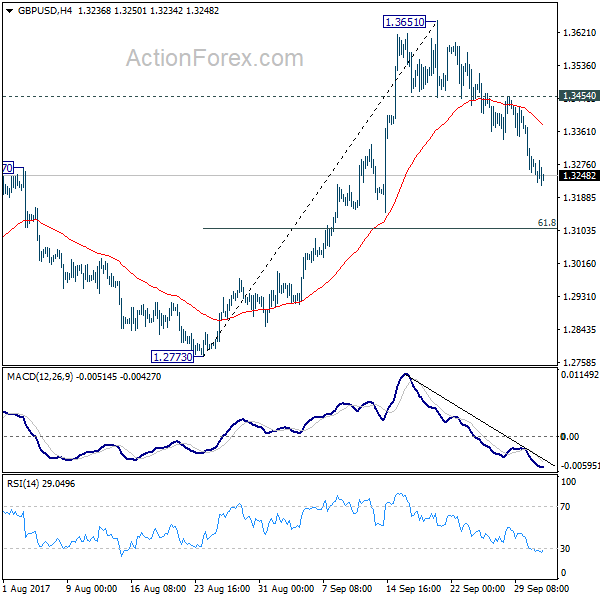
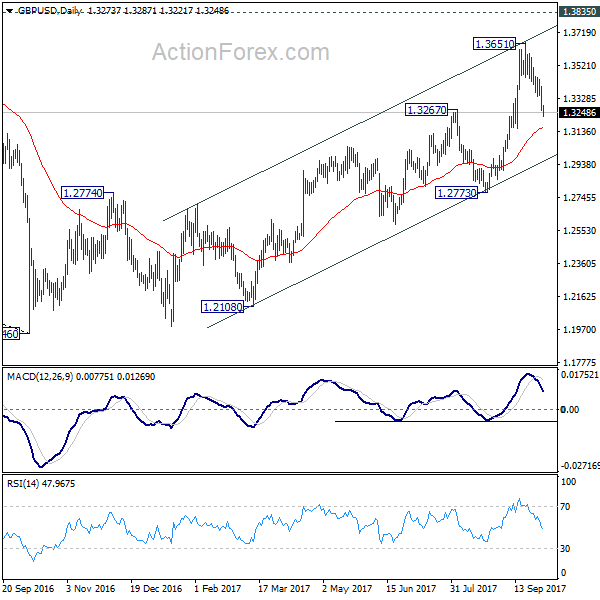
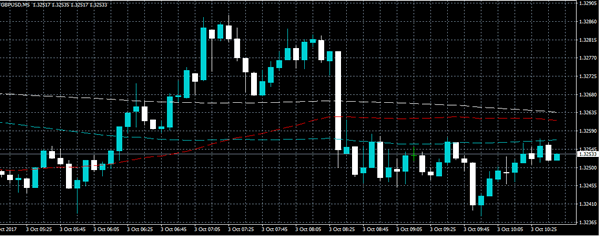
GBP/USD Mid-Day Outlook
Daily Pivots: (S1) 1.3219; (P) 1.3310; (R1) 1.3366; More....
GBP/USD's fall from 1.3651 is still in progress and intraday bias remains on the downside. Current decline would extend to 61.8% retracement of 1.2773 to 1.3651 at 1.3108. On the upside, break of 1.3454 minor resistance is needed to signal completion of the decline. Otherwise, near term outlook remains mildly bearish in case of recovery.
In the bigger picture, current development argues that the long term trend in GBP/USD has reversed. That is, a key bottom was formed back in 1.1946 on bullish convergence condition in monthly MACD. Current rise from 1.1946 will target 38.2% retracement of 2.1161 (2007 high) to 1.1946 (2016 low) at 1.5466 next. In any case, medium term outlook will now stay bullish as long as 1.2773 support holds.
Economic Indicators Update
| GMT | Ccy | Events | Actual | Forecast | Previous | Revised |
|---|---|---|---|---|---|---|
| 23:50 | JPY | Monetary Base Y/Y Sep | 15.60% | 16.30% | 16.30% | |
| 0:30 | AUD | Building Approvals M/M Aug | 0.00% | 1.00% | -1.70% | -1.20% |
| 3:30 | AUD | RBA Rate Decision | 1.50% | 1.50% | 1.50% | |
| 5:00 | JPY | Consumer Confidence Sep | 43.9 | 43.5 | 43.3 | |
| 8:30 | GBP | Construction PMI Sep | 48.1 | 51.1 | 51.1 | |
| 9:00 | EUR | Eurozone PPI M/M Aug | 0.30% | 0.10% | 0.00% | |
| 9:00 | EUR | Eurozone PPI Y/Y Aug | 2.50% | 2.30% | 2.00% |
Intraday EURUSD Sellers Fail at 1.1710
The euro has moved towards the 1.1760 level against the U.S dollar on strong technical buying, after intraday EURUSD sellers failed close price-action below the key pairs key 200-week moving average.
Trading sentiment surrounding the EURUSD pair has also improved, after the eurozone's monthly Producer Price Inflation reading unexpectedly climbed 0.3 percent.
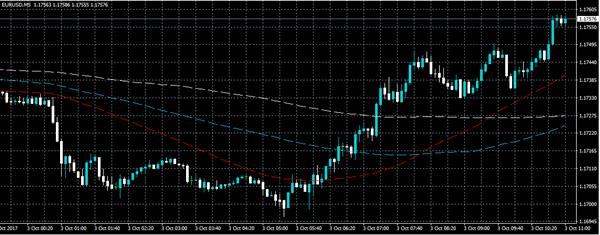
After spiking higher in the Asian trading, the U.S dollar index has declined close to forty points from today's high, hinting that a near-term top may be in-place in the greenback, ahead of Friday's U.S job report.
The EURUSD has also recovered above its daily pivot point, found at the 1.1748 level, and is fast approaching the key 1.1770 resistance area.
Key intraday technical support for the EURUSD is found at 1.1748, 1.1730 and 1.1710. Below the key 1.1710 level, further losses towards 1.1690 and 1.1662 are expected.
Key intraday technical resistance for the EURUSD is found at 1.1770 and 1.1800 levels. Once above the 1.1800 level, the euro's weekly pivot point offers further resistance at 1.1823, as does the pairs monthly pivot, at 1.1875.
GBPUSD Continues to Drift Lower
The British pound has fallen to a fresh weekly against the U.S dollar, hitting 1.3229, after the United Kingdom's Construction PMI unexpectedly contracted for the month of September, with a disappointing 48.1 reading.
Trading sentiment surrounding the GBPUSD pair is currently bearish, after a series of weaker than expected UK data points in September have pushed back expectations of an October rate hike from the Bank of England.
Going forward, the GBPUSD pair may have reached the bottom-end its medium-term trading range at 1.3229. Short-term stochastic and RSI technical indicators are also in heavily oversold territory.
Price-action has subsequently recovered above 1.3250, with a pullback towards the 1.3300 region increasingly likely, as traders reassess positioning before Friday's Nonfarm Payrolls jobs report.
Key intraday GBPUSD technical support is located at the current weekly price low, at 1.3229 and the former yearly high, at 1.3215. Below the 1.3200 level, the pairs key 50-day moving average is found, at 1.3135.
To the upside, key technical resistance is found at the pairs M5 time frame 200-period moving average, at 1.3263. Above 1.3263, the GBPUSD daily pivot is located at 1.3302, with the pairs 50-hour moving average, at 1.3320.
USD/JPY Could Drop as Long as it is Below 113.45
The USD/JPY trend is bullish as we can see from the PPR channel, but last few days we see a consolidation below the W H4- weekly H4 camarilla pivot that could tank the price towards 112.40 and 112.00. There is a confluence at the top of the range exactly at the AP channel high. 112.90-113.15 is the POC zone (W H3, AP high, ATR pivot) and the price could reject as long as it is held below 113.45. Targets are 112.50, and 112.00 - W L3. If the price gets to W L3 pivot it could bounce again.
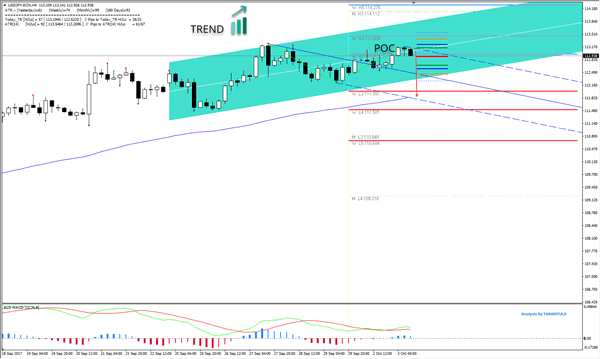
W L3 - Weekly Camarilla Pivot (Weekly Interim Support)
W H3 - Weekly Camarilla Pivot (Weekly Interim Resistance)
W H4 - Weekly Camarilla Pivot (Strong Weekly Resistance)
D H4 - Daily Camarilla Pivot (Very Strong Daily Resistance)
D L3 - Daily Camarilla Pivot (Daily Support)
D L4 - Daily H4 Camarilla (Very Strong Daily Support)
POC - Point Of Confluence (The zone where we expect price to react aka entry zone)
CAC Climbs to 4-Month High on Solid Eurozone Inflation Report
The CAC index has paused on Tuesday, after registering gains in the Monday session. Currently, the CAC is trading at 5,360.30, up 0.18% from Monday's close. On the release front, there was only one eurozone event. Producer Price Index gained 0.3%, above the forecast of 0.1%. This marked the indicator's strongest gain since January. On Wednesday, France and the eurozone will release Final Services PMI and ECB President Mario Draghi will speak at an event in Frankfurt.
The CAC enjoyed a robust September, as the index jumped 4.1 percent. Investors have given the thumbs up to a stronger French economy, which has rebounded in 2017. There was good news from the manufacturing front on Monday, as French Final Manufacturing PMI accelerated for a fourth straight month, and continues to point to expansion. The services sector continues to show expansion, and French Services PMI is expected to climb to 57.1 on Wednesday. Last week, the Bank of France revised upwards its growth forecast to 1.7 percent, up from 1.6 percent in July and 1.4 percent in June. Villeroy de Galhaum, head of the Bank of France, said that although the economy was improving, a growth rate of 1.7% was still short of the eurozone growth rate of 2.0 percent. The Bank of France forecast is in line with that of the OECD, which has revised its growth forecast for France from 1.3 percent to 1.7 percent. At the same time, the OECD has said that continued French growth is contingent upon President Emmanuel Macron implementing a long-term plan to slash public spending, which is the highest in the 35-member OECD.
European investors continue to keep a watchful eye on events in Spain. Catalonia, one of the richest regions in the country, was a scene of chaos and violence over the weekend. The Catalan regional government attempted to hold a referendum on independence, but the national government was adamantly opposed to the move and banned the vote. When voters showed up at polling stations, the police moved in with force, injuring close to 900 civilians. Catalonian officials claimed that 90 percent of voters had voted for independence, setting the stage for a full-blown crisis with Madrid. The Spanish constitution prohibits any region from seceding, but Catalan Carles Puigdemont has not showed any intent to back down, and has called for a general strike on Tuesday. Although the euro lost ground on Monday, the crisis is not expected to continue to weigh on the currency, given that the referendum is viewed as an issue local to Spain, and not to the eurozone in general. As well, the Spanish economy is in good shape, so a constitutional crisis is unlikely to affect the country's economic growth.
PBOC Announced Targeted RRR Cut, Just Fine-Tuning Of Monetary Policy
PBOC announced to adopt targeted RRR cut in 2018 in some banks to 'encourage inclusive financing, such as credit support for small and micro-sized enterprises (SMEs), startups and agricultural production, as well as small business owners, impoverished groups and students. All of the large and medium sized commercial banks, 90% of municipal commercial banks, and 95% of agriculture commercial banks are eligible for this measure. Banks with inclusive financing exposure higher than 1.5% of loans would be eligible for 50 bps RRR cut from benchmark ratios. Banks with exposure higher than 10% would qualify for additional 100 bps RRR cut. We believe the move is a fine-tuning of PBOC's other tightening measures, rather than a shift towards a loosening monetary stance. Indeed, by choosing a targeted RRR cut, instead of a broad-based cut or a rate reduction, the central bank is sending a signal that it has not changed the monetary policy stance which remains 'prudent and neutral”.
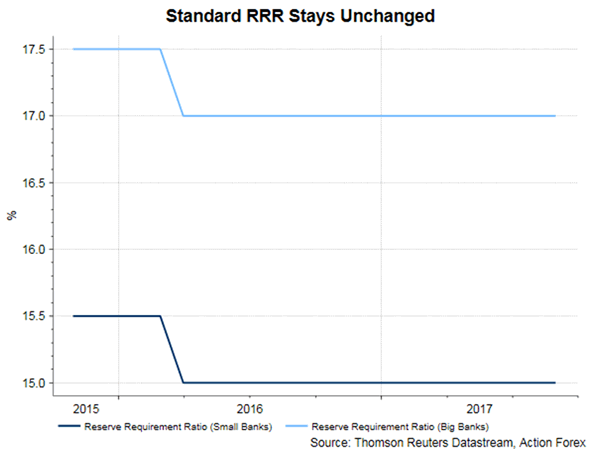
Taking Effect in 2018
The plan to implement the RRR cut in 2018, rather than immediately, justifies our view that this move is a fine-tuning of other tightening measures. We believe PBOC would like the targeted RRR cut to offset part of the impact of the inclusion of negotiable certificate of deposits (NCDs) in the quarterly macro-prudential Assessments (MPA) from 1Q18. The measure, announced on August 11, aims at controlling the excessive use of interbank CDs in interbank financing. (More on NCDs: https://www.actionforex.com/action-insight/china-watch/38422-china-s-monetary-conditions-remain-tight-as-deleveraging-in-progress). This measure would tighten liquidity in many banks.
On Track to Achieve Growth Target
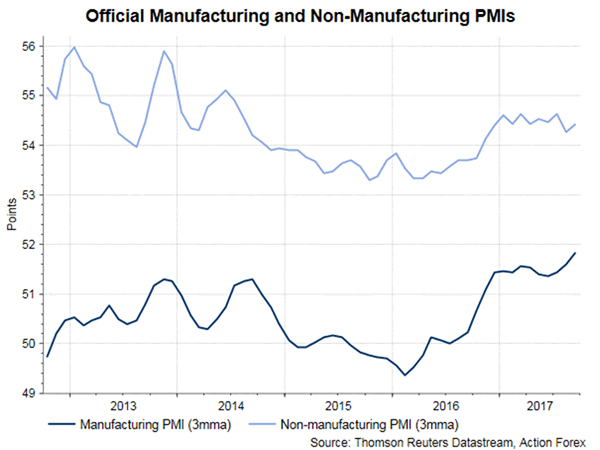
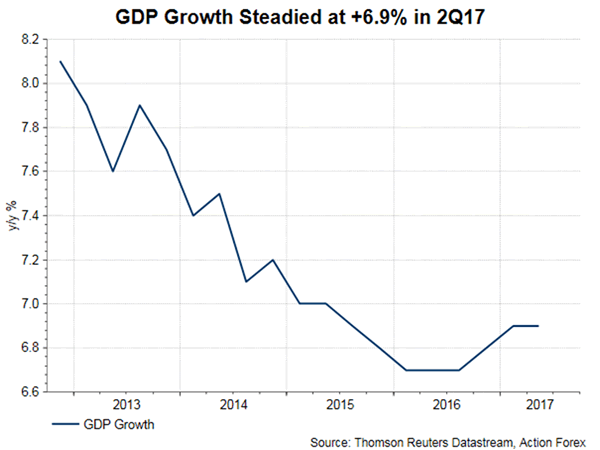
The central bank has no urgency to loosen its monetary policy in the current macroeconomic environment. Although the growth of economic activities has shown signs of moderation in third quarter, the strength in the first half of the year suggests that the government is still on track to achieve it full year growth target of around +6.5%. Recent data have shown that the economic activities remained robust. The official manufacturing PMI data added +0.7 points to 52.4 in September, highest since April 2012. Looking into the details, the new orders index gained +1.7 points to 54.8 while the new export orders index added +0.9 point to 51.3. The input prices index jumped +3.1 points to 68.4, highest since December 2016. The Caixin manufacturing PMI, however, slipped -0.6 points to 51 for the month. This is because the official survey targets large firms while Caixin's survey targets SMEs. On the non-manufacturing sector, official PMI added +2 points to 55.4, highest since May 2014
Global Environment Does Not Warrant Loosening
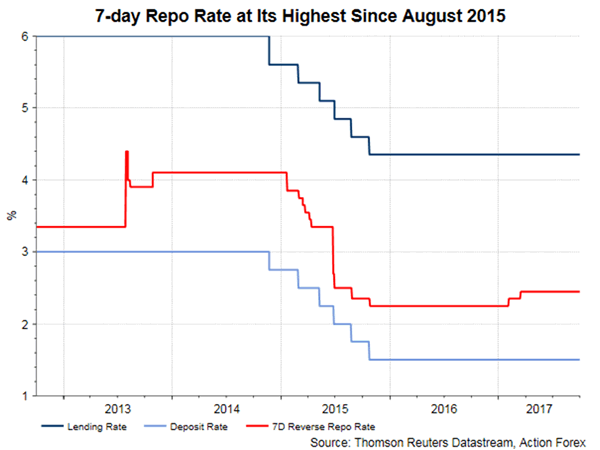
A number of major central banks have ended their ultra-accommodative monetary policy: The Fed has begun rate hike in December 2015 and would start balance sheet reduction this month. ECB signaled in June that interest rates would not go lower and has recently signaled to discuss QE tapering in autumn. BOE has warned that the market has underestimated the chance of a rate hike and indicated that one would come soon. BOC has begun its tightening cycle in July. The global environment has made it more difficult for PBOC to formally adopt monetary easing or it would risk capital outflow and massive selloff of the renminbi. A GDP growth rate below +6.5% might trigger PBOC to adopt a broad-based monetary loosening. A shift in the monetary policy stance should be first visible in the 7-day repo, which has stayed at high level.
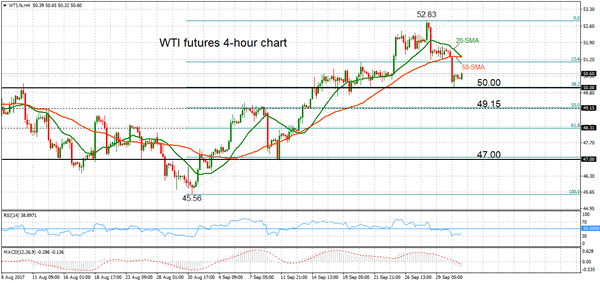
WTI Oil Futures Hold Neutral To Bearish Bias In Short Term, Key Support At 50
WTI oil futures dropped below the recent consolidation range and prices are now targeting support at the key 50 level. Risk is clearly tilted to the downside in the near term, while technical signals are bearish.
The MACD and RSI are both in bearish territory now. However, the RSI has flattened out, suggesting that downside pressure has eased for now and another consolidation phase is being formed within the 50-handle.
The 20-period moving average has turned back down and is threatening to cross below the 50-period MA. A bearish signal would be given should this crossover happen.
Based on Fibonacci analysis, key retracement levels of the rise from 45.56 to 52.83 are expected to act as support. The 38.2% Fibonacci lies at the key 50 level. The 49.15 level represents the 50% Fibonacci and so falling below this key support would increase the odds of seeing a reversal of the September uptrend and the 47 area would be targeted.
Prices would need to reclaim the 51 handle to indicate the bearish phase is over and shift the focus back to the upside. Breaking above the resistance (previous support) and 50-period MA at 51.30 would target the 52.83 peak and from this point there would be a resumption of the September uptrend with scope to target the previous major high at 53.75.
In the meantime, WTI oil futures are vulnerable to weakness but prices are expected to consolidate within a range just above 50 in the near term. The market holds a neutral to bearish bias.
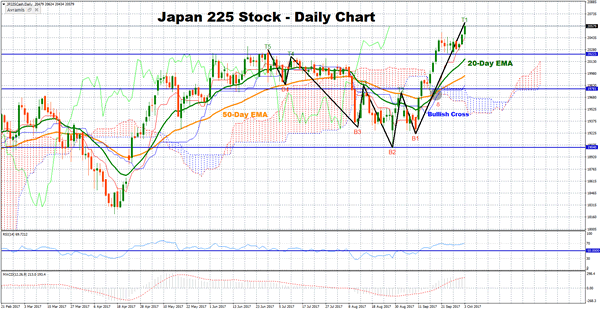
Japan 225 Stock Index Posts Bullish Trend After A Failure Swing
The Japan 225 stock index failed to post a lower low on September 11 and confirmed a failure swing on September 12 when it picked above 19737, which extended to an uptrend, sending the index to a multi-month high of 20624 on October 3. Bias in the short-term and the medium term is bullish according to technical indicators.
The RSI and the MACD signal a bullish picture in the short-term, with both technical indicators fluctuating far above their neutral zones. Particularly the RSI is above 50 and marginally below overbought area, while the MACD is above zero and its signal line. Moreover, the fact that the index is trending above the 20-day Exponential Moving Average and the Ichimoku cloud point to a bullish bias as well.
Should the index continue rising, the August 9, 2015, top of 20935 could act as a resistance before the psychological levels 21000 and 23000 come into view.
Otherwise, if the index pulls back, an immediate support could be found at 20223, which was repeatedly tested in the second half of September. Further downside movements from here, would turn the bullish bias into neutral one and target the top of the Ichimoku cloud at 19781. A break below the August 29 bottom of 19040 would see a resumption of the downtrend started on July 11.
Turning to the medium term, the index is likely to follow a bullish path as the bullish cross between the 20 and the 50-day EMA is still in place and both EMA lines are trending up.
Foreign Exchange Market Commentary: EUR/USD, USD/JPY, GBP/USD, GOLD, WTI CRUDE, DJIA, FTSE100, DAX
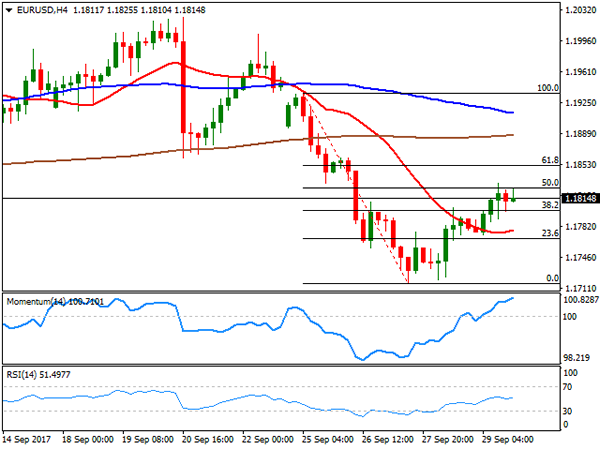
EUR/USD
It was another rough start to the week for the EUR as the common currency was affected by political jitters in Spain. The Catalonian referendum, which resulted in hundreds injured as the central police clashed with local voters, revived concerns over the fragility of the union, after Brexit. The unsought violence only deepened Spain political crisis, triggered the response of the UN High Commissioner for Human Rights, Zeid Ra'ad Al Hussein, called for "independent and impartial investigations into all acts of violence." This comes after a sour Merkel' victory the previous week in the German election. Despite macroeconomic data indicated solid growth in the EU, such figures are worthless when the union itself it's on doubt.
In the data front, September final Markit manufacturing PMI for the EU was revised to 58.1 from a preliminary estimate of 58.2, anyway above August reading of 57.4, indicating that conditions in the manufacturing sector strengthened to the greatest extend in over six-and-a-half years, according to the official report. US numbers, however, were also above expected, preventing the pair from recovering later on the day, as the US ISM Manufacturing index came in at 60.8 in September from previous 58.8. Dollar's advance was halted by a dovish speech from Minneapolis Fed Kashkari, who claimed that the Fed is responsible for the weaker inflation, and shouldn't raise rates before inflation hits 2.0%.
The pair settled in the 1.1740 region after trading as low as 1.1730, heading into the Asian opening with a persistent bearish tone in intraday charts, as the price holds near its September low of 1.1716, and further away from the 1.1820/30 region, a now key resistance area. In the 4 hours chart, the price settled below all of its moving averages, although the 20 SMA remains flat around 1.1780, indicating that the bearish trend has lost momentum, at least temporarily. In the same chart, technical indicators suggest the same, having turned flat, but given that they hold within bearish territory, the downside remains favored towards 1.1661, August monthly low.
Support levels: 1.1720 1.1690 1.1660
Resistance levels: 1.1780 1.1825 1.1860
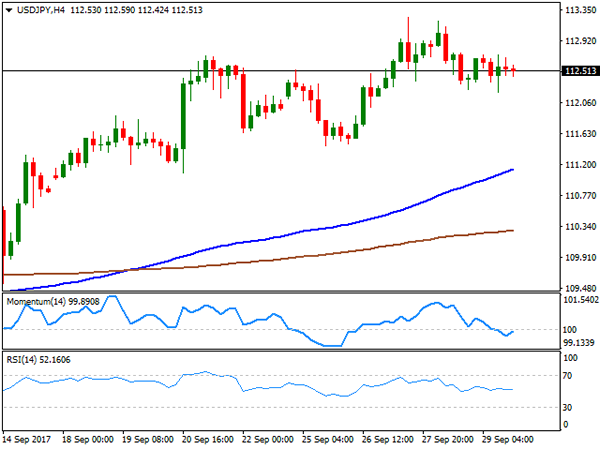
USD/JPY
The USD/JPY pair struggled for direction this Monday, ending the day marginally higher around 112.60. The pair advanced up to 113.05 at the beginning of the day, but bulls lost the grip, despite positive US data and rising US yields. Earlier on the day, Japan’s quarterly Tankan business sentiment survey surged to its highest in a decade, with the main index for Q3 up to 22 from previous 17, a sign that the economic recovery is broadening. In the US, yields mover marginally higher, with the 10-year note benchmark up to 2.34% after closing on Friday at 2.32%. Also, the Nikkei Manufacturing PMI rose in September to 52.9, beating previous estimates of 52.6. The pair is in a consolidative phase with the bullish trend holding in the background. In the 4 hours chart, technical indicators continue to be stuck around their mid-lines, but the price remains above a strongly bullish 100 SMA, which now advanced up to the 111.60 region. The pair topped at 113.25 last week, the level to surpass to confirm another leg higher, which can extend up to the critical 114.40 region during the following sessions.
Support levels: 112.20 111.85 111.50
Resistance levels: 112.90 113.25 113.60
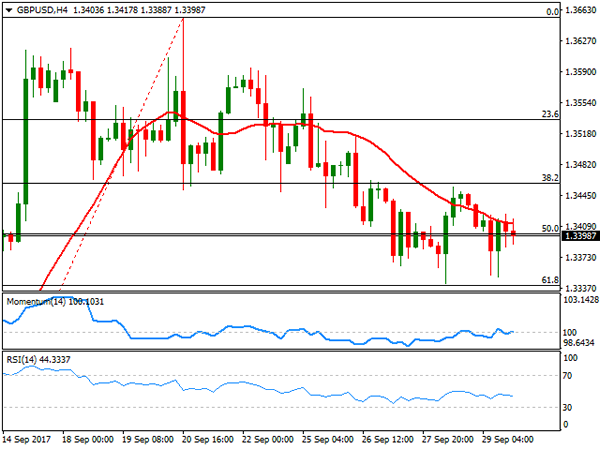
GBP/USD
The GBP/USD pair plunged to 1.3256, its lowest ever since the latest BOE's meeting, when Governor Carney said markets could be underestimating odds of a rate hike in the UK. The pair was trading around 1.3200 ahead of the event, as it has now become a probable bearish target, as despite the hawkish rhetoric towards rate hikes persists, they are being offset by concerns about the economic consequences on Brexit, and the absence of progress in negotiations, despite latest PM May's speech. The pair fell after breaking a key support, the 61.8% retracement of the latest bullish run at 1.3340, later fueled by a disappointing September Markit manufacturing PMI for the UK, down to 55.6 against the previous 56.7 and the expected 56.4. The pair recovered modestly from the mentioned low, but stands barely 20 pips above the level, and still bearish according to technical readings, as in the 4 hours chart, the 20 SMA extended its decline well above the current level, whilst technical indicators barely decelerate their declines, now trying to stabilize within oversold readings. The same chart shows that the price met support around its 200 EMA, usually a tough bone to break, but also a line in the sand, as a bearish extension below it will likely result in a steeper decline during the following sessions.
Support levels: 1.3250 1.3210 1.3170
Resistance levels: 1.3300 1.3340 1.3385
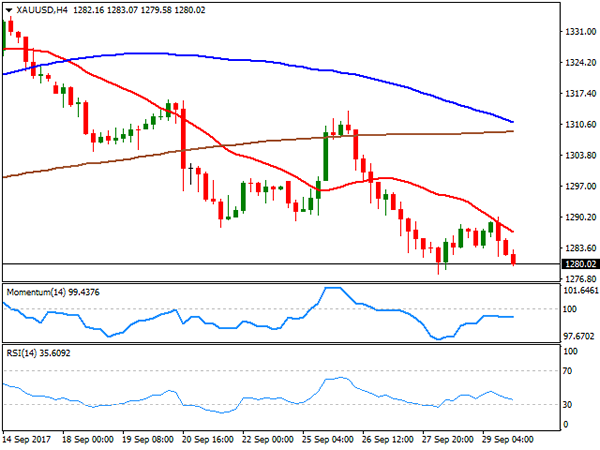
GOLD
Gold's bearish trend persisted, with spot down to fresh over 1-month low at the beginning of the week, with spot closing the day at $1.274.38 a troy ounce after falling to 1,271.10. Broad dollar's strength kept the commodity under pressure, further undermined by US equities rallying to record highs. Negative comments from US Fed members prevented gold from falling further, as adding to Kashkari comments, later on the day Fed's Kaplan warned that Q3 growth may be sluggish, amid the hurricanes that hit the US this past September. The fact that the bounce was shallow, suggest that the market still believes the Fed will pull the trigger next December, and therefore leans the scale towards the downside. Spot gold's daily chart shows that the yellow metal ended the session around its 100 DMA, and well below a bearish 20 DMA, whilst technical indicators hold near oversold territory, supporting additional slides ahead. The next key support comes at 1,261.30, the 200 DMA in the same chart. In the shorter term, and according to the 4 hours chart, spot is also biased lower, despite technical indicators lost downward momentum, as they hold anyway within negative territory, whilst the price keeps developing below sharply bearish moving averages.
Support levels: 1,271.10 1,261.30 1,252.90
Resistance levels: 1,283.10 1.294.25 1,303.95
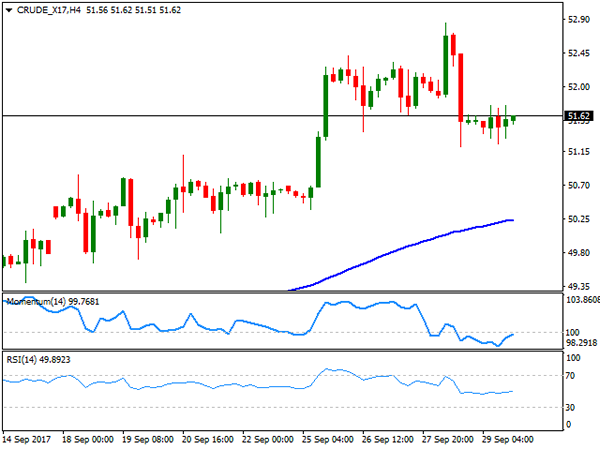
WTI CRUDE OIL
Crude oil prices plunged this Monday, hit by news indicating a decline in OPEC's compliance with the output cut agreement in September, according to a Reuters' poll, which estimates compliance in the month was just of 86%. Also, broad dollar's strength weighed on the black gold, with WTI futures ending the day around $50.55 a barrel, after trading as low as 50.03. The US benchmark closed the day right below the 38.2% retracement of its latest bullish run between 46.99 and 52.84 at 50.60, keeping the risk towards the downside for this Tuesday. In the daily chart, technical indicators maintain their strong bearish within positive territory, now nearing their mid-lines, whilst the price remains well above the 100 and 200 DMAs, maintaining the current decline as corrective. In the 4 hours chart, the price settled a few cents above a bullish 100 SMA after falling to near the 50% retracement of the mentioned rally at 49.90, whilst technical indicators bounced modestly from oversold readings, but are far from suggesting an upcoming recovery.
Support levels: 49.90 49.30 48.65
Resistance levels: 50.60 51.20 51.85
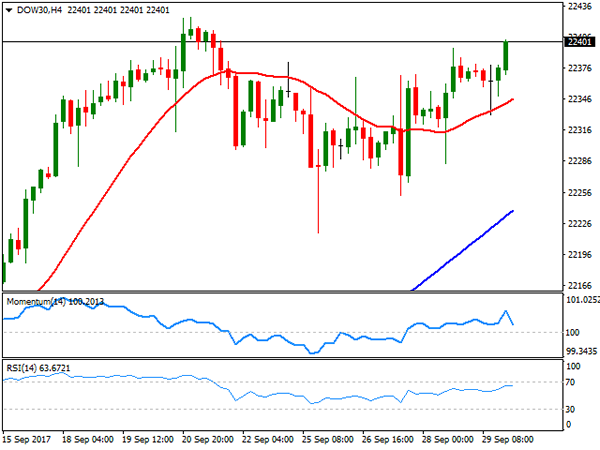
DJIA
Wall Street ended firmly up this Monday, with the DJIA up 152 points to close at an all-time high of 22,557.60. The Nasdaq Composite added 20 points, to 6,516.72, whilst the S&P gained roughly 10 points, to 2,529.12, both also posting record closes. US equities rally was backed by strong manufacturing figures released early US session, with tech and gun-related equities among the best performers, and casino shares down after the Las Vegas massacre. Within the Dow, Intel Corp. was the best performer, up 2.39%, followed by General Electric that added 1.62%. Coca-Cola led decliners, down 0.48%, followed by Exxon Mobil that lost 0.43% amid falling oil prices. Dow's daily chart shows that the RSI indicator accelerated north, currently at 75, while the Momentum lags, consolidating anyway within bullish territory. Furthermore, the index continues developing above bullish moving averages, all of which favors further gains ahead. Shorter term, and according to the 4 hours chart, the index maintains its strong bullish bias, also advancing sharply beyond bullish moving averages, and while technical indicators remain within extreme overbought territory, anyway presenting upward slopes.
Support levels: 22,500 22,456 22,403
Resistance levels: 22,580 22,625 22,660
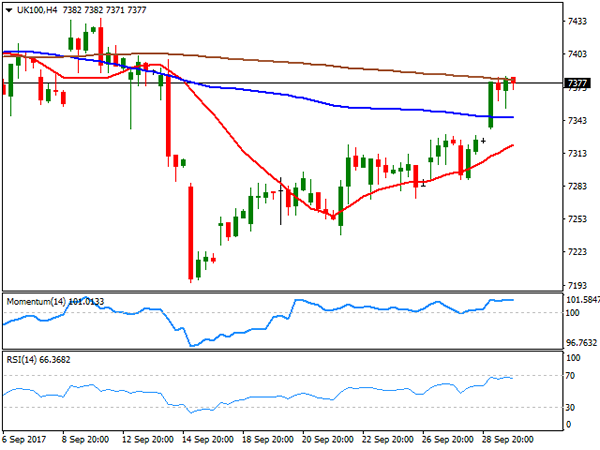
FTSE100
The FTSE 100 closed at 7,438.84, up 66 points or 0.90%, helped by a weakening Pound and strong gains in travel stocks, this last, on news that Monarch airline collapsed, opening market for its rivals. EasyJet led gainers, up 5.18%, followed by Barratt Developments that added 4.23%. Mediclinic International, on the other hand, led decliners, down by 1.08%. The strong intraday advance has took off the negative bias of the benchmark, which ended the day above its 100 DMA for the first time since September 12th. Additionally, and in the daily chart, technical indicators entered bullish territory, indicating that the advance may continue this Tuesday, particularly on a break above 7,441, the daily high and the immediate resistance. Shorter term, and according to the 4 hours chart, the index is also bullish, although technical indicators have lost upward strength after reaching overbought levels. Nevertheless, and in this last time frame, a bullish 20 SMA is crossing above the 100 SMA below the current level, reflecting the ongoing upward momentum and also supporting further gains ahead.
Support levels : 7,354 7,312 7,282
Resistance levels: 7,383 7,422 7,461
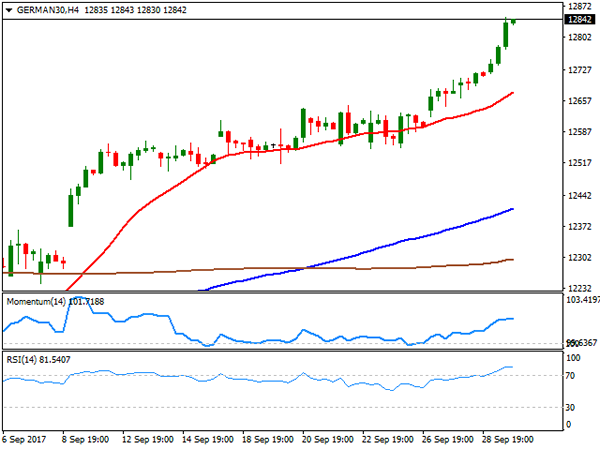
DAX
The German DAX advanced 74 points on Monday, to close the day at 12,902.65, with all European indexes closing in the green as the common currency fell. Also, backing the rally in German equities was the local Markit manufacturing PMI, confirmed at 60.6 in September, the strongest growth performance since early 2011. Most members were up within the benchmark, with Deutsche Lufthansa leading advancers, up 3.34%, as airline companies gained on news UK's Monarch airline declare its bankruptcy. Heidelberg Cement led decliners, down 1.35%, whilst banks also closed in the red, down by around 0.30% each. The index closed at its highest since June, when it posted an intraday record high of 12.953, and technical readings in the daily chart favor additional gains ahead, as technical indicators regained their upward strength, with the RSI indicator currently at 76, as the index moves further above bullish moving averages. In the 4 hours chart, technical readings also support a new leg higher, as the 20 SMA accelerated north below the current level, whilst technical indicators have turned flat after the close, within extreme overbought readings.
Support levels: 12,796 12,752 12,710
Resistance levels: 12,847 12,881 12,933
Robust DAX Pauses For German Holiday, Eurozone PPI Improves
The DAX is closed in the Tuesday session, as Germany celebrates Unity Day. The DAX started the week with gains, and closed the Monday session at 12,902.65, up 0.58% on the day. On the release front, the sole eurozone event, Producer Price Index, gained 0.3%, above the forecast of 0.1%. This marked the indicator's strongest gain since January. On Wednesday, the eurozone and Germany releases Final Services PMI, and ECB President Mario Draghi will speak at an event in Frankfurt.
The DAX continues its upward run, as the index has now posted winning sessions for six straight days, and is currently at its highest level since June 20th. US stock markets closed the Monday session with record highs, and the positive momentum has extended to European markets. There was good news on the inflation front, as Eurozone PPI beat expectations with a gain of 0.3 percent. Is eurozone inflation on its way up? If upcoming inflation indicators follow suit and point upwards, the ECB will have to revisit tightening its ultra-loose monetary policy. With the eurozone showing sustained growth in 2017, the cautious ECB will be reluctant to tighten policy, unless inflation moves higher. However, the ECB will have to make some important decisions, as the bank's current asset-purchase program is scheduled to terminate in December.
Catalonia, one of the richest regions in Spain, was a scene of chaos and violence over the weekend. The Catalan regional government attempted to hold a referendum on independence, but the national government was adamantly opposed to the move and banned the vote. When voters showed up at polling stations, the police moved in with force, injuring close to 900 civilians. Catalonian officials claimed that 90 percent of voters had voted for independence, setting the stage for a full-blown crisis with Madrid. The Spanish constitution prohibits any region from seceding, but Catalan Carles Puigdemont has not showed any intent to back down, and has called for a general strike on Tuesday. Although the euro lost ground on Monday, the crisis is not expected to continue to weigh on the currency, given that the referendum is viewed as an issue local to Spain, and not to the eurozone in general. As well, the Spanish economy is in good shape, so a constitutional crisis is unlikely to affect the country's economic growth.