Sample Category Title
EUR/USD Daily Outlook
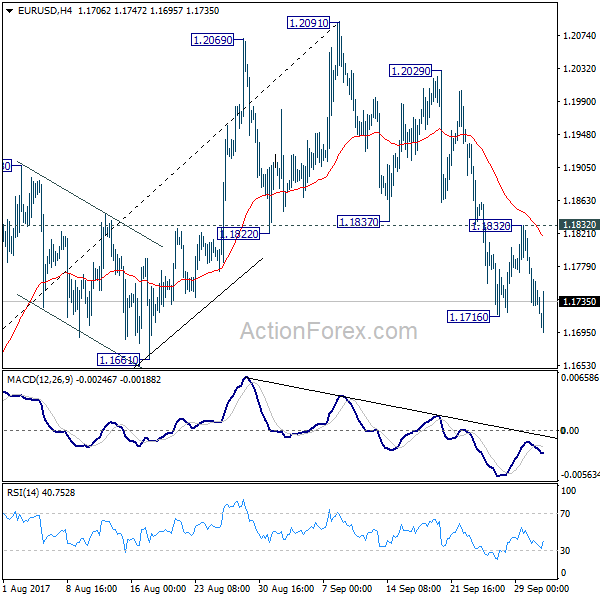
Daily Pivots: (S1) 1.1702; (P) 1.1758 (R1) 1.1788; More...
Break of 1.1716 suggests EUR/USD has resumed fall from 1.2091. Intraday bias is back on the downside for 1.1661 support first. Decline from 1.2091 is correcting whole rise from 1.0569. Deeper fall should be seen to 38.2% retracement of 1.0569 to 1.2091 at 1.1510, where we're expecting support to bring rebound. On the upside, break of 1.1832 minor support will suggest that the corrective fall is completed and turn bias back to the upside.
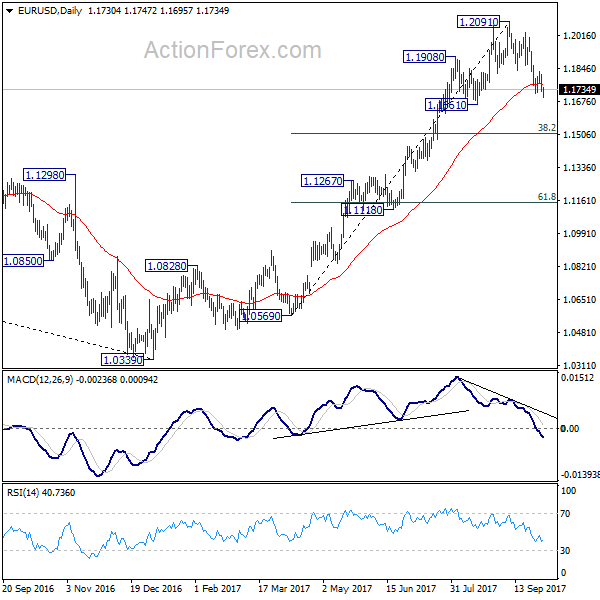
In the bigger picture, rise from medium term bottom at 1.0339 is not finished yet. It's expected to continue after pull back from 1.2091 completes. And, next target will be 38.2% retracement of 1.6039 (2008 high) to 1.0339 (2017 low) at 1.2516. However, it should be noted that there is no confirmation of trend reversal yet. That is, such rebound from 1.0399 could be a correction. And the long term fall from 1.6039 (2008 high) could resume. Hence, we'd be cautious on strong resistance from 1.2516 to limit upside.
GBP/USD Daily Outlook
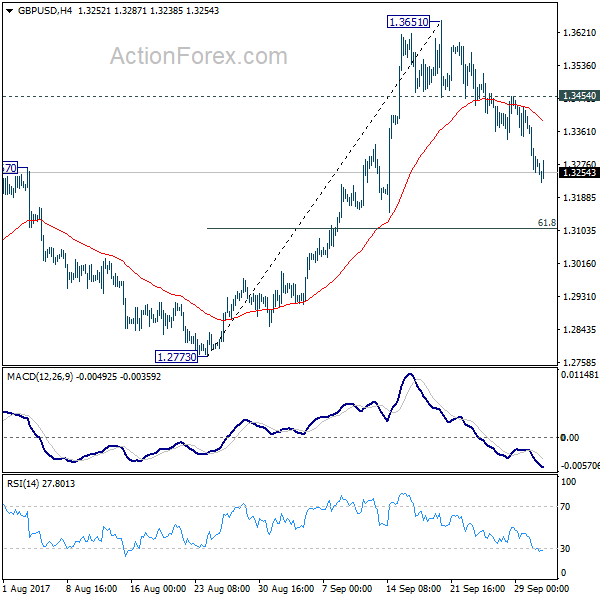
Daily Pivots: (S1) 1.3219; (P) 1.3310; (R1) 1.3366; More....
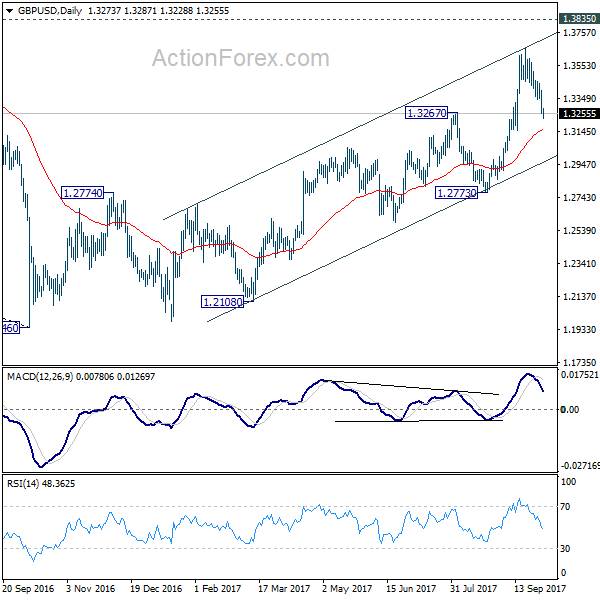
GBP/USD's fall from 1.3651 is still in progress and intraday bias remains on the downside. Current decline would extend to 61.8% retracement of 1.2773 to 1.3651 at 1.3108. On the upside, break of 1.3454 minor resistance is needed to signal completion of the decline. Otherwise, near term outlook remains mildly bearish in case of recovery.
In the bigger picture, current development argues that the long term trend in GBP/USD has reversed. That is, a key bottom was formed back in 1.1946 on bullish convergence condition in monthly MACD. Current rise from 1.1946 will target 38.2% retracement of 2.1161 (2007 high) to 1.1946 (2016 low) at 1.5466 next. In any case, medium term outlook will now stay bullish as long as 1.2773 support holds.
USD/CHF Daily Outlook
Daily Pivots: (S1) 0.9695; (P) 0.9725; (R1) 0.9778; More....
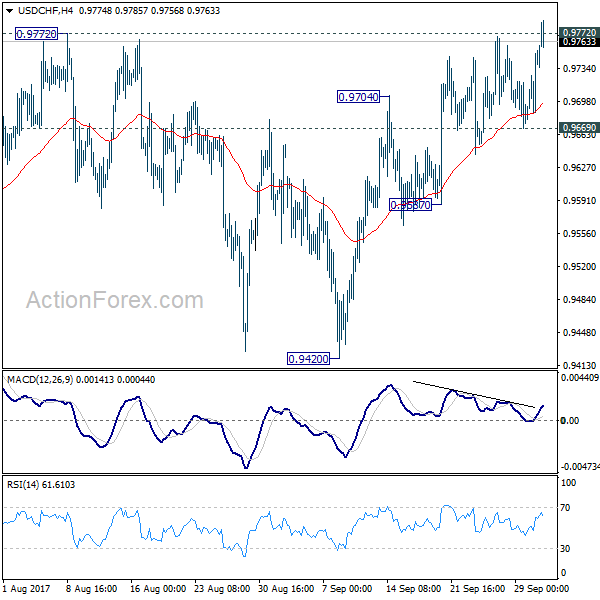
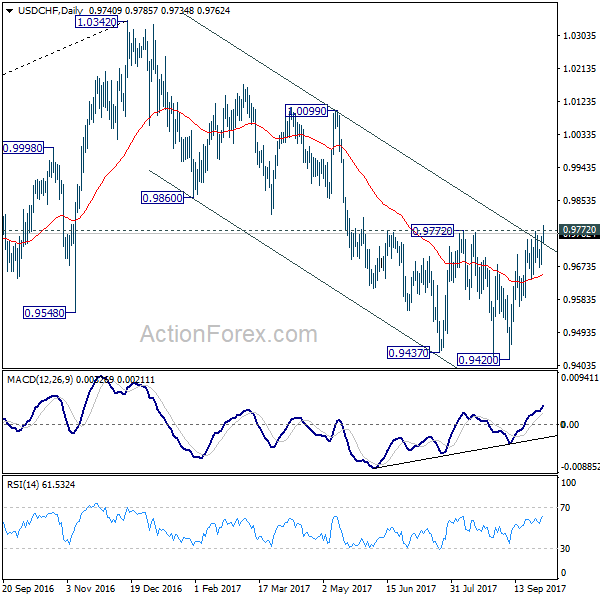
At this point, USD/CHF is still struggling to break through 0.9772 resistance decisively and intraday bias remains neutral first. On the upside, firm break of 0.9772 key resistance will suggest that whole down trend form 1.0342 has completed. In that case, near term outlook will be turned bullish for 0.9860/1.0099 resistance zone. However, break of 09669 minor support will suggest rejection from 09772 and turn bias back to the downside for 0.9587 support. Break will target retesting 0.9420 low.
In the bigger picture, focus remains on whether 0.9443 key support (2016 low) could be taken out firmly as down trend from 1.0342 extends. There are various interpretation of the price actions. But in any case, medium term outlook will stay bearish as long as 0.9772 resistance holds. Current down trend could extend to 38.2% retracement of 0.7065 (2011 low) to 1.0342 (2016 high) at 0.9090. However, break of 0.9772 will indicate that USD/CHF has successfully defended 0.9443 again and turn outlook bullish for 1.0099 resistance.
EUR/USD Analysis: Breaks 100% Fibonacci Retracement Level
Contrary to expectations, the currency pair broke through the combined support set up by the 100% Fibonacci retracement level at 1.1715 and the updated weekly S1 at 1.1710.
The reason behind such deep immersion was based on several reasons, such the Catalan referendum and a release of better than expected data on the US manufacturing activity.
There is a small chance that the Euro will manage to restore some positions against the Dollar.
However, the average market sentiment remains 58% bearish. In addition to that, now traders can rely on the above technical barriers, as a resistance to push the rate towards the 1.17 mark.
By the way, from the south the rate does not face any notable obstacles up until the monthly S1 at 1.1658.
GBP/USD Analysis: Reaches Bottom Edge Of Channel Down
A combination of release of worse than expected British and better than expected American manufacturing activity data created a downside momentum, which was strong enough to drive the pair through a combined support formed by the monthly PP at 1.3322 and the weekly S1 at 1.3305 and push right to the bottom edge of senior descending channel.
From daily perspective, the exchange rate has to continue to pave the way to the south. But in the short run it might make a rebound, as the above boundary is additionally secured by the weekly S2 at 1.3210. Plus there is a need to take into account that the 1.3200 mark represents a psychological support level and might be surrounded by many buy limit orders.
However, the UK Construction PMI data release might also leave certain impact on the pair.
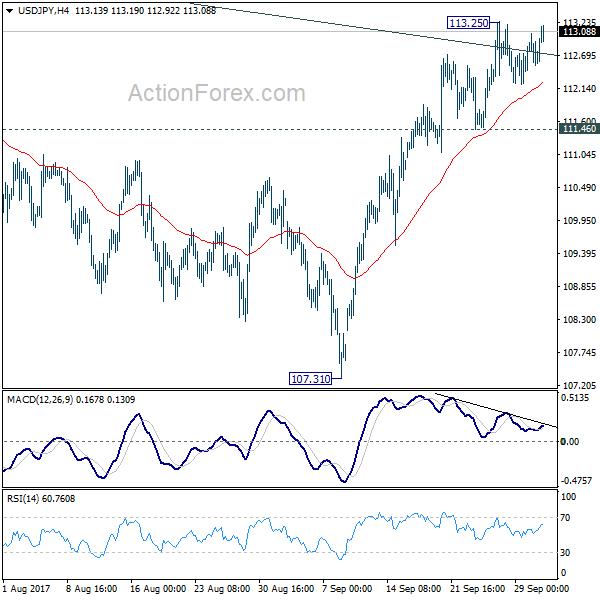
USD/JPY Analysis: Breaks From Junior Channel
In line with expectations, the Greenback continued to gain value against the Yen, breaking through the upper edge of a junior descending channel. The surge was mainly based on release of positive information on the US manufacturing activity.
However, a combination of the 55- and 100-hour SMAs located near the lower support line of a dominant ascending channel additionally supported the above-mentioned soar.
Because of the hawkish Fed outlook, anticipation of Trump's tax reform and other favourable fundamental background, the pair is expected to continue to head to the north.
However, there is a need to take into account that due to 48 pips advance just in three hours the Yen might force the pair to make a temporary rebound and restore some lost positions.
USD/JPY Daily Outlook
Daily Pivots: (S1) 112.42; (P) 112.74; (R1) 113.06; More...
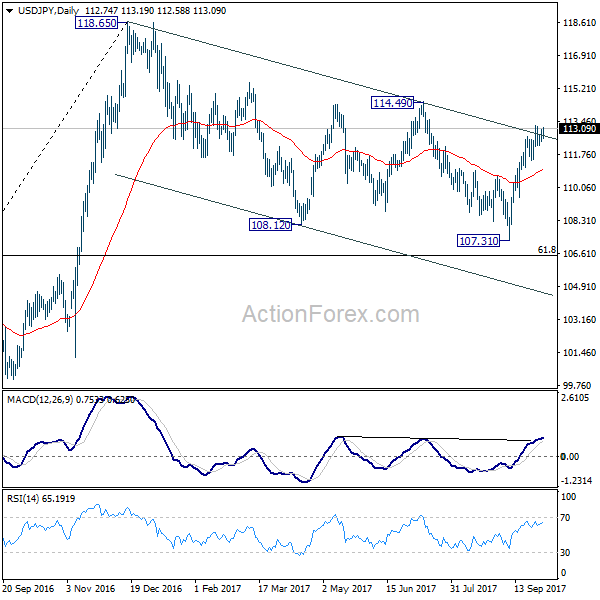
USD/JPY is staying in consolidative trading in tight range below 113.25 temporary top. Intraday bias remains neutral first. As long as 111.46 minor support holds, further rise is in favor. Sustained break of medium term channel resistance will argue that correction from 118.65 is already completed with three waves down to 107.31. Break of 114.49 will confirm this bullish case and target a test on 118.65 next. On the downside, considering bearish divergence condition in 4 hour MACD, break of 111.46 will suggest rejection from the channel resistance and turn bias back to the downside.
In the bigger picture, rise from 98.97 (2016 low) is seen as the second leg of the corrective pattern from 125.85 (2015 high). It's unclear whether this this second leg has completed at 118.65 or not. But medium term outlook will be mildly bearish as long as 114.49 resistance holds. And, there is prospect of breaking 98.97 ahead. Meanwhile, break of 114.49 will bring retest of 125.85 high. But even in that case, we don't expect a break there on first attempt.
XAUUSD Analysis: Ready To Test Weekly S1 At 1,266.63
In accordance with expectations, for couple of hours the fall of the exchange rate was stopped by the 100-day SMA. However, a release of better than expected information on the US manufacturing activity ultimately led to appreciation of the buck against all major currencies including the gold.
From technical perspective, the pair is about to reach to weekly S1 at 1,266.63, which represents the only notable support level that separates the pair from the bottom edge of a dominant ascending channel.
Given that informational background remains in favour of the buck and there are scheduled no macroeconomic data releases today, the pair is expected to successfully bypass this barrier and continue to move to the south.
However, there is a need to take into account that the average market sentiment became 59% bullish.
GBP/USD: UK Manufacturing PMI
The GBP/USD kept declining gradually after the weaker-than-anticipated Britain's manufacturing PMI figures. The Sterling fell against the US Dollar by 11 base points to rebound from the 1.3305 mark, but continued to consolidate nearing the 1.3280 area additionally fuelled by US economic report bullish sentiment for the Greenback.
Markit report showed on Monday that the UK Manufacturing PMI fell to 55.9 points in September, below initially anticipated 56.4 points. The decline in the Index was related to the strengthening of the British Pound, which made manufactured products less attractive to be purchased. Meanwhile, the pair partially lost its gains due to expectations for the BoE interest rate increase in November.
EUR/USD: ISM Manufacturing PMI
The Greenback sustained Monday's gains against the Euro, as ISM manufacturing data showed better-than-expected figures.The US Dollar rose slightly against the European single currency by 7 base points to keep its stronger position, with the pair falling further below the 1.1720 level this morning.
The ISM stated that its index for the US manufacturing activity surged to 60.8 points in September, reaching the highest level in more than 10 years. Solid advances in ISM-reported figures to a certain extent reflected affects from Hurricanes. The report also showed an increase in its exports measure as producers benefited from the Dollar's weakness, which made US supplies more attractive to overseas buyers.