Sample Category Title
EUR/USD: US Final GDP
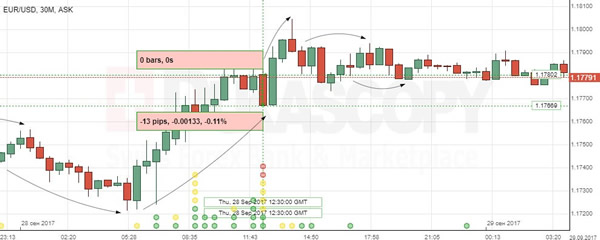
The EUR/USD fell slightly in the wake of Thursday's data showing the US economy expanded at a stronger-than-expected pace in the June quarter. Following the report, the European single currency depreciated against the US Dollar by 13 base points or 0.11%, though its losses were offset initially. The pair continued a side move nearing the 1.1780 level.
The Commerce Department said that the US economic growth in the second quarter was the quickest in more than two years, with a 3.1% annual increase in the reported period. However, growth momentum is expected to be slowed owing to the impact of Hurricanes Irma and Harvey. Analysts suggested anticipated weakness would be softened by rising inventory investment in the Q3.
EUR/JPY Elliott Wave Analysis
EUR/JPY - 132.75
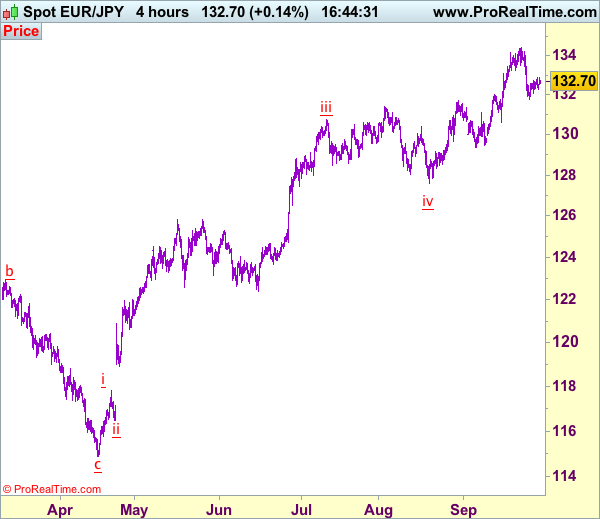
As the single currency found support at 131.75 and has rebounded, retaining our bullishness and consolidation with mild upside bias remains for another rebound to 133.40-50, then towards 134.00 but break of last week’s high of 134.41 is needed to confirm recent upmove has resumed and extend further gain to 135.00 but loss of upward momentum should prevent sharp move beyond 136.00-10 and reckon 136.95-00 would hold, price should falter well below 138.45-50 (1.618 times extension of 109.49-124.10 measuring from 114.85), risk has increased for a retreat to take place later.
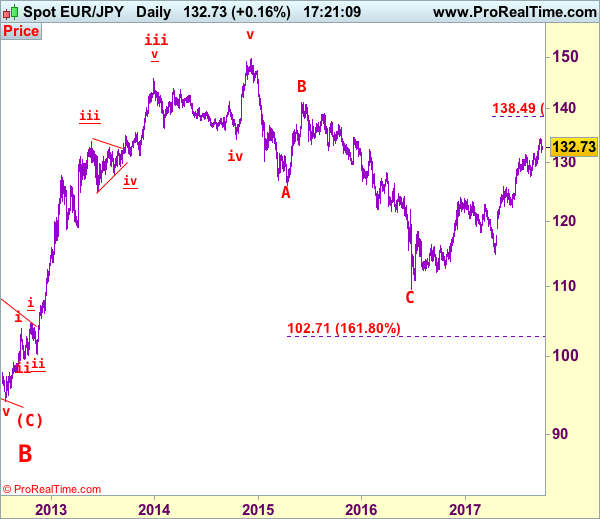
The daily chart is labeled as attached, early selloff from 169.97 (July 2008) to 112.08 is wave (A) of B instead of end of entire wave B and then the rebound from there to 139.26 is wave (B), hence, wave (C) has possibly ended at 94.12 with a diagonal triangle as labeled in the daily chart, hence upside bias is seen for further gain. Recent rally above indicated retracement level at 116.69 (50% Fibonacci retracement of the intermediate fall from 139.26-94.12) adds credence to this view and signal major reversal has commenced but first leg of this wave C has possibly ended at 149.79, hence wave 2 has commenced with wave A ended at 126.09, followed by wave B at 141.06, wave C commenced and could have ended at 109.49, indicated upside targets at 126.00 and 130.00 had been met and further gain to 135.00 would follow.
On the downside, below 132.25-30 would risk another test of said support at 131.75 but only break there would signal a temporary top is formed bring retracement of recent rise to 131.00 and possibly test of support at 130.62 but downside should be limited to 130.00 and strong support at 129.37 should remain intact, bring another upmove later.
Recommendation: Hold long entered at 132.70 for 135.00 with stop below 131.70.
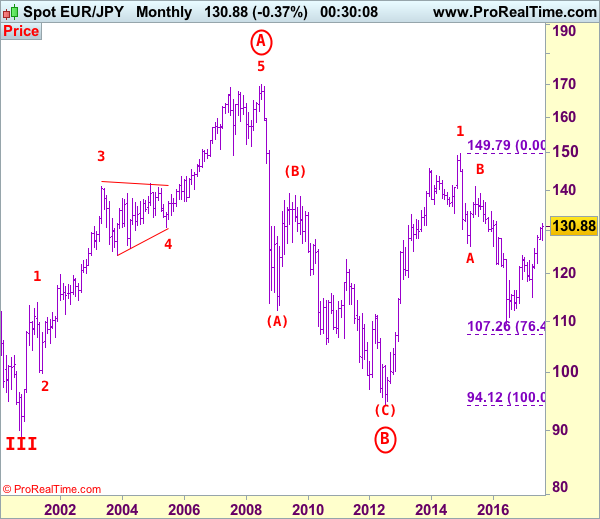
To re-cap the corrective upmove from the record low of 88.93 (18 Oct 2000), the wave A from there is subdivided as: 1:88.93-113.72, 2:99.88 (1 Jun 2001), 3:140.91 (30 May 2003), 4:124.17 (10 Nov 2003) and 5 ended at record high of 169.97 (21 Jul 2008). The brief but sharp selloff to 112.08 is viewed as a-b-c x a-b-c wave (A) of B. The subsequent rebound to 139.26 is (B) of B and (C) of (B) has possibly ended at 94.12 and in any case price should stay well above previous chart support at 88.93, bring rally in larger degree wave C towards 150.00.
USD/CHF Elliott Wave Analysis
USD/CHF – 0.9713
The greenback has edged higher again after brief pullback, retaining our view that low has possibly been formed at 0.9421 earlier this month, hence consolidation with upside bias remains for test of indicated resistance at 0.9770-74, however, a daily close above there is needed to add credence to this view and bring retracement of early decline to resistance at 0.9808, then test of previous support at 0.9859, having said that, near term overbought condition should limit upside to 0.9900 and price should falter well below psychological resistance at 1.0000, bring another decline later.
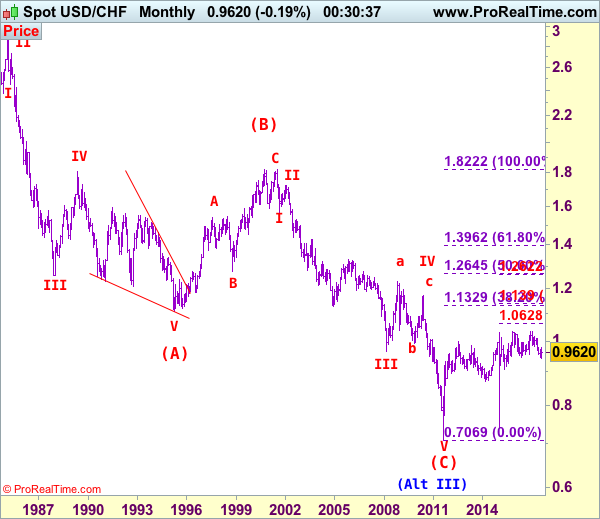
Our preferred count on the daily chart is that early selloff to 0.9630 is an end of the larger degree wave III and major correction is unfolding from there with a leg ended at 1.2298 (Nov 2008 with (a): 1.0625, (b):1.0011 and (c):1.2298), wave b ended at 0.9910 with (a): 1.0370, (b): 1.1967, (c): 0.9910. The rise from there to 1.1730 is the wave c which also marked the end of wave IV and wave V has possibly ended at 0.7068.
On the downside, whilst initial pullback to 0.9645-50 is likely, reckon downside would be limited to said support at 0.9565 and bring another rise later. Below 0.9525-30 would risk weakness to 0.9490-00 but still reckon downside would be limited to 0.9455-60 and said support at 0.9421 should remain intact, bring another rebound later. A drop below said support at 0.9421 would extend recent decline from 1.0344 top (formed back in late 2016) to 0.9350 and possibly 0.9300, however, loss of downward momentum should prevent sharp fall below 0.9250-60 and 0.9200-10 should hold.
Recommendation: Buy at 0.9575 for 0.9775 with stop below 0.9475.
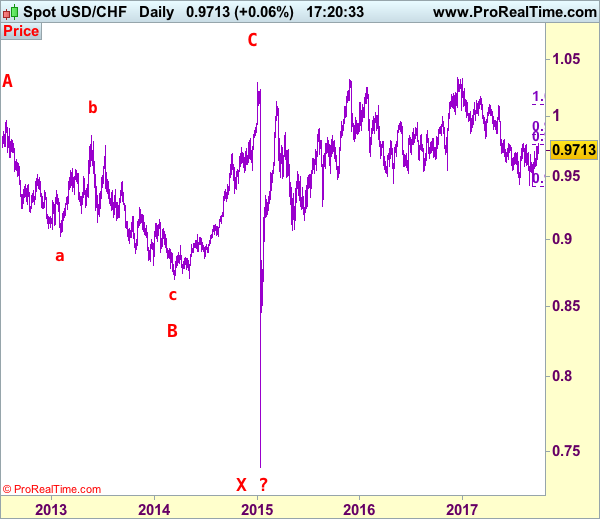
Dollar's long-term downtrend started from 2.9343 (Feb 1995) and it was unfolding as a (A)-(B)-(C) with (A): 1.1100, (B): 1.8310 (26 Oct 2000), then followed by another impulsive wave (C) with wave III ended at 0.9630 (Mar 2008). Under this count, correction in wave IV has possibly ended at 1.1730 and wave V already broke below support at 0.9630 and met indicated downside target at 0.7500 and 0.7400. The reversal from 0.7068 suggests the wave V has possibly ended and the breach of resistance at 0.9595 add credence to this view and indicated upside target at 1.0000 had been met, however, the sharp retreat from 1.0296 to 0.7401 suggests choppy trading would be seen but price should stay above said record low at 0.7068.
Dollar Steady As Uncertainties On Tax Reforms Weigh, Focus On Inflation
On Friday, currencies in Asia were in a quiet trade, with the dollar moving sideways near yesterday's lows as positive sentiment on Trump's tax proposals was fading and investors were less certain on whether those would pass in Congress. However, the focus during the day will be on the US inflation readings which might affect the Fed's views on future monetary policy if they come in as a surprise.
Although the US tax cuts proposed by the Trump administration raised confidence initially on the country's fiscal policy, investors were less certain in the days that followed after Trump's speech did not mention any details on how lower taxes would be funded and therefore increased fears that those might boost the nation's debt levels.
The dollar index was trading flat at 93.16 with investors being cautious ahead of PCE figures expected to be published during the European trading hours. Forecasts are for core the index – which is closely watched by the Fed – to remain steady at 1.4% y/y.
In Japan, inflation readings for the month of August rose as expected, while demand for labor remained the strongest in 43 years.
The national CPI figure was in line with forecasts, jumping by 0.3 percentage points to 0.7% y/y, while the core equivalent, which is closely watched by the BOJ, climbed from 0.5% to 0.7%. Despite this rise, the index is still far below the BOJ's inflation target of 2%, dampening any hopes for monetary stimulus reduction anytime soon.
The Japanese jobs to applications ratio remained flat at 1.52, below the forecast of 1.53. However, this was still one of the largest marks posted since 1974.
Initial estimates for Japanese Industrial production in August was a surprise to analysts, as industrial production grew by 2.1% compared to the 1.9% expected, following a decline of 0.8% in the previous month.
Dollar/yen climbed by 0.23% on the day to 112.58.
Euro/dollar was trading flat during the session around 1.1780 but managed to tick up to 1.1800 afterwards on the back of a weaker dollar. Next up, preliminary Eurozone inflation readings for the month of September are expected to show a moderate increase from 1.5% to 1.6%.
Pound/dollar edged down to 1.3415 despite both the Nationwide house price index and GfK consumer confidence coming in better than expected.
In other currencies, the aussie was in a downtrend, falling by 0.25% to $0.7837 mainly due to the dollar's strength, while the kiwi dropped by 0.26% to 0.7215 as political uncertainties continue to weigh on the currency.
Dollar/loonie stood flat at 1.2431 ahead of Canada's July's monthly GDP growth figures' release later today.
In energy markets, WTI crude retreated from the 5-month high of $52.86 reached on Thursday, falling by 0.37% to $51.37 per barrel. Brent decreased by 0.14% to $57.33, down from yesterday's high of $58.65.
GBPJPY Neutral In Short-Term, Potential For Downside Move
GBPJPY continues to trade in a narrow range and is expected to maintain a consolidation phase around the 151 level in the near-term. The uptrend that took place from the 140 area ran out of steam at 152.85 on September 21.
Trend indicators are neutral and showing a lack of clear direction on the 4-hour chart. RSI and MACD are flat, while the 20 and 50-period moving averages are horizontal.
GBPJPY is expected to trade sideways between 150 and 152.85 in the near term. A rise above the September 27 high of 151.60 would turn the focus to 152.85. Clearing this top would see a resumption of the medium-term uptrend with scope to target the next peak at 160.12.
The market is currently located inside the Ichimoku cloud and this does not bode well for the GBPJPY pair. Immediate risk is tilted to the downside unless prices rise back above the cloud. If key support at 150 is broken, then there would be increased pressure for a move lower towards further support at 148.35 and 146.65. More weakness would open the way towards the key 143 level.
GBPJPY is expected to remain neutral in the short term with risk building up for a move to the downside as the 20-period MA remains below the 50-period MA. The broader one-month uptrend from August 24 will likely change if prices fail to hold above the key 150-level.
Forex Technical Analysis: EUR/USD, USD/JPY, GBP/USD
EUR/USD
Current level - 1.1793
The rebound above 1.1715 should be considered corrective, preceding a slide towards 1.1660. Key resistance is projected at 1.1830.
| Resistance | Support | ||
| intraday | intraweek | intraday | intraweek |
| 1.1830 | 1.2070 | 1.1660 | 1.1660 |
| 1.2000 | 1.2240 | 1.1540 | 1.1480 |
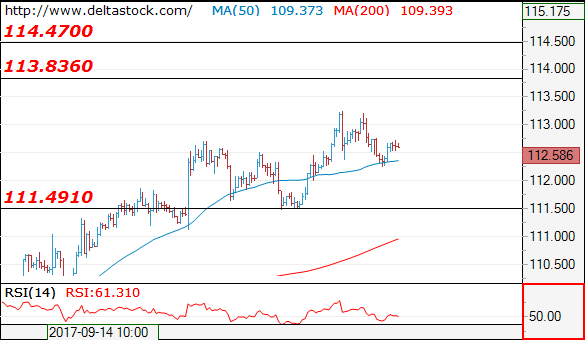
USD/JPY
Current level - 112.58
The overall outlook remains positive, for a rise towards 113.80. Crucial on the downside is 111.50.
| Resistance | Support | ||
| intraday | intraweek | intraday | intraweek |
| 113.30 | 113.80 | 112.00 | 111.50 |
| 113.80 | 114.50 | 111.50 | 107.30 |
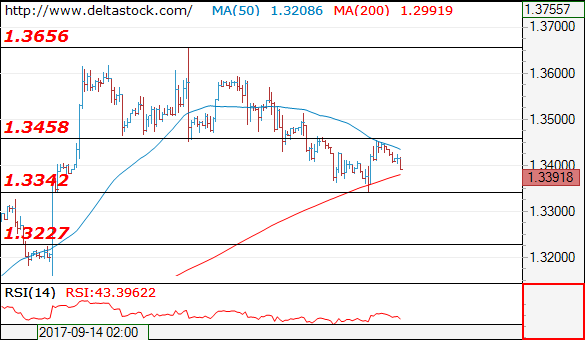
GBP/USD
Current level - 1.3391
The recent reversal at 1.3340 signals a finale of the slide from 1.3600, but current rebound should be considered corrective, preceding another leg downwards, to 1.3220 area. Initial intraday resistance lies at 1.3460.
| Resistance | Support | ||
| intraday | intraweek | intraday | intraweek |
| 1.3460 | 1.3650 | 1.3340 | 1.3340 |
| 1.3650 | 1.3830 | 1.3220 | 1.3150 |
Trade Idea: GBP/USD – Sell at 1.3500
GBP/USD – 1.3375
Original strategy :
Sell at 1.3460, Target:1.3300, Stop: 1.3520
Position: -
Target: -
Stop: -
New strategy :
Sell at 1.3500, Target:1.3300, Stop: 1.3560
Position: -
Target: -
Stop:-
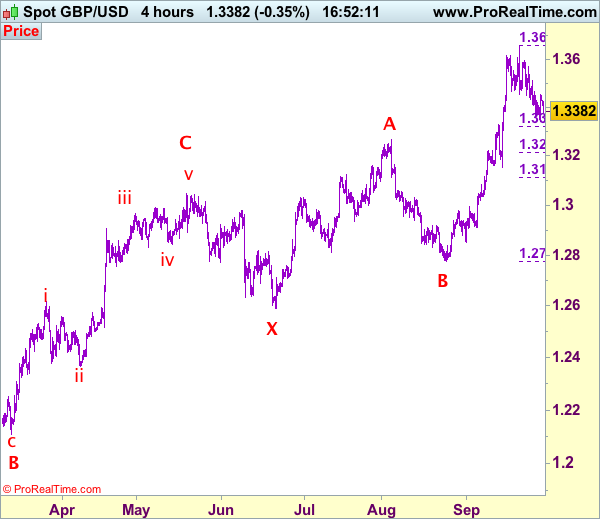
Although cable has retreated after meeting resistance at 1.3455, reckon support at 1.3343 would limit downside and risk of another rebound to said resistance cannot be ruled out, however, as a temporary top has been formed at 1.3658 is correct, upside would be limited to 1.3500 and bring another decline later, below said support at 1.3343 would add credence to this view, bring retracement of recent rise to 1.3300-10, having said that, near term oversold condition should limit downside to 1.3250 and reckon 1.3215-20 (50% Fibonacci retracement of 1.2774-1.3658) would hold from here, price should stay well above previous support at 1.3153, bring rebound later.
In view of this, we are looking to sell cable on recovery as 1.3500 should limit upside. Above resistance at 1.3514 would abort and signal the retreat from 1.3658 top has ended, risk a stronger rebound to resistance at 1.3571 but upside should still be limited to 1.3600 and price should falter well below recent high at 1.3658, bring another retreat later. Our preferred count is that (pls see the attached chart) the wave IV is unfolding as a complex double three (ABC-X-ABC) correction with 2nd wave B ended at 1.2774, hence 2nd wave C is unfolding and may extend further gain to 1.3650, then 1.3700, however, overbought condition should limit upside to 1.3770-75 and reckon 1.3800-10 would hold from here, bring retreat later.
Our preferred count on the daily chart is that cable's rebound from 1.3500 (wave (A) trough) is unfolding as a wave (B) with A ended at 1.7043, followed by triangle wave B and wave C as well as wave (B) has ended at 1.7192, the subsequent selloff is the larger degree wave (C) which is still unfolding with minor wave (III) of larger degree wave 3 ended at 1.1986, hence wave (IV) correction is in progress which could either be a triangle wave (IV) of a complex formation but upside should be limited to 1.3500 and price should falter well below 1.4000, bring another decline in wave (V) of 3 for weakness to 1.1500, then 1.1200.
Trade Idea: GBP/JPY – Sell at 151.00
GBP/JPY - 150.75
Original strategy:
Sold at 151.00, Target: 149.00, Stop: 151.60
Position: - Short at 151.00
Target: - 149.00
Stop: - 151.60
New strategy :
Hold short entered at 151.00, Target: 149.00, Stop: 151.60
Position: - Short at 151.00
Target: - 149.00
Stop:- 151.60
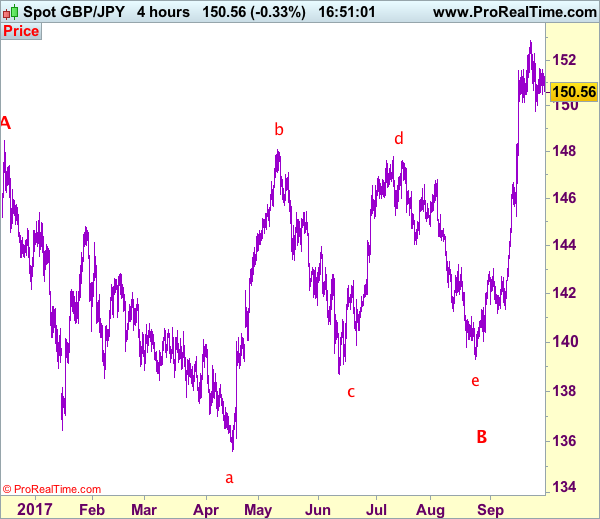
Although sterling recovered yesterday, as the pair has slipped again after faltering below indicated resistance at 151.60, retaining our near term bearish view for another test of 149.75 support but break there is needed to signal another leg of corrective decline from 152.85 top to bring retracement of recent rise to 148.90-00, however, only a drop below there would bring further fall to 148.50 and then 148.00 later.
In view of this, we are holding on to our short position entered at 151.00. Above said resistance at 151.60 would risk a stronger rebound to 152.00, however, still reckon upside would be limited to 152.25-30 and bring further consolidation. Above 152.50 would risk retest of said last week’s high at 152.85 but break there is needed to signal recent upmove has once again resumed and extend headway to 153.00-10 and possibly towards 153.50-60.
Our preferred count is that larger degree wave V with circle is unfolding from 251.12 with wave (I) 219.34, (II): 241.38 and wave (III) is subdivided into 1: 192.60, 2: 215.89 (23 Jul 2008) and wave 3 ended at 118.87 earlier in 2009. The correction from there to 162.60 is wave 4 which itself is a double three and is labeled as first a-b-c ended at 151.53, followed by wave x at 139.03, 2nd a ended at 162.60, 2nd b at 146.75 and 2nd c leg of wave 4 ended at 163.00. Therefore, the decline from 163.00 to 116.85 is now treated as wave 5 which also marked the end of larger degree wave (III), hence wave (IV) major correction has commenced for retracement of the wave (III) from 241.38 and upside target at 183.95-00 (50% Fibonacci retracement of the wave (II) from 241.38) had been met, a drop below 160.00 would suggest wave (IV) has ended at 195.85, bring decline in wave (V) for initial weakness to 130 (already met) and 120.
Elliott Wave Analysis: USD Index, GBPUSD And USDCAD
Regarding Dollar there is not enough price data to confirm any resumption lower on Dollar index, there still can be a fifth wave coming to completed wave C) or 3) near 94.00. However, there are some pairs that already show a potential turning point in the making. GBPUSD and USDCAD looks quite interesting. However, break above 1.3450/64 is still needed on cable to confirm bullish price move, while USDCAD needs a broken channel line near 1.2350 to confirm a bearish continuation.
USD Index, 1H
GBPUSD, 1H
USDCAD, 1H
Trade Idea: EUR/JPY – Sell at 133.25
EUR/JPY - 132.67
Original strategy:
Sell at 133.25, Target: 131.75, Stop: 133.85
Position: -
Target: -
Stop: -
New strategy :
Sell at 133.25, Target: 131.75, Stop: 133.85
Position: -
Target: -
Stop:-
As the single currency staged a rebound after finding support at 131.75 earlier this week, suggesting consolidation above this level would be seen and corrective bounce to 133.00 cannot be ruled out, however, if our view that top has been formed at 134.41 is correct, upside would be limited to 133.25-35 and bring another decline later, below said support at 131.75 would extend the fall from 134.41 to 131.50, then 131.00-05, break there would bring retracement of recent upmove towards support at 130.62 which is likely to hold from here.
In view of this, we are looking to sell euro on further subsequent recovery as 133.25-35 should limit upside. Above previous support at 133.43 would abort and suggest at least first leg of decline from 134.41 has ended, bring a stronger rebound to 133.90-00 but still reckon said resistance at 134.41 would remain intact, bring further consolidation.
Our latest preferred count is that wave (ii) is ABC-X-ABC which ended at 123.33 and wave (iii) is unfolding with wave iii ended at 100.77, followed by wave iv at 111.57 and wave v as well as the wave (iii) has ended at 97.04, followed by wave (iv) at 111.43 and wave (v) has ended at 94.12 which is also the end of the larger degree v, this also implied the major wave (C) has also ended there, hence major correction has commenced from there with (A) leg unfolding in its lower degree wave c which has possibly ended at 145.69. Under this count, A-B-C wave (B) has commenced with A leg ended at 136.23, wave B at 143.79 and wave C has possibly ended at 149.79.
Our larger degree count is that the decline from 139.26 is wave (C) and is sub-divided into a diagonal triangle i-ii-iii-iv-v with wave i - 105.44, wave ii- 123.33, wave iii - 97.03, wave iv - 111.43, followed by the final wave v as well as the end of wave (C) at 94.12, this also mark the bottom of larger degree wave B. Under this count, major rise in wave C has commenced as an impulsive wave with minor wave III ended at 145.69, wave V is still in progress for further gain to 150.00. Having said that, this so-called wave V could well be the first leg of larger degree 5-waver wave C and this wave C should bring at least a retest of wave A top at 169.97 (July 2008).