
Sample Category Title
Trade Idea: AUD/USD – Sell at 0.7940
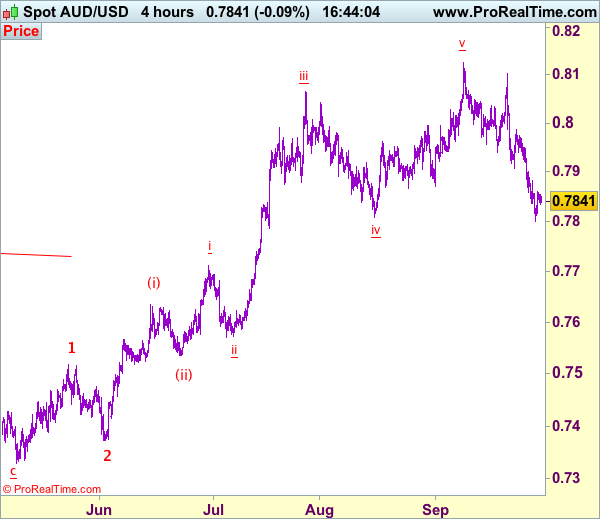
AUD/USD – 0.7838
Original strategy:
Sell at 0.7940, Target: 0.7740, Stop: 0.8000
Position: -
Target: -
Stop:-
New strategy :
Sell at 0.7940, Target: 0.7740, Stop: 0.8000
Position: -
Target: -
Stop:-
As aussie recovered after falling to 0.7799 yesterday. suggesting minor consolidation above this level would be seen and corrective bounce to 0.7880 and then 0.7900-10 cannot be ruled out, however, reckon 0.7940-50 would limit upside and bearishness remains for the decline from 0.8125 top to bring retracement of early upmove towards 0.7740-50, however, oversold condition should limit downside and reckon 0.7700 would hold, bring rebound later.
In view of this, we are looking to sell aussie again on recovery as 0.7940-50 should limit upside and bring another decline. Above resistance at 0.7986 would defer and suggest a temporary low is formed instead, bring a stronger rebound to 0.8000 but price should falter below 0.8040-50, bring another decline later.
On the 4-hour chart, recent upmove from 0.7329 is unfolding as an impulsive rise with wave 3 as well as smaller degree wave (iii) extending, only minor wave v of (iii) has ended at 0.8125, hence bullishness remains for this move to extend headway to 0.8200, then towards 0.8300, however, reckon upside would be limited to 0.8400 and the final wave 5 should falter below 0.8500, bring correction later.
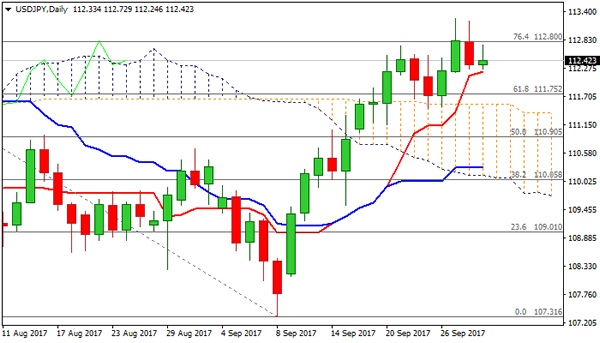
Technical Outlook: USDJPY – Golden Cross And Daily Cloud Continue To Underpin Near-Term Action
The pair is holding bullish stance as Thursday's pullback was contained by rising daily Tenkan-sen (112.20) and action remains also underpinned by 10/200 Golden cross (112.00). Bulls look for close above dented 112.80 target to confirm bullish continuation through Thu/Wed peaks at 113.20/25) towards targets at 113.57/114.00 and possible extension towards key barrier at 114.49 (11 July high. Downside should be ideally protected by rising Tenkan-sen , but extended dips towards daily cloud top (111.54) cannot be ruled out. Daily cloud continues to underpin the action after the price surged through the cloud and downside attempts being repeatedly contained by cloud top. The pair is also on track for the third straight bullish weekly close and above weekly cloud that supports broader bullish structure.
Res: 112.80; 113.25; 113.57; 113.68
Sup: 112.00; 112.00; 111.54; 111.36
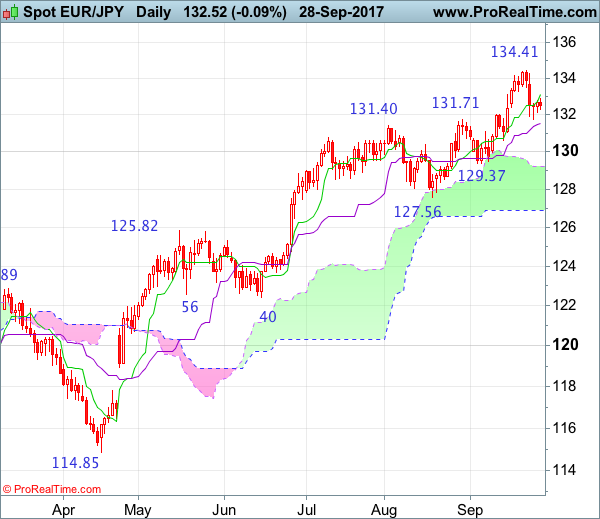
EUR/JPY Candlesticks and Ichimoku Analysis
Weekly
• Last Candlesticks pattern: Window
• Time of formation: 24 April 2017
• Trend bias: Up
Daily
• Last Candlesticks pattern: Hammer
• Time of formation: 18 May 2017
• Trend bias: Up
EUR/JPY – 132.73
Although the single currency extended recent rise to as high as 134.41 late last week, lack of follow through buying and the subsequent retreat suggests 1-2 weeks of consolidation below this level would be seen, hence near term downside risk is for test of the Kijun-Sen (now at 131.54), however, a daily close below there is needed to signal a temporary top is possibly formed, bring retracement of recent rise to previous support at 130.62 and then towards psychological level at 130.00 but price should stay well above another previous support at 129.37, bring rebound later.
On the upside, whilst recovery to the Tenkan-Sen (now at 133.08) cannot be ruled out, reckon upside would be limited to 133.50-60 and 134.00 should hold, bring another retreat later. Only a break of said resistance at 134.41 would revive bullishness and signal recent upmove is still in progress and may extend further gain to 135.00, however, overbought condition should limit upside to 136.00-10 and reckon 136.90-00 would hold from here, price should falter well below 138.45-50 (1.618 times extension of 109.49-124.10 measuring from 114.85), risk from there has increased for a much-needed correction to take place later.
Recommendation: Exit long entered at 132.50 and stand aside for now.
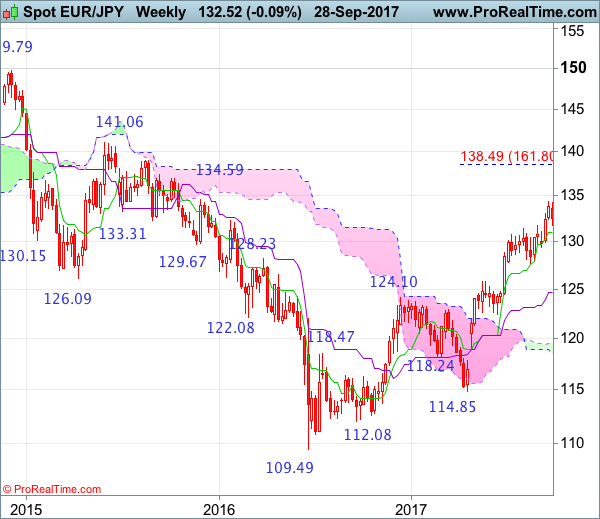
On the weekly chart, despite last week’s rise to 134.41, the subsequent retreat suggests minor consolidation below this level would be seen and below 131.75 support would bring test of the Tenkan-Sen (now at 130.99) but a drop below this level is needed to suggest a temporary top is possibly formed, bring weakness to 129.95-00, however, only a break below 129.37 support would add credence to this view and signal retracement of recent upmove has commenced, hence downside risk is for further weakness to 128.90-00, then towards 128.00-10 but previous support at 127.56 should remain intact.
On the upside, expect recovery to be limited to 133.60-65 and price should falter below said resistance at 134.41, bring retreat later. A break of said resistance would signal recent upmove from 109.49 (2016 low) has once again resumed and extend gain to 135.00, then 136.00-10, however, reckon upside would be limited and 136.95-00 should hold, price should fatter below 138.45-50 (1.618 times extension of 109.49-124.10 measuring from 114.85), bring retreat later.
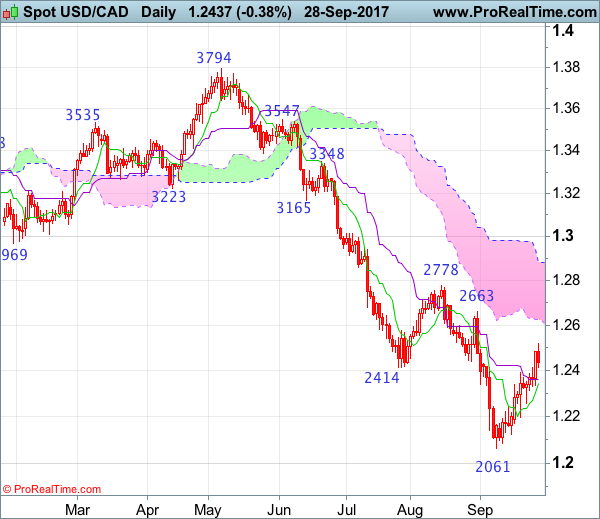
USD/CAD Candlesticks and Ichimoku Analysis
Weekly
• Last Candlesticks pattern: Shooting doji
• Time of formation: 01 May 2017
• Trend bias: Sideways
Daily
• Last Candlesticks pattern: Bearish engulfing
• Time of formation: 5 May 2017
• Trend bias: Down
USD/CAD – 1.2425
As the greenback staged a strong rebound after finding good support at 1.2198 last week, suggesting a temporary low has possibly been formed at 1.2061 earlier this month and consolidation with mild upside bias is seen for this move to bring retracement of recent decline, hence gain to 1.2515-20 and possibly towards the lower Kumo (now at 1.2624), however, reckon resistance at 1.2663 would limit upside and price should falter well below resistance at 1.2778, bring another decline later.
On the downside, whilst initial pullback to 1.2400 and then the Tenkan-Sen (now at 1.2345) cannot be ruled out, reckon downside would be limited to 1.2280-85 and renewed buying interest should emerge above said support at 1.2198, bring another rebound later. A daily close below 1.2198 would risk weakness to 1.2121 but break there is needed to abort and signal the rebound from 1.2061 has ended, bring further fall towards said recent low at 1.2061. Looking ahead, below 1.2061would extend downtrend to psychological level at 1.2000, having said that, loss of momentum should prevent sharp fall below 1.1920-25 (61.8% projection) and 1.1900 should hold.
Recommendation: Turn long at 1.2200 for 1.2400 with stop below 1.2100
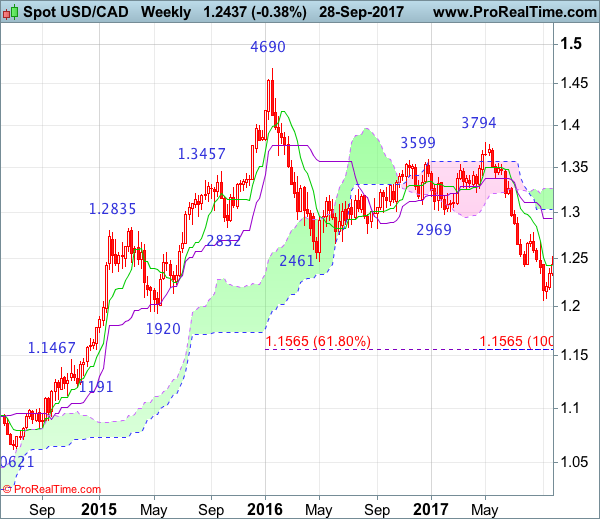
On the weekly chart, the greenback has continued edging higher after rebounding from 1.2061, third consecutive white candlestick looks set to be formed this week, suggesting a temporary low has possibly been formed at 1.2061 and consolidation with mild upside bias is seen for retracement of recent decline, hence gain to 1.2550, then 1.2600 would be seen, however, reckon previous resistance at 1.2663 would limit upside and 1.2700-10 should hold, price should falter below previous resistance at 1.2778, bring another decline later in Q4.
On the downside, expect pullback to be limited to 1.2350-60 and 1.2280-85 should hold, renewed buying interest should emerge around support at 1.2198, bring another rebound later to aforesaid retracement targets. Below 1.2121 support would abort and signal the rebound from this month’s low at 1.2061 has ended, bring retest o this level later. A drop below 1.2061 would confirm decline from 1.3794 top has resumed and extend weakness towards psychological support at 1.2000, however, reckon downside would be limited to 1.1920-25 (61.8% projection of 1.3794-1.2414 measuring from 1.2778) and reckon 1.1840-50 would hold from here, price should stay above 1.1750-60, bring rebound later.
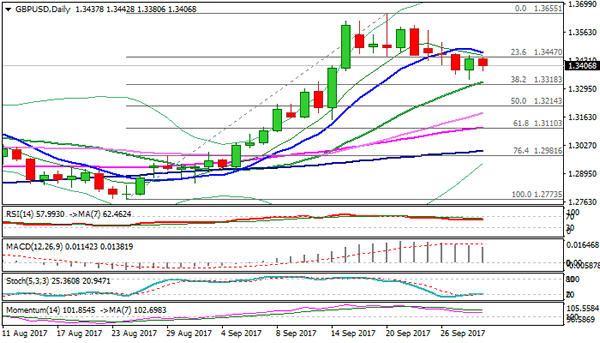
Technical Outlook: GBPUSD – UK GDP And C/A Data In Focus For Fresh Signals
Cable is holding in red in early Friday's trading and signaling that Thursday's recovery from fresh two-week low at 1.3342 may be over.
Recovery rally failed to break above thick hourly cloud on Thursday and subsequent easing probes below the cloud, increasing downside pressure.
Broken falling weekly 100SMA (1.3363) is holding dips for now and weekly close below it would generate bearish signal for extension of pullback from 1.3655 peak.
The pair is on track for the second consecutive bearish weekly close below weekly cloud top (1.3473) which would reinforce bearish stance.
Focus today is on UK data, with key releases, Q2 GDP (q/q 0.3% f/c unchanged from Q1 and y/y 1.7% f/c also unchanged from Q1) and Q2 Current Account (gap is forecasted to narrow to 15.8B from 16.9B in Q1).
Better than expected numbers would support sterling and sideline immediate downside risk, while weaker than forecasted figures would put the pair under increased pressure and risk fresh bearish acceleration through next pivots at 1.3320/18 (rising 20SMA / Fibo 38.2% of 1.2773/1.3655 ascend).
Res: 1.3455, 1.3473, 1.3514, 1.3570
Sup: 1.3380, 1.3342, 1.3318, 1.3224
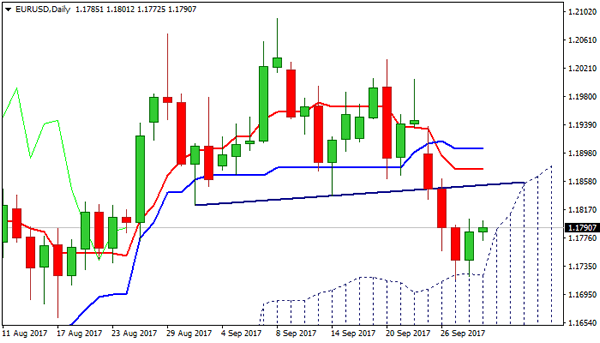
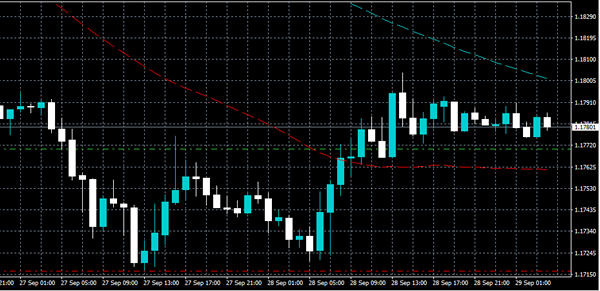
Technical Outlook: EURUSD – Attempts To Extend Recovery Above Daily Cloud But Downside Is Still At Risk
The Euro is standing at the front foot in early Friday and attempts to extend recovery rally from the previous day, on break above initial barriers at 1.1800 zone (Thursday’s high / 55SMA).
Strong fall which commenced on Monday, after German election results put the single currency under pressure, was contained by the top of thick daily cloud (cloud is spanned between 1.1724 and 1.1530).
Strong support at 1.1720 zone (also Fibo 38.2% of 1.1118/1.2092 ascend) was seen as ideal reversal point of the pullback from 1.2092 peak, as rising thick daily cloud continues to underpin.
Slow stochastic is reversing from oversold territory and supporting scenario.
Extension of recovery on profit-taking after three-day fall needs to clear sideways-moving daily Tenkan-sen / Kijun-sen (1.1875/1.1904 respectively) to confirm higher low and shift near-term focus higher.
Otherwise, limited recovery action would keep the downside at risk, with close below 55SMA to keep negative near-term tone in play and penetration into daily cloud to signal further weakness towards supports at 1.1662 (17 Aug trough) and 1.1605 (50% retracement of 1.1118/1.2092).
The pair is on track for weekly close in red, as well as negative end of the month which could signal further correction of broader uptrend from 1.0340 (2017 low).
Res: 1.1804, 1.1816, 1.1853, 1.1875
Sup: 1.1772, 1.1720, 1.1662, 1.1605
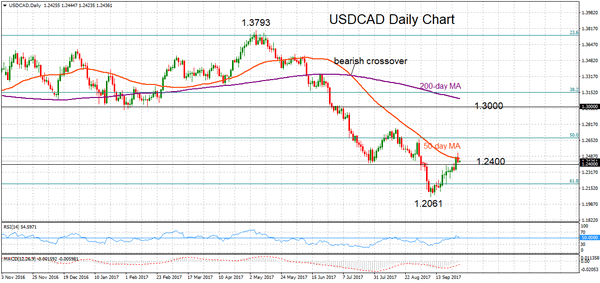
USDCAD Holds Broader Bearish Trend, Recent Bullish Phase At Risk Of Reversing
USDCAD maintains a bearish picture in the medium term with a steady downtrend from the May 5 high of 1.3793. The short-term bullish phase from 1.2061 stalled at 1.2518 yesterday after prices found resistance at the 50-day moving average and consequently closed below it.
The RSI has been moving sideways during today’s trading which might be an indication that upside momentum has weakened, though it is too early to conclude in that direction – further evidence is needed. Immediate support is expected at the key 1.2400 level which has acted as strong resistance recently. Despite pushing above this level earlier this week, USDCAD was unable to sustain gains and could be forming a lower top at 1.2518. The market has been making lower highs and lower lows since declining from 1.3793.
Should the market move below key support at 1.2400, downside pressure could increase with USDCAD seeing a re-test of the 1.2061 low. Pushing below this trough would strengthen the medium-term downtrend and target the next low at 1.1919. From here, more weakness in the market would set USDCAD on a path towards the 1.1500 area.
The market would have to rise above 1.3000 to indicate the bearish phase has ended. Trend indicators are painting a bearish picture, after the 50-day MA crossed below the 200-day MA in July. This negative alignment highlights the bearish medium-term bias for USDCAD but in the short-term, downside scope may be limited at the moment as momentum oscillators lack clear direction. Near-term consolidation is possible with risk tilted to the downside.
US Dollar Remains Supported Above 112.20 Vs Japanese Yen
Key Highlights
- The US Dollar is following a nice uptrend and is currently trading above 112.00 against the Japanese Yen.
- There is a major bullish trend line forming with support at 112.30 on the 4-hours chart of USD/JPY.
- Japan's National Consumer Price Index in August 2017 posted an increase of 0.7% (YoY), more than the last +0.4%.
- Japan's Industrial Production rose 5.4% (Prelim) in August 2017, more than the forecast of +5.2%.
USDJPY Technical Analysis
The US Dollar started a solid uptrend in Sep 2017 and moved above the 110.00 and 112.00 resistance levels against the Japanese Yen. The USD/JPY pair remains in an uptrend and eyeing further upsides above 113.00.
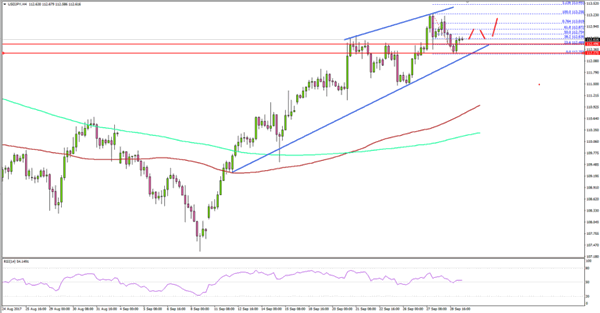
Looking at the 4-hours chart of USD/JPY, there is a major bullish trend line forming with support at 112.30. The pair recently corrected from the 113.25 high and tested the 112.20 support area.
The mentioned 112.20 support acted as a key buy zone and as a result, the pair is currently moving higher. It has already breached the 23.6% Fib retracement level of the last decline from the 113.25 high to 112.25 low.
On the upside, an initial resistance is near 112.75 and the 50% Fib retracement level of the last decline from the 113.25 high to 112.25 low. Above 112.75, the pair might look to extend gains above the 113.00 handle.
Japan's CPI and industrial Production
Today, Japan saw a few major economic releases for August 2017, including the National CPI, Tokyo's CPI and the Industrial Production figure.
The National Consumer Price Index for August 2017 was released by the Statistics Bureau. The forecast was slated for a rise of 0.7% compared with the same month a year ago, and more than the last +0.4%.
The result was in line with the forecast, as the CPI rose 0.7%. The National Consumer Price Index Ex Food and energy increased 0.2% (YoY), more than the last +0.1%.
The Japanese Industrial Production for August 2017 (Prelim) was released by the Ministry of Economy, Trade and Industry. The forecast was slated for a 5.2% rise compared with the same month a year ago.
The actual result was above the forecast, as there was an increase of 5.4% in the production. It was a lot higher compared with the last +4.7%.
The overall result was positive, but the USD/JPY pair might continue to gain upward momentum as long as it is above 112.00.
GBPUSD Bullis Above 1.3400
The British pound has moved back above the 1.3400 level against the U.S dollar, provoked by the U.S dollar index retreating back towards the 93.00 mark, and investor's worries over the lack of details from the Trump administrations proposed tax reforms.
Today's trading sentiment surrounding the GBPUSD pair is largely neutral, with the pair currently awaiting key second quarter gross domestic figures from the United Kingdom later today.
Yesterday the GBPUSD pair quickly recovered, after briefly falling below its 200-week moving average and hitting a two-week trading low, at 1.3342.
During the U.S session, the intraday rally above 1.3400 was capped by the 61.8% Fibonacci retracement of 1.3146 low to the 1.3653 high, at 1.3443.
Key technical support is found at the pairs daily pivot point, at 1.3413 and the key 1.3400 level. Once below the 1.3400 level, critical weekly support is found at 1.3380 and the pairs 200-week moving average, at 1.3363.
To the upside, the 1.3443 level remains the key to further GBPUSD upside today. Key technical resistance above 1.3443 is found at the pairs 200-hour moving average at 1.3483, and ascending channel-top, at 1.3504.
.
Euro Consolidates Ahead Of Rick Events
The EURUSD pair is currently consolidating around the 1.1770 region, as traders remain cautious ahead key eurozone core inflation data and a key-note speech by ECB President Mario Draghi later today.
Over the weekend, traders look to the results of the Catalan election, which is another key political risk-event for the euro currency. The EURUSD pair is expected to be well contained ahead of outcome.
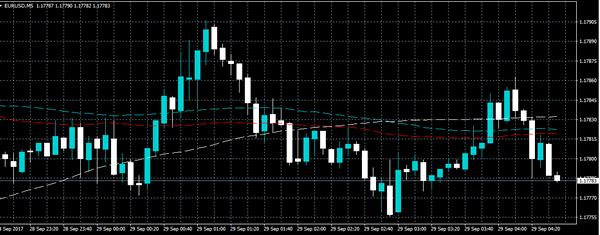
Yesterday the euro failed to gain momentum above the 1.1800 handle, with price-action further rejected at the 1.1804 resistance level during the U.S session.
From a technical perspective, the boundaries for the EURUSD pair are now clearly drawn, with further upside expected above 1.1804, while losses are expected below the 1.1760 support level.
Key intraday technical resistance is located at 1.1804, 1.1832 and 1.1857. Once above the 1.1857 level, further bullishness may be seen towards 1.1879 and 1.1910.
To the downside, key intraday support is found at euro's pairs daily pivot point, at 1.1770 and the key 50-hour moving average, at 1.1760. Below 1.1760, further support is found at 1.1730 and 1.1716