Sample Category Title
AUD/USD Weekly Outlook
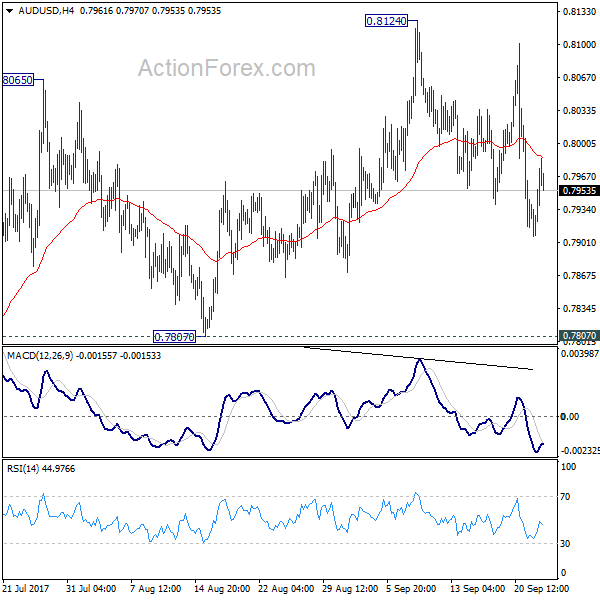
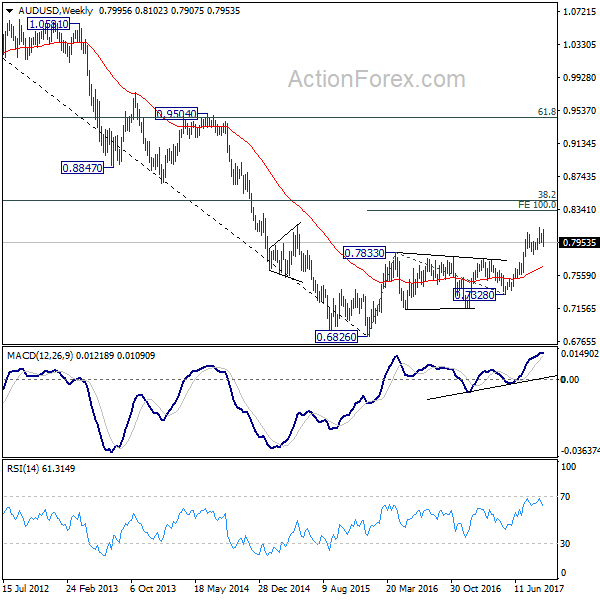
AUD/USD stayed in consolidation pattern from 0.8124 last week and outlook is unchanged. Initial bias remains neutral this week first. With 0.7807 support intact, outlook stays bullish for another rally. Above 0.8124 will target 100% projection of 0.6826 to 0.7833 from 0.7328 at 0.8335 next. However, considering bearish divergence condition in daily MACD, firm break of 0.7807 will indicate near term reversal and turn bias back to the downside for 0.7328 key support.
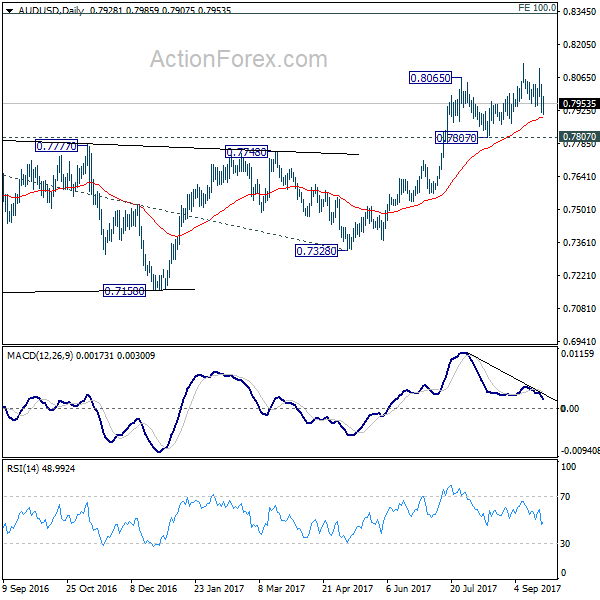
In the bigger picture, rise from 0.6826 medium term bottom is still in progress. At this point, there is no confirmation of trend reversal yet and we'll continue to treat such rebound as a corrective pattern. But in any case, break of 55 month EMA (now at 0.8090) will target 38.2% retracement of 1.1079 to 0.6826 at 0.8451. Break of 0.7807 support is needed to to be the first sign of completion of the rebound. Otherwise, further rise is now in favor.
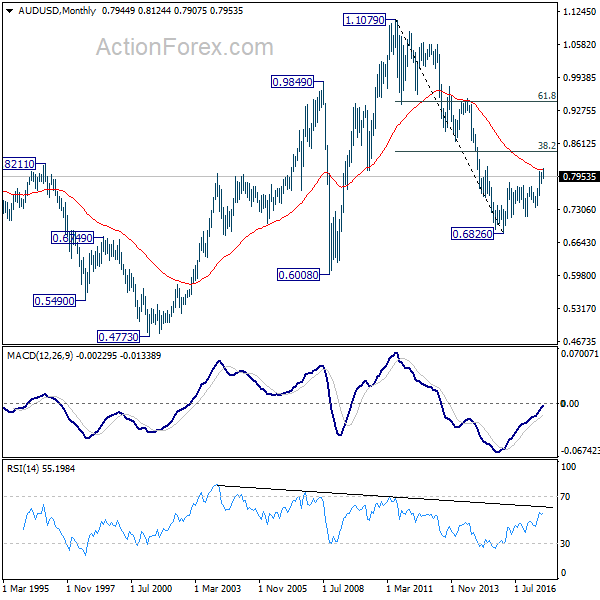
In the longer term picture, 0.6826 is seen as a long term bottom. Rise from there could either reverse the down trend from 1.1079, or just develop into a corrective pattern. At this point, we're favoring the latter. And, as long as 38.2% retracement of 1.1079 to 0.6826 at 0.8451 holds, we'd anticipate another decline through 0.6826 at a later stage.
USD/CAD Weekly Outlook
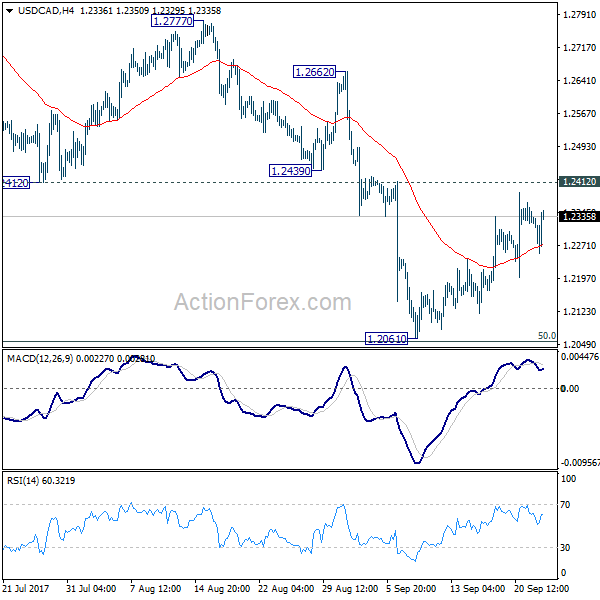
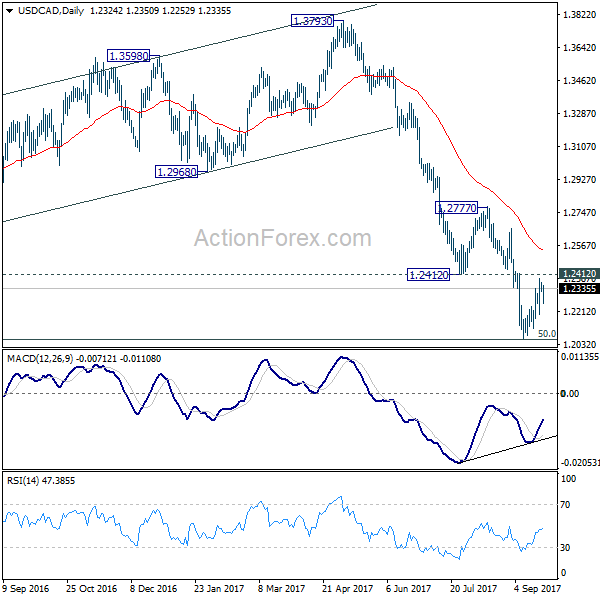
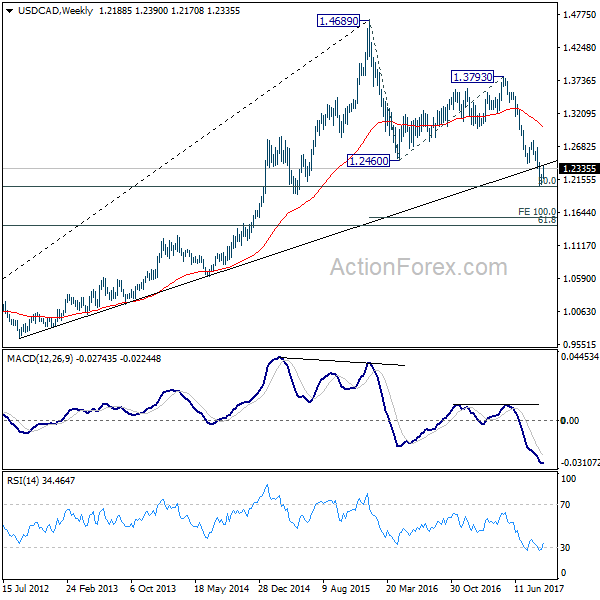
USD/CAD edged higher last week and consolidation from 1.2061 extended. Overall outlook is unchanged though. Initial bias remains neutral this week first. We'd remain cautious on strong support from 1.2048 to bring sustainable rebound. But still, break of 1.2439 support turned resistance is needed to be the first sign of trend reversal. Otherwise, outlook will remain bearish. Firm break of 1.2048 will pave the way to next fibonacci level at 1.1424. Break of 1.2412 will bring stronger rise back to 55 day EMA (now at 1.2538) and above.
In the bigger picture, focus remains on 50% retracement of 0.9406 to 1.4869 at 1.2048. As long as this level holds, we'd still favor that case that fall from 1.4689 is a correction. Rebound from 1.2048 could extend the larger up trend from 0.9406. However, firm break of 1.2048 will indicate that fall from 1.4689 is at least a medium term down trend and should target 61.8% retracement at 1.1424 and below.
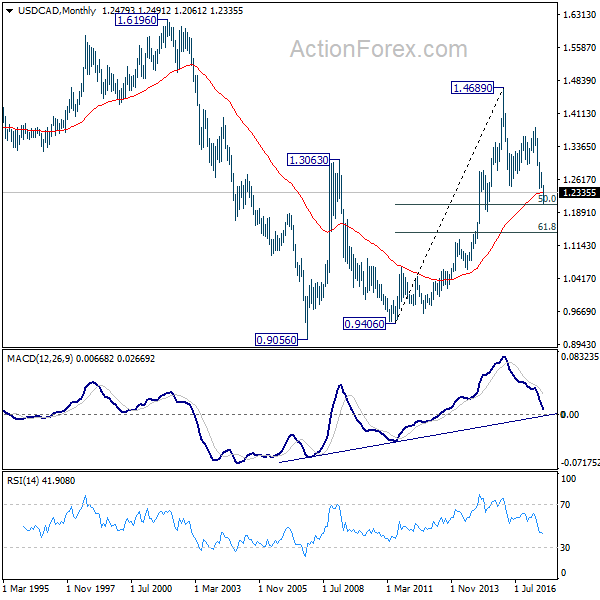
In the longer term picture, the long term outlook is turned a bit mixed with the current downside acceleration. As noted above, 50% retracement of 0.9406 to 1.4869 at 1.2048 is a key level to determine whether up trend from 0.9056 (2007) has already completed.
GBP/JPY Weekly Outlook
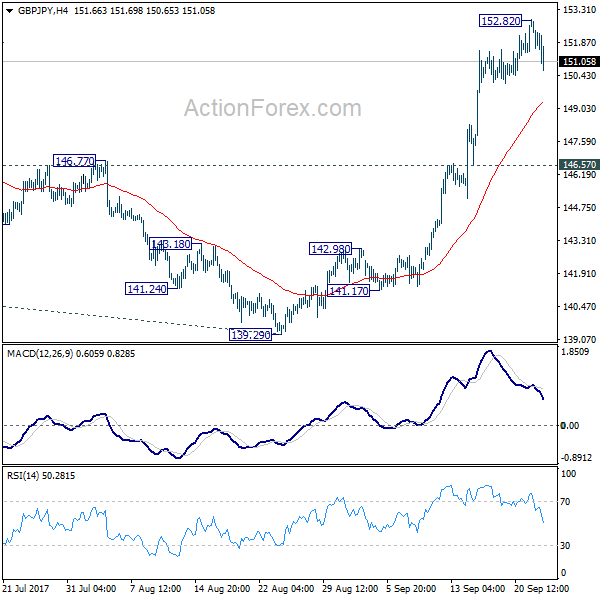
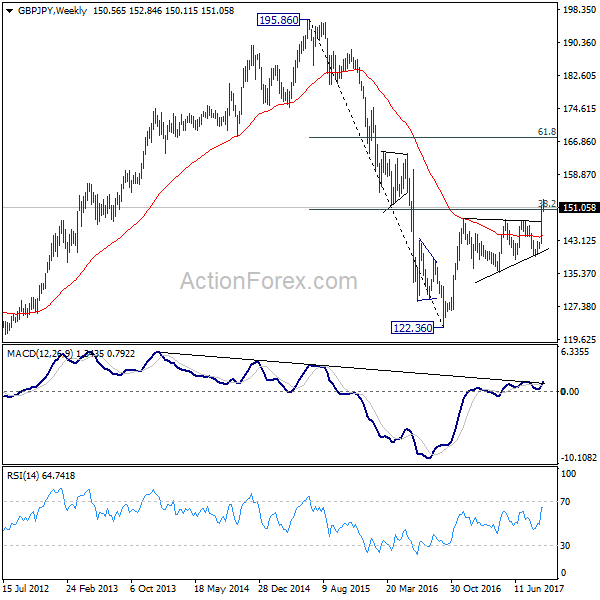
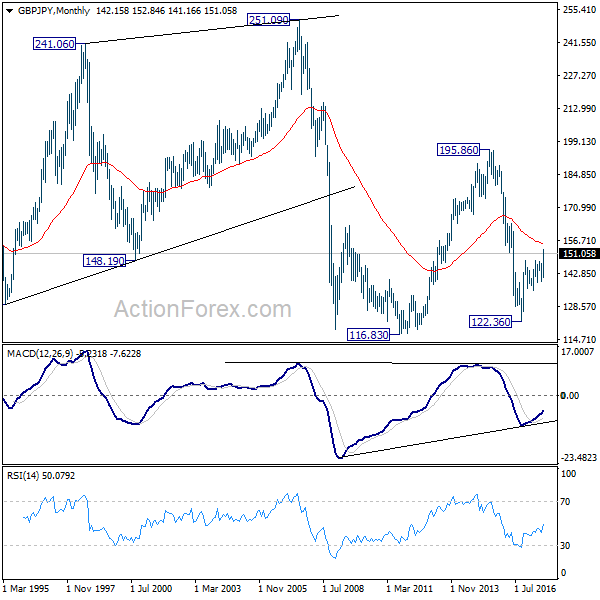
GBP/JPY edged higher to 152.82 last week but lost momentum since then. Initial bias is neutral this week for consolidations first. Downside of retreat should be contained above 146.57 support to bring another rally. Above 152.82 will target 61.8% projection of 122.36 to 148.42 from 139.29 at 155.39 next.
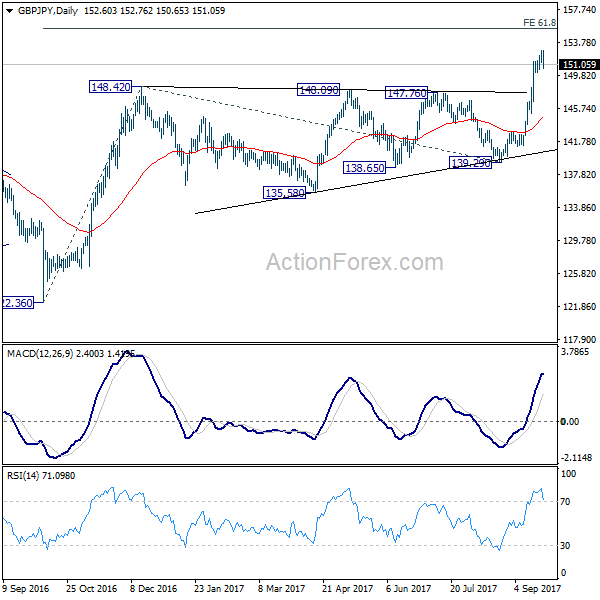
In the bigger picture, medium term rebound from 122.36 is in progress. Firm break of 38.2% retracement of 196.85 to 122.36 at 150.43 will carry long term bullish implications. In that case, GBP/JPY could target 61.8% retracement at 167.78. For now, the bullish scenario is preferred as long as 139.29 support holds.
In the longer term picture, current decline argues that the down from fro 195.86 (2015 high) has already completed at 122.36. Focus is now on 55 month EMA (now at 155.14). Firm break there will suggest that rise form 122.36 is developing in to a long term move that target 195.86 again. And, price actions from 116.83 (2011 low) is indeed a sideway pattern that could last more than a decade.
EUR/JPY Weekly Outlook
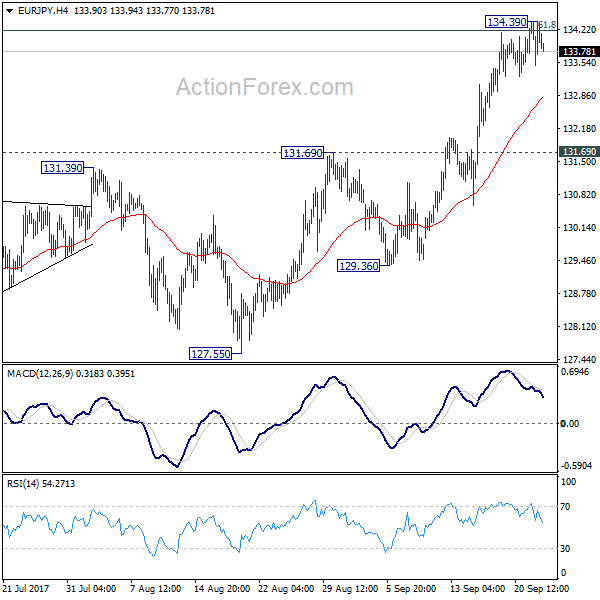
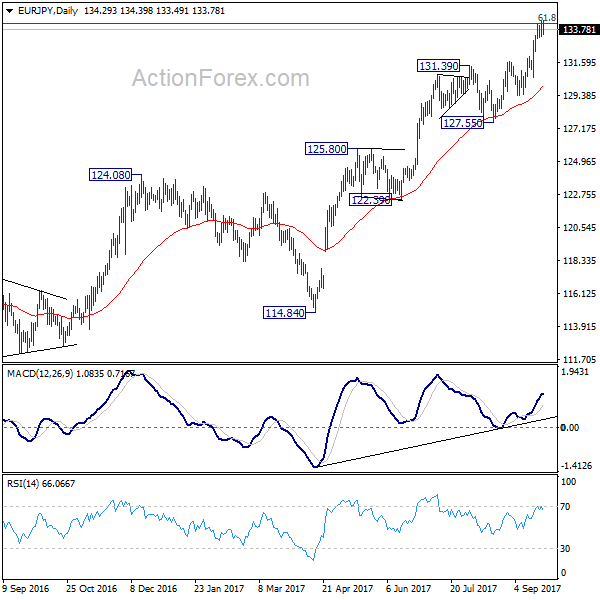
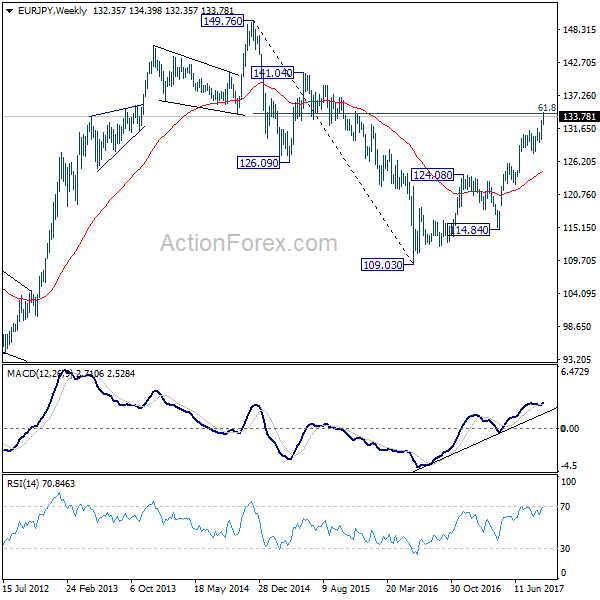
EUR/JPY rose further to 134.39 last week but lost momentum after hitting 134.20 fibonacci level. Initial bias is neutral this week first, for consolidations. While deeper retreat cannot be ruled out. Outlook will remain bullish as long as 131.69 resistance turned support holds. Sustained break of 134.20 will target 141.04 resistance next.
In the bigger picture, current rise from 109.03 is seen as at the same degree as the down trend from 149.76 (2014 high) to 109.03 (2016 low). 61.8% retracement of 149.76 to 109.03 at 134.20 is already met. Sustained break there will pave the way to key long term resistance zone at 141.04/149.76. On the downside, break of 127.55 support is needed to be the first signal of medium term reversal. Otherwise, outlook will remain bullish.
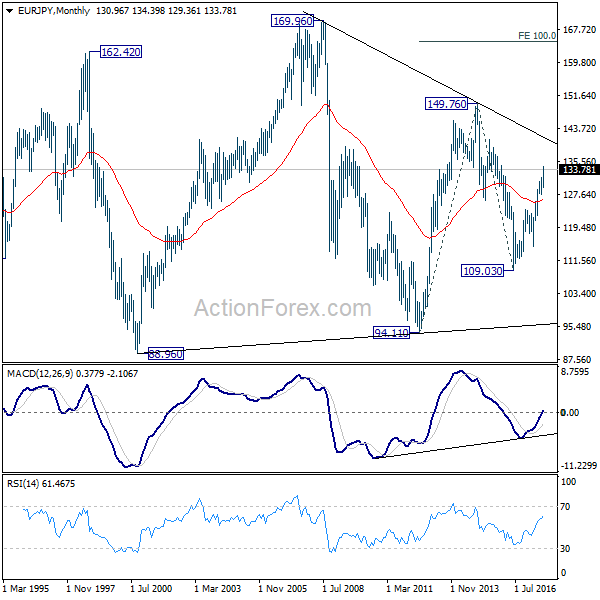
In the long term picture, at this point, there is no clear indication that rise from 109.03 is resuming that from 94.11. Hence, we'd be cautious on topping below 149.76 to extend range trading. Nonetheless, firm break of 149.76 will indicates strong underlying buying. In such case, EUR/JPY will target 100% projection of 94.11 to 149.76 from 109.03 at 164.68.
EUR/GBP Weekly Outlook
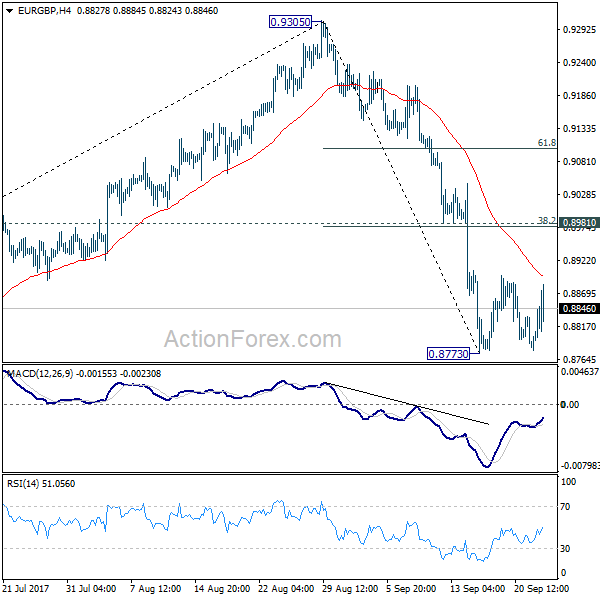
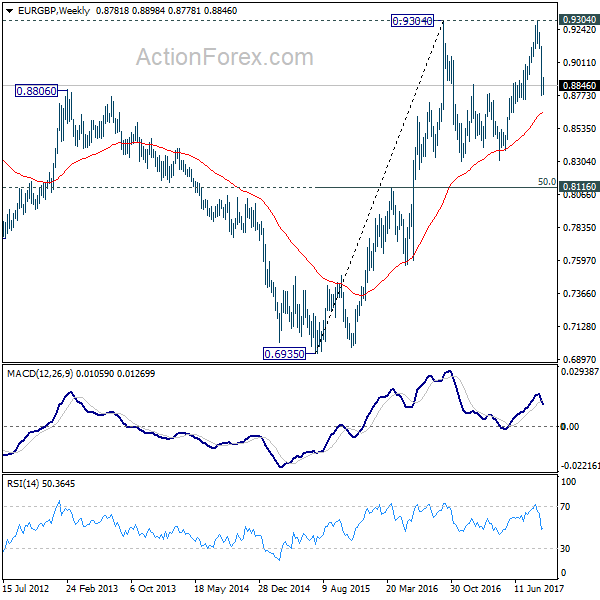
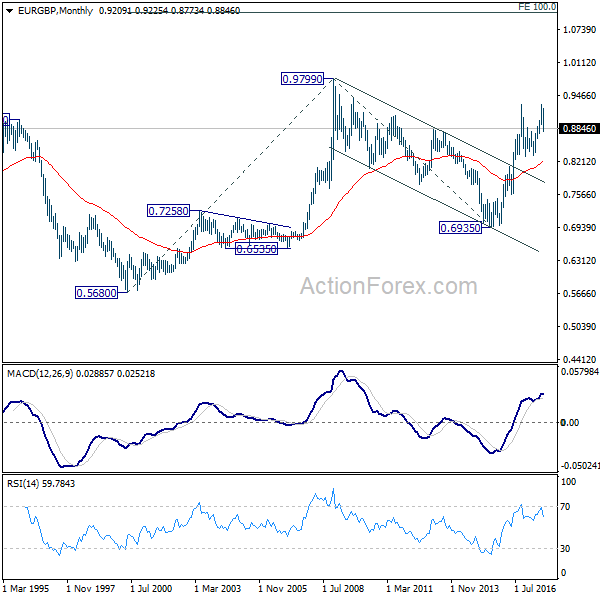
EUR/GBP turned into consolidation above 0.8773 temporary low last week. But overall outlook is unchanged. Initial bias remains neutral this week first. Near term outlook stays bearish as long as 0.8981 cluster resistance holds (38.2% retracement of 0.9305 to 0.8773 at 0.8976). Fall from 0.9305 is seen as the third leg of consolidation pattern from 0.9304. Below 0.8773 will target 61.8% retracement of 0.8312 to 0.9305 at 0.8691 and below. We'll look for bottoming signal again at it approaches 0.8303 support.
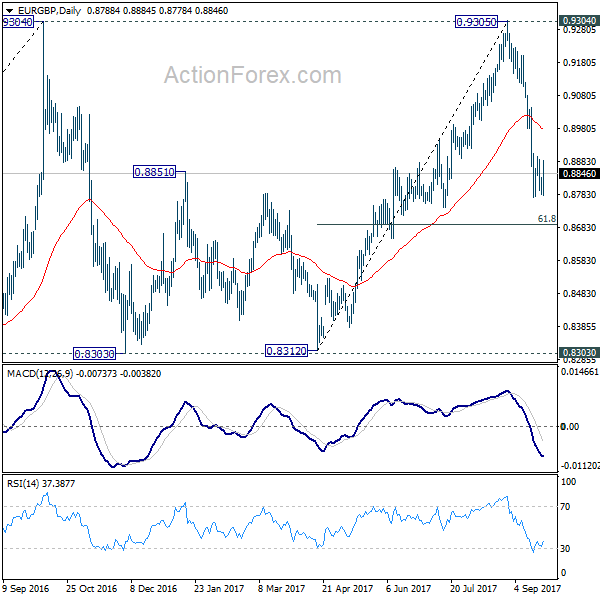
In the bigger picture, price actions from 0.9304 are viewed as a medium term corrective pattern. It's still in progress with fall from 0.9305 as the third leg. Break of 0.8303 could be seen. But we'd expect strong support from 0.8116 cluster support (50% retracement of 0.6935 to 0.9304 at 0.8120) to contain downside. Whole up trend from 0.6935 is expected to resume after consolidation from 0.9304 completes.
In the long term picture, firstly, price action from 0.9799 (2008 high) is seen as a long term corrective pattern and should have completed at 0.6935 (2015 low). Secondly, rise from 0.6935 is likely resuming up trend from 0.5680 (2000 low). Thirdly, this is supported by the impulsive structure of the rise from 0.6935 to 0.9304. Hence, after the correction from 0.9304 completes, we'd expect another medium term up trend through 0.9799 to 61.8% projection of 0.5680 to 0.9799 from 0.6935 at 1.1054.
EUR/AUD Weekly Outlook
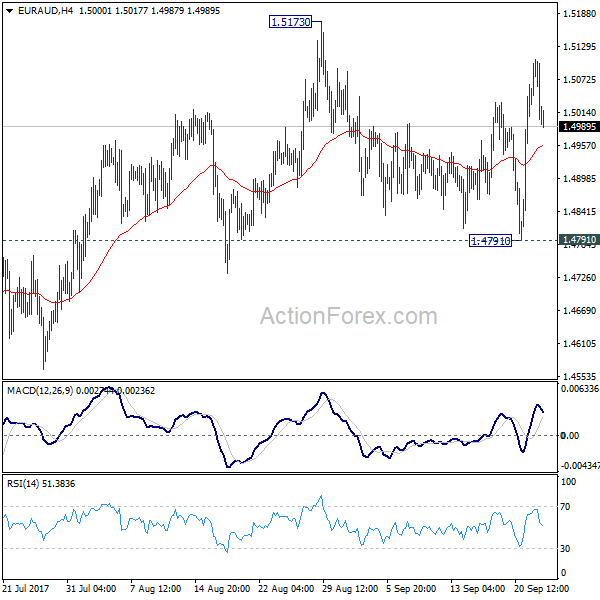
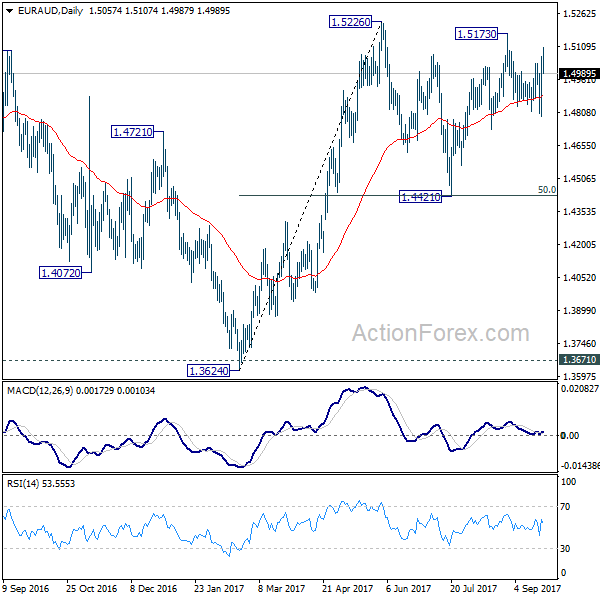
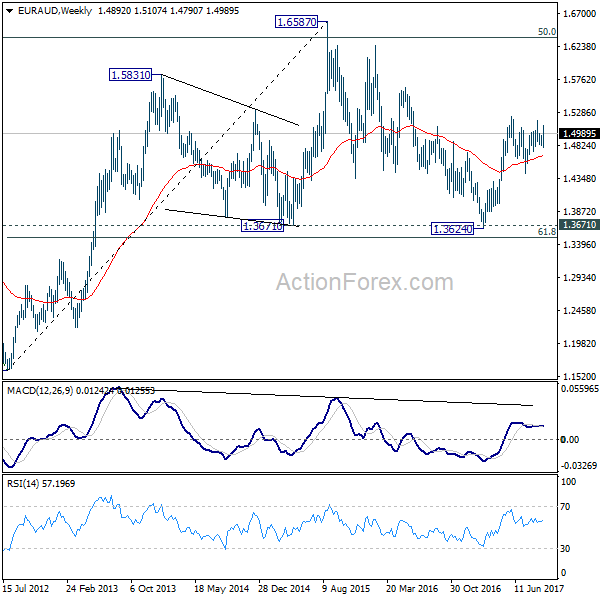
Much volatility was seen in EUR/AUD last week. But it was bounded in range of 1.4791/5173, without making any progress. Initial bias is neutral this week first. On the upside, break of 1.5173/5226 resistance zone will finally resume larger rise from 1.3624. On the downside, break of 1.4791 support will turn bias to the downside and extend the fall from 1.5173 to retest 1.4421 support.
In the bigger picture, we're holding on to the view that corrective decline from 1.6587 medium term top has completed at 1.3624. Rise from 1.3624 is expected to extend to retest 1.6587. The corrective structure of the price actions from 1.5226 is affirming this view. Above 1.5226 will target a test on 1.6587 key resistance. However, break of 1.4421 support will dampen our view and would drag EUR/AUD lower to retest key support zone around 1.3624.
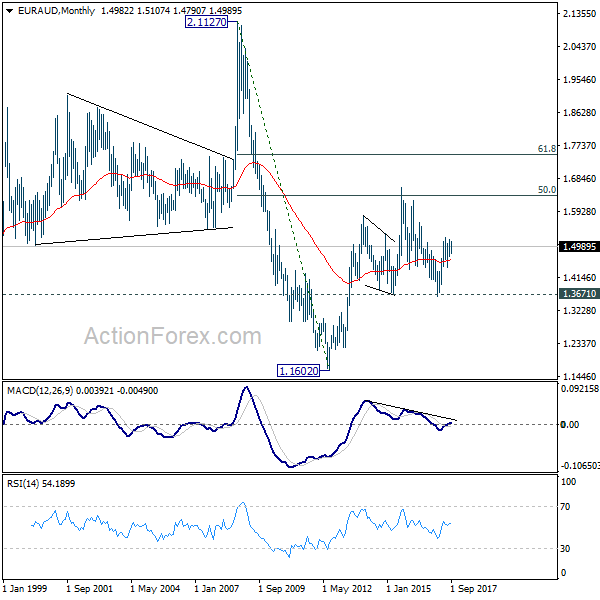
In the longer term picture, the rise from 1.1602 long term bottom isn't over yet. We'll keep monitoring the development but there is prospect of extending the rise to 61.8% retracement of 2.1127 to 1.1602 at 1.7488 and above. However, sustained trading below 1.3671 should confirm trend reversal and target 1.1602 long term bottom again.
EUR/CHF Weekly Outlook
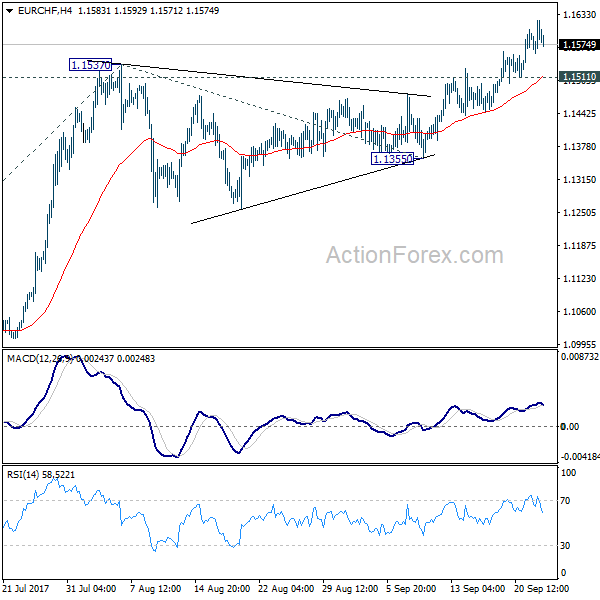
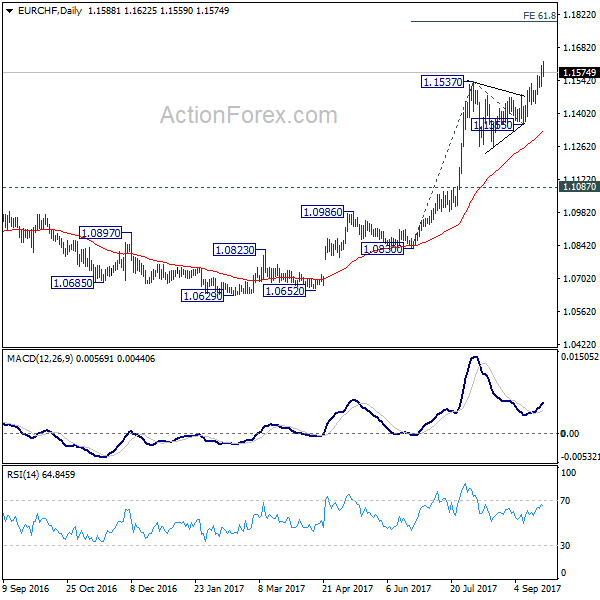
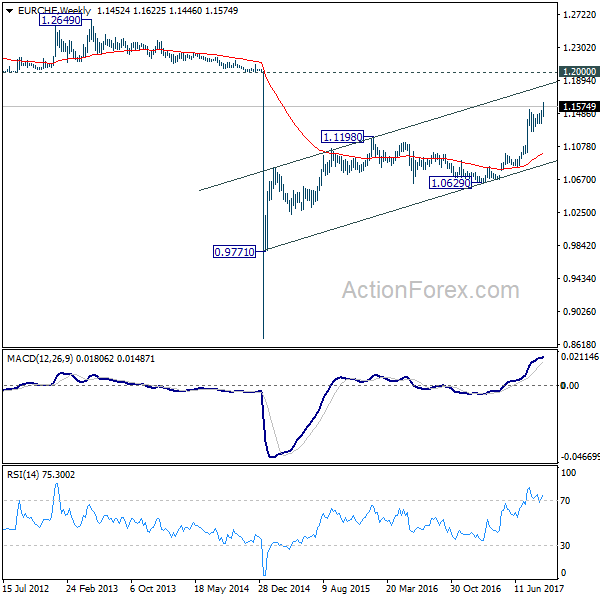
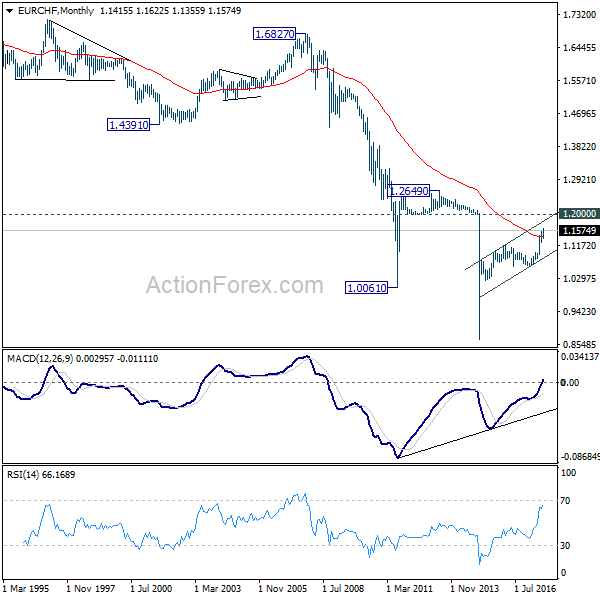
EUR/CHF surged to as high as 1.1622 last week as larger up trend finally resumed. Initial bias remains on the upside this week. Current rally would target 61.8% projection of 1.0830 to 1.1537 from 1.1355 at 1.1792 next. On the downside, below 1.1511 minor support will turn intraday bias neutral and bring consolidations first.
In the bigger picture, long term rise from SNB spike low back in 2015 is still in progress. EUR/CHF should now be heading back to prior SNB imposed floor at 1.2000. For now, this will be the favored case as long as 1.1198 resistance turned support holds.
Euro Resilient after an Eventful Week, Focus Stays on Politics ahead
There were a lot of happenings in the financial markets last week. The more hawkish than expected FOMC announce was supposed to give Dollar a strong boost. But it was the resilience of Euro that's much more convincing. New Zealand Dollar ended as the strongest one leading up to Saturday's election. Kiwi traders should be given a relief after the ruling National Party won the election, even though without outright majority. On the other hand, Canadian Dollar ended as the weakest as recent consolidation continued. Yen and Swiss Franc followed as the next weakest in an era of global monetary stimulus exit.
There are a lot of things to focus on this week. The list includes reactions to New Zealand election, reactions to Germany elections, reactions to UK Prime Minister Theresa May's Brexit speech in Italy, start of the fourth round of Brexit negotiation, Moody's downgrade of UK's credit rating, Trump's long awaited tax plan, Japan Abe's call for snap election. And of course, no one really knows what is going to happen next between US and North Korea.
FOMC announce revived December hike expectations
Dollar was supposed to be a star performer last week after the more hawkish than expected FOMC announcements. However, the greenback has indeed closed lower against Euro and Kiwi. The key take away from FOMC was that policymakers kept the interest rate projections for 2017 and 2018 unchanged. That is, they're expecting one more hike this year, and three more next year. More in .Fed To Reduce Balance Sheet From October, Committed To One More Rate Hike This Year. Such expectation is clearly seen in market pricing. Fed fund futures are pricing in 72.8% chance of a December hike, comparing to 52.6% a week ago, and 33.8% a month ago.
US-North Korea tensions escalated
However, momentum of the greenback was limited by geopolitical and domestic uncertainties. The tension between US and North Korea escalated again last week first as US President Donald Trump warned in his United Nations speech to "totally destroy" North Korea. Then Trump issued a new executive order, granting the Treasury Department authority to penalize any company or person doing business with North Korea. These entities' access to the US financial system could be cut off and assets could be freezed. The act is seen as US unilaterally enforcing a trade embargo against North Korea, and forcing any other country in the world to join it. Then North Korea's leader Kim Jong-Un struck back and pledged to give "highest level of hard-line countermeasure" to "mentally deranged U.S. dotard" Trump. And the measures include launching a hydrogen bomb in Pacific Ocean.
Trump to deliver tax plan finally?
Domestically, Trump's administration is expected to finally deliver the highly anticipated tax plan this week on Wednesday. But so far, there is little details released on it yet. There are expectations of a cut to corporate taxes from current 35% to low 20s. Individual tax rates are also expected to be lowered, with particular focus on the middle class. However, again, as of now, the markets heard noting concrete. And it's still doubtful on whether what would be delivered are solid enough. Even so, the tax bill still has to work its way through Congress. The yet again possible failure of another attempt to repeal Obamacare has already shown it's a very tough process.
Dollar index still in down trend
The rebound in dollar index has been very unconvincing so far. And this was clearly seen in the range trading in EUR/USD too. Dollar index's actions from 91.01 are clearly corrective, kept well below 55 day EMA and even further below 94.14 resistance. Down trend from 103.82 is still in progress for 50% retracement of 72.69 to 103.82 at 94.14.
Yen weakness as on-going theme in markets
Some point to the rally in USD/JPY as a sign of Dollar strength. We don't have much objection to that. But we'd like to emphasize that it's more about Yen's broad based weakness. There are on-going themes and temporary themes in the forex markets at all time. For example, for now, geopolitical tension could be a temporary theme. The on-going theme is global exit of monetary stimulus. At the same time, there is little chance for Japan to exit monetary stimulus yet, based on the sluggish inflation outlook. Hence, Yen weakness will likely continue, together with Swiss Franc. And there wasn't sustainable buying seen even on resurgence of geopolitical risks.
Japan Abe to call for snap election
Another point to consider is that Prime Minister Shinzo Abe is going to call for dissolution of Parliament on Monday. And a snap election would take place in October. Abe would like to make use of the rebound in his popularity to extend the control of his party on the country through next year. But at the same time, Abe could also be pushing back the time frame for achieve primary fiscal surplus in 2020, to a few years later. The question on who to replace BoJ Governor Haruhiko Kuroda next year is still not answered. Some volatility could be seen in Yen next week as Abe is eyed.
Germany election should now affect Euro's upward path
Euro, on the other hand, was strong in general last week, and was resilient against Dollar too. EUR/CHF has indeed took the long awaited range breakout. The common currency was supported by solid Eurozone data, including German ZEW and Eurozone PMIs. The appreciation in the exchange rate has done little impact on sentiments. At this point, ECB is widely expected to announce the so called "recalibration" of monetary policy in October. Little surprise is expected from the Germany election this Sunday. Angela Merkel will stay as the leader of the country with Christian Democratic Union (CDU) maintaining majority. The main question would be on the coalition. More in German Election: Not as Boring as You Think. But the results are unlikely to derail Euro's upward trajectory against Dollar and Yen anyway.
UK PM May called for two year "implementation period"
In the high profile Brexit speech in Italy, UK Prime Minster Theresa May called for a two-year "implementation period" after Brexit. That is, Britain will leave European Union as scheduled in March 2019. Such a Brexit is more of a political one. After that, the current arrangements on trade, travel, customs, regulations and security, etc, will remain unchanged for two years. During the implementation period, May said that "access to one another's markets should continue on current terms and Britain also should continue to take part in existing security measures." Then there will be a full trade and travel Brexit in 2021. And May aims at building a "deep special partnership" with EU starting 2021. May said that UK would "honour" the commitments made while still being a member of EU. And that would avoid creating "uncertainty for the remaining member states".
Moody's downgraded UK credit rating
It takes some more time to see the responses from other UK and EU officials to May's proposal. And eyes will also be on the fourth round of negotiation to start this week. But ahead of that, Moody's downgraded UK's crediting rating to Aa2, from Aa1, with stable outlook. The rating agency noted that UK's public finances outlook has weakened significantly, "with the government's fiscal consolidation plans increasingly in question and the debt burden expected to continue to rise." And, "manner of its departure from the European Union" as well as the "increasingly apparent challenges to policy-making given the complexity of Brexit negotiations and associated domestic political dynamics" will weigh on its fiscal situation. In addition, Moody's is in doubt if UK would be able to strike a trade agreement with EU, without much impact to the economy.
Overall, for Sterling, the most important trading theme remain on expectation of a November BoE hike. Comments from BoE officials and economic data so far are supporting such expectation. There could be some volatility in the Pound this week on Brexit news. But at this point, any pull back would likely be temporary.
Canadian dollar in consolidation
Canadian Dollar under performed all others last week as recent consolidation extended. Comments from BoC Deputy Governor Timothy Lane reminded the markets that the central bank is not on autopilot for rate hikes. And weaker than expected CPI and retail sales data also weigh down the Loonie slightly. While Aussie was hammered briefly by S&P's downgrade of China's credit rating, it still performed better than Loonie. But after all, USD/CAD remained in consolidation mode, below key near term resistance at 1.2412. And the down trend is still more likely to extend than not.
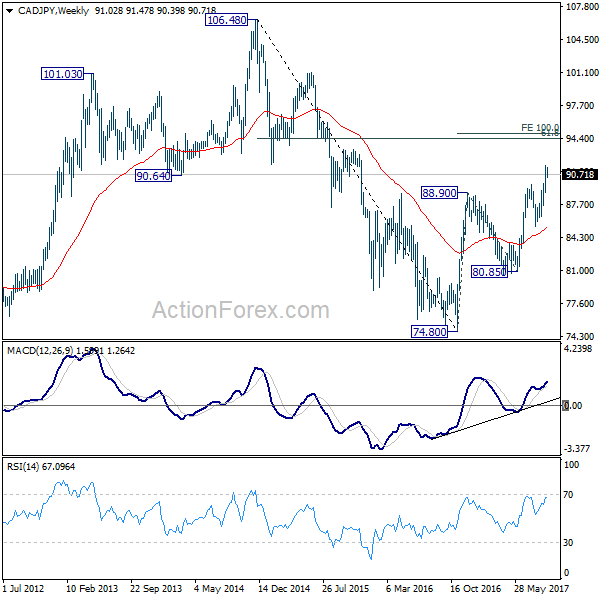
Trading strategy: Buy CAD/JPY at 89.90
Regarding trading strategy, we wanted to by CAD/JPY at 89.90 last week. But the low in the cross was only 90.39. Hence, our order was not filled. Nonetheless, we are still interested in Yen selling opportunities, on the theme of global monetary stimulus exit. Dollar is avoided for the moment because the rally last week was unconvincing in spite of hawkish FOMC and rate expectations. Euro could be a candidate but EUR/JPY is losing momentum after hitting 134.20 fibonacci projection. GBP/JPY also lost some upside momentum while reactions to Theresa May's two year implementation period, Moody's downgrade and Brexit negotiations are unclear. So we'll avoid GBP/JPY. RBA is in no hurry to rate interest rate. So, still, CAD/JPY is the preferred one.
We'll try again to buy CAD/JPY at 89.90, with stop at 88.50. First target is 61.8% retracement of 106.48 to 74.80 at 94.37. There is prospect of hitting 106.48 high in medium term.
EUR/USD Weekly Outlook
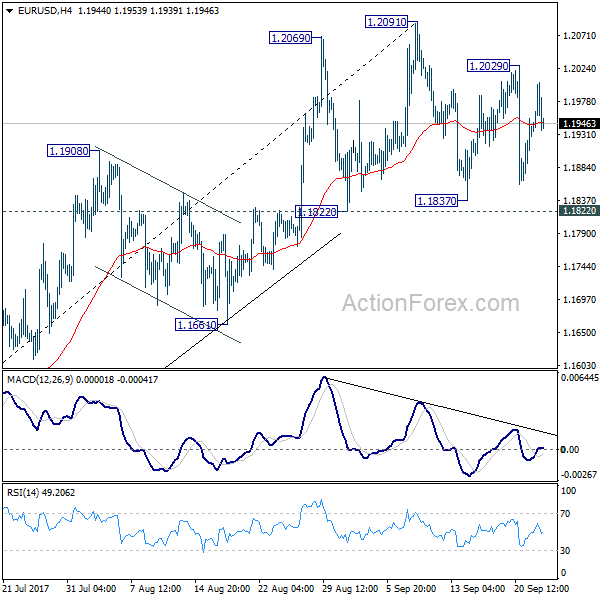
Much volatility was seen in EUR/USD last week. But it stayed in range of 1.1822/2091 so far. Initial bias remains neutral this week first. With 1.1822 support intact, near term outlook remains bullish for further rally. Break of 1.2091 will extend larger rise from 1.0339 and target next key fibonacci level at 1.2516. But considering bearish divergence condition in 4 hour MACD, break of 1.1822 will confirm short term reversal. In the case, intraday bias will be turned back to the downside through 1.1661 support. EUR/USD should then correct whole rise from 1.0569 and target 38.2% retracement of 1.0569 to 1.2091 at 1.1510.
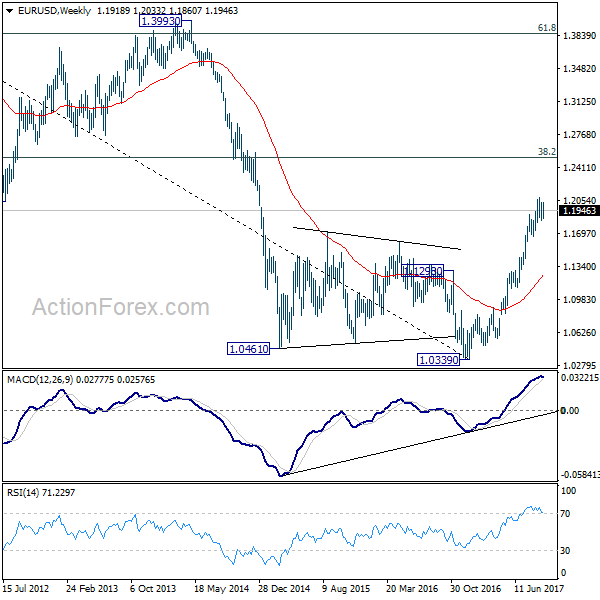
In the bigger picture, rise from medium term bottom at 1.0339 is still in progress for 38.2% retracement of 1.6039 (2008 high) to 1.0339 (2017 low) at 1.2516. However, it should be noted that there is no confirmation of trend reversal yet. That is, such rebound from 1.0399 could be a correction. And the long term fall from 1.6039 (2008 high) could resume. Hence, we'd be cautious on strong resistance from 1.2516 to limit upside. But after all, break of 1.1661 is needed to indicate medium term topping. Otherwise, outlook will remain bullish in case of pull back.
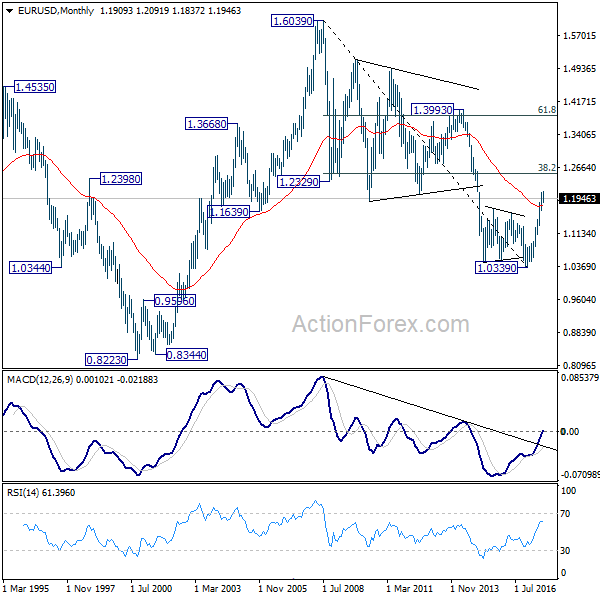
In the long term picture, 1.0339 is now seen as an important bottom as the down trend from 1.6039 (2008 high) could have completed. It's still early to decide whether price action form 1.0339 is developing into a corrective or impulsive move. But in either case, further rally would be seen to 38.2% retracement of 1.6039 to 1.0339 at 1.2516

Weekly Economic and Financial Commentary: The Fed Signals the Beginning of the End
U.S. Review
Balance Sheet Plan Commences in October
- The FOMC announced this week that it will start balance sheet normalization in October. The dot plot leaves open the possibility of another rate hike in 2017, but implies one less move in 2019. Officials also pushed out expectations to hit the 2 percent inflation target into 2019.
- The economic calendar focused heavily on housing this week. The key takeaway was largely that the inventory shortage was already straining the market, and the outlook for alleviating that strain with new construction was limited by major storms damaging vital southern markets, repairs for which will likely take precedence in coming months.
The Fed Signals the Beginning of the End
The Federal Reserve left rates unchanged in September, as was widely expected. There were several new developments, however. The committee will initiate the balance sheet draw-down in October. The plan is to only reinvest principal payments above a cap, which will start at $10 billion per month and increase every three months (economic conditions warranting) until the cap is $50 billion. The Fed is comfortable with the strength of the U.S. economy. In the September Summary of Economic Projections, participants expect stronger real GDP growth in 2017, with the median projection rising to 2.4 percent from 2.2 percent at the June meeting. Member projections also centered on a slightly higher pace in 2019 than in June, now anticipating a 2 percent medium-term growth rate. Persistently disappointing inflation readings brought the central tendency for core PCE down again, and the committee now expects inflation to take longer to hit the 2 percent target, which they expect will happen in 2019 rather than 2018. We are less optimistic and calling for 1.8 percent PCE growth in 2019. The FOMC made clear in the statement that temporary negative shocks from hurricanes are unlikely to derail economic growth materially in the medium term. The dot plot did not take another rate hike in 2017 off the table but did remove one from 2019. However, we still doubt the FOMC will be able to raise the funds rate as quickly as their dot plot implies in 2018.
Relatively Calm Before the Storm in Housing
The NAHB/Wells Fargo Housing Market Index fell 3 points in September as Hurricanes Harvey and Irma hit the two largest states for homebuilding, understandably dampening confidence for homebuilders. Florida and Texas were 25 percent of the single-family homebuilding market through July. The absence of that substantial activity in coming months will certainly be felt, and the corresponding demand for construction materials and labor to rebuild is likely to have ripple effects in unaffected markets in the form of higher construction costs. The storms have effectively put a pause on important housing market activity for the next few months, though demand and activity is likely to recover by the end of the year and 2018 will likely be stronger.
Housing starts have moderated in recent months relative to Q1. Starts in July were actually stronger than first reported, which resulted in an unexpected decline in August as those estimates were based on a lower July base. Beyond the month-to-month changes, starts have been much stronger for single-family than multifamily this year. Apartments have seen a great deal of supply come on the market in many parts of the country, cooling new construction. Single-family starts are in for a soft patch in coming months.
Sales of existing homes have also moderated, as strong demand continues to run up against lean inventory. August existing sales were also slightly impacted by Harvey, which arrived towards the end of the month and likely delayed some contract closings. Existing sales in September will give a better idea of the storm impacts, as 20 percent of the nation's existing home sales through the first half of 2017 were in Florida and Texas.
U.S. Outlook
Consumer Confidence • Tuesday
The Conference Board's measure of consumer confidence climbed again in August and, at 122.9, was just shy of its cycle peak set back in March. Steady progress in the labor market has supported households' views of the economy.
The cutoff date for the August survey was the 16th of the month, and therefore did not reflect the impact of Hurricane Harvey. With Hurricane Irma hitting Florida in early September, we expect to see confidence decline in next week's reading as the damages and disruptions erode views of business conditions. Beyond the directly impacted areas, the spike in gasoline prices linked to the storms is also likely weigh on confidence in the near term. As with previous severe storms, however, we expect related weakening to be short lived.
Previous: 122.9 Wells Fargo: 120.3 Consensus: 119.5
Durable Goods • Wednesday
Durable goods orders have been whipsawed even more than usual the past two months by a surge and subsequent unwinding of aircraft orders. Through the volatility, however, capital goods spending has improved. Orders for nondefense capital goods orders ex-air rose 1.0 percent in July, raising the three-month average annualized rate to 5.1 percent.
We expect to see a moderate rise in durable goods orders for August. While overall manufacturing production fell last month according to the Fed's industrial production report, the drop was due to a pullback in nondurables. Durables production rose last month, as did employment for the sector. With manufacturing PMIs also heading higher in August, we expect durable goods orders to have risen 0.4 percent last month.
Previous: -6.8% Wells Fargo: 0.4% Consensus: 0.9% (Month-Over-Month)
Personal Income • Friday
Personal income growth started the third quarter on solid footing, with income rising 0.4 percent in July. We expect to see a more modest 0.3 percent rise in August following slower job and average hourly earnings growth.
Low inflation in July helped to support real disposable income growth as well as real spending. August inflation, however, is likely to take a bigger bite out of income. Consumers faced higher gasoline prices in August even before the month-end spike caused by Hurricane Harvey, while the Consumer Price Index points to a pickup in core inflation. We expect to see PCE inflation, the Fed's preferred inflation gauge, rise 0.3 percent for August.
Previous: 0.4% Wells Fargo: 0.3% Consensus: 0.3% (Month-Over-Month)
Global Review
BoJ Chooses to Swim Against the Tightening Tide
- Unlike many of the world's other major central banks, the Bank of Japan (BoJ) showed no signs of turning off the stimulus spigot at its policy meeting this past week.
- Eurozone purchasing manager indices signaled faster growth in September, as both the manufacturing and service sector measures rose.
- The Canadian consumer price index showed signs of modest acceleration in August as headline and core measures were all in the ballpark of 1.5 percent year-over-year.
BoJ Chooses to Swim Against the Tightening Tide
As the Federal Reserve made the historic decision to begin unwinding its balance sheet, the Bank of Japan quietly elected to keep its cocktail of stimulus programs unchanged in an 8-1 vote, with the lone dissent coming for dovish rather than hawkish reasons. The move comes amid a broad shift in sentiment by many of the world's other major central banks as economies in the developed world have begun to accelerate in tandem, lessening the need for the extraordinary monetary policy stimulus adopted over the past few years.
Economic growth in Japan has actually been relatively strong in recent quarters, at least by Japanese standards. Japan's economy expanded at an annualized pace of 2.5 percent in the second quarter, and in so doing it extended the number of consecutive quarterly expansions to six—the longest winning streak in more than a decade (see chart on front page). Our fullyear forecast for real GDP growth in Japan is 1.9 percent, which would be the fastest pace since 2013.
The key challenge for the Bank of Japan is the continued lack of inflation. The consumer price index (ex-fresh food) in Japan was up just 0.5 percent year-over-year in July, and prices were in deflationary territory ex-food and energy (top chart). The BoJ is steadfast in its commitment to achieving what has been a fleeting objective for a generation: sustained inflation of 2 percent. Japan has struggled with slow growth and inflation more than most other advanced nations, and as a result its central bankers are resolutely committed to banishing its deflationary demons. Thus, we believe the BoJ will remain committed to its accommodative monetary policy measures for now even as the Fed, European Central Bank and others tilt in a more hawkish direction.
Purchasing managers' indices for the Eurozone continued their ascent in September (middle chart). The survey-based data showed activity strengthening in both the service and manufacturing sectors, with the manufacturing reading approaching levels not seen since the rebound from the Great Recession in 2010. Real retail sales in the United Kingdom also posted a beat, rising much faster than consensus expected in August. Non-store retailing growth continued surging, rising 5.0 percent over the month. Although it is only one month's print, the U.K. economy has been one of the few laggards in the developed world, and any signs of an improvement in economic activity are encouraging.
The Canadian consumer price index showed signs of modest acceleration in August. Headline and core measures were in the ballpark of 1.5 percent year-over-year, well within the Bank of Canada's (BoC) 1-3 percent target band for inflation. The Bank of Canada has hiked rates twice this year amid a pick-up in economic growth that has driven year-over-year real GDP growth to 3.7 percent as of Q2. With two meetings left this year, BoC officials will be watching closely to see if the acceleration in the economy is followed by further acceleration in prices. Thus far, price growth appears quite tame.
Global Outlook
Germany IFO • Monday
The week will start with a packed schedule of releases from some of the strongest and largest global players today. From Germany we will get the IFO business climate, expectations, and current assessment indices for September. Although these indices are qualitative surveys in nature, they have been pointing to an improved environment for the German economy in the third quarter of the year. In fact, the business climate index registered the highest reading for this index in July, at 116.0 while declining slightly to 115.9 in August. Thus, another strong reading will be supportive of a relatively strong German economy. The other two indices have also been higher in the third quarter with the current assessment index also hitting a series high in July of this year. Meanwhile, on Thursday markets will have an opportunity to look at the GfK consumer confidence index for October, with this index hitting a series high of 10.9 in September of this year.
Previous: 115.9 Consensus: 116.0
China Manufacturing PMI • Thursday
Although Chinese economic growth has slowed down considerably since the hay days of double-digit growth, what happens in China doesn't stay in China, and the country's numbers continue to drive expectations about the global economy. On Thursday and Friday, markets are going to get a chance to look at the state of the Chinese manufacturing sector in September with the release of the Caixin manufacturing PMI on Thursday and the official manufacturing PMI on Friday. The first one measures more closely manufacturing activity of smaller, privately owned firms and the official one measures mostly operations of large state owned enterprises. The good news is that both indices have moved above 50 and have continued to slowly improve during the last several months, and a further improvement could suggest better prospects for global economic growth.
Previous: 51.7 Consensus: 51.7
Japan Industrial Production • Thursday
The Japanese economy has been in the news lately and it has not been for bad news, quite the opposite, as second quarter GDP growth quickened and analysts are starting to change their tone on the prospects for this troubled economy. Thus, on Thursday markets will be able to take a look at the industrial production index for August. The index has been very volatile on a month-overmonth basis, up one month and then down the following, but has remained relatively strong on a year-over-year basis, up 4.7 percent in July after a 5.5 percent increase in June. Thus, another strong year-over-year performance in August on both a year-over-year as well as on a monthly basis could reinforce the improved expectations regarding the Japanese economy. On that same day we will also get the release of retail sales which have also been relatively strong lately.
Previous: 4.7% Consensus: 5.2% (Year-Over-Year)
Point of View
Interest Rate Watch
Consumer Intentions: Future Expectations
This week the FOMC indicated their intentions for policy going forward. How do their intentions compare to our expectations? In this case, our outlook is for lower inflation and therefore a less aggressive path for the funds rate in 2018 relative to the FOMC's dot plot. Additionally, we remain concerned that balance sheet normalization will represent further issues for long-term bond investors.
DOT Plot—Intentions
As illustrated in the top graph, the FOMC's intentions signal continued increases in the federal funds rate throughout 2018/2019 and an eventual long-run equilibrium at 2.75 percent. In contrast, our view is that the FOMC will raise the funds rate in December, but only twice in 2018.
Future Expectations: Inflation
The recent pullback in inflation is again fanning fears about whether the Fed can reach its inflation target of 2 percent on a sustained basis. Goods prices have acted as a drag while lower commodity prices have also held down the index. Will an upswing in inflation come in time for the FOMC to raise rates once more in 2017?
Crossing the Rubicon or the Potomac
As illustrated in the bottom graph, the journey toward normalization for the funds rate is quickly approaching a critical crossing point. When the FOMC had earlier projected its path for the funds rate, the gap between the funds rate and the PCE rate of inflation was fairly wide. This gave the FOMC some latitude to pursue its intentions for the funds rate. However, the gap between the pace of inflation and the intended path of the funds rate has diminished significantly such that future increases in the funds rate will mean crossing into real interest rate territory.
In addition, our recent research on recession forecasting produced results that indicated that when the funds rate crosses over the low of the 10-year Treasury rate in the cycle then the probability of a recession within two years goes up significantly. This crossing has two critical market aspects. First, this signals to the market the seriousness of FOMC intentions to pursue future interest rates increases. Second, the rate increases puts earlier market purchases of bills/notes/bonds under pressure for potential reductions to their total returns.
Credit Market Insights
Record-breaking Household Wealth
This week, the Federal Reserve released the Financial Accounts of the United States for Q2-2017. The data revealed that household net worth increased for the seventh consecutive quarter and has now reached an all-time high of $96.2 trillion. This is a $1.7 trillion increase over the quarter, and much of this spike can be attributed to the bull market, as corporate equities jumped $1.1 trillion over the quarter and are up 19.4 percent over the year.
Growth of nonfinancial domestic debt slowed for the third consecutive quarter on a year-ago basis to 3.5 percent. Debt remains elevated, however, at 248 percent of real GDP. Domestic nonfinancial debt rose by an annual rate of 3.8 percent and this was driven primarily by government borrowing, as federal borrowing grew at a 3.6 percent pace, compared to a 2.6 percent contraction in Q1.
Consumer credit grew at an annual rate of 4.6 percent, with the highest yearly gains in auto loans and credit cards. Mortgage debt grew at a 2.8 percent annual rate, and mortgage debt as a percent of total assets continued decreasing, at just under 9 percent in Q2.
In all, the Q2 data looks to be encouraging, as households continue to break net worth records and the stock market and home values keep rising. Spending has not picked up at as strong a pace as wealth, but with record-breaking wealth figures, personal consumption could be due for an uptick.
Topic of the Week
Unwinding After a Long Decade
Nearly a decade ago, the Fed embarked on an ambitious and revolutionary program to buy financial assets in an effort to ease financial market conditions and spur an improvement in the economy. The multiple quantitative easing programs enacted in the subsequent years swelled the Fed's balance sheet from less than $1 trillion in 2008 to more than $4 trillion today. At its meeting this past week, the FOMC formally announced its intent to begin winding down these asset holdings.
The balance sheet run-off will commence in October, with the Fed reinvesting the principal payments that exceed a modest cap of $10 billion per month ($6 billion for Treasuries and $4 billion for mortgage-backed securities). Then, every three months and assuming economic conditions still warrant it, the Fed will raise those caps by equal amounts four more times, until the final cap amount stands at $50 billion per month ($30 billion for Treasuries and $20 billion for MBS).
Encouragingly for Fed policymakers, a day that many pundits thought would never come was met with little fanfare by financial markets. Treasury yields rose after the announcement, but only modestly as the Fed's intentions were telegraphed well in advance of the meeting. We do not expect Treasury yields to move meaningfully in the near-term, as the initial size of the caps are relatively modest. As the program ramps up, however, the rising supply should put upward pressure on yields, all else equal. With the announcement behind us, attention now turns to just how hawkish the FOMC will be with the fed funds rate as balance sheet reductions begin to accelerate. The terminal size of the balance sheet also remains an unresolved question.
Fed Chair Yellen is often seen in a dovish light, but she has helped lead four rate hikes after years at the zero bound and initiated balance sheet reductions. As the chapter on Chair Yellen's term potentially comes to a close, a new chapter on the Fed's unprecedented balance sheet unwind has begun.