Sample Category Title
Theresa May Seeks To Stay In The Trade Bloc For A Two Year ‘Transitional Phase’ Post Brexit
For the 24 hours to 23:00 GMT, the GBP declined 0.38% against the USD and closed at 1.3520 on Friday, following the UK Prime Minister, Theresa May’s Brexit speech.
The British Prime Minister proposed a two-year implementation period once Brexit takes place, during which the UK would continue to have unfettered access to the European Union’s (EU) single market. May also indicated that Britain would continue to pay into the EU budget during the period of its EU’s membership.
In the Asian session, at GMT0300, the pair is trading at 1.353, with the GBP trading 0.07% higher against the USD from Friday’s close.
The pair is expected to find support at 1.3455, and a fall through could take it to the next support level of 1.3381. The pair is expected to find its first resistance at 1.3600, and a rise through could take it to the next resistance level of 1.3671.
The currency pair is trading below its 20 Hr and 50 Hr moving averages.

Japanese Manufacturing Sector Growth Hit A 4-Month High In September
For the 24 hours to 23:00 GMT, the USD declined 0.36% against the JPY and closed at 112.07 on Friday.
In the Asian session, at GMT0300, the pair is trading at 112.27, with the USD trading 0.18% higher against the JPY from Friday's close.
Overnight data indicated that Japan's flash Nikkei manufacturing PMI rose to a level of 52.6 in September, notching a four-month high, amid a pick-up in domestic and export orders. The PMI had registered a level of 52.2 in the previous month.
The pair is expected to find support at 111.77, and a fall through could take it to the next support level of 111.27. The pair is expected to find its first resistance at 112.65, and a rise through could take it to the next resistance level of 113.03.
Going ahead, investors will focus on a speech by the Bank of Japan (BoJ) Governor, Haruhiko Kuroda, due in some time.
The currency pair is trading above its 20 Hr moving average and showing convergence with its 50 Hr moving average

Swiss Franc Trading A Tad Higher This Morning
For the 24 hours to 23:00 GMT, the USD slightly declined against the CHF and closed at 0.9705 on Friday.
In the Asian session, at GMT0300, the pair is trading at 0.9703, with the USD trading marginally lower against the CHF from Friday’s close.
The pair is expected to find support at 0.9676, and a fall through could take it to the next support level of 0.9649. The pair is expected to find its first resistance at 0.9722, and a rise through could take it to the next resistance level of 0.9741.
The currency pair is trading above its 20 Hr moving average and showing convergence with its 50 Hr moving average.

Canada’s Annual Inflation Rose Less-Than-Expected In August
For the 24 hours to 23:00 GMT, the USD rose 0.06% against the CAD and closed at 1.2337 on Friday.
The Canadian Dollar lost ground, after Canada's consumer price index (CPI) advanced less-than-anticipated by 1.4% on an annual basis in August, compare to market expectations for a rise of 1.5%. In the prior month, the CPI had gained 1.2%.
On the contrary, the nation's retail sales climbed 0.4% on a monthly basis in July, topping market consensus for an advance of 0.2%. In the prior month, retail sales had recorded a revised flat reading.
In the Asian session, at GMT0300, the pair is trading at 1.2334, with the USD trading slightly lower against the CAD from Friday's close.
The pair is expected to find support at 1.2276, and a fall through could take it to the next support level of 1.2219. The pair is expected to find its first resistance at 1.2371, and a rise through could take it to the next resistance level of 1.2409.
The currency pair is trading above its 20 Hr moving average and showing convergence with its 50 Hr moving average.

European Open Briefing: Asia-Pacific Equity Markets Were Mixed On Monday
Global Markets:
- Asian stock markets: Nikkei up 0.49 %, Shanghai Composite down 0.36 %, Hang Seng lost 1.09 %, ASX 200 rose 0.1 %
- Commodities: Gold at $1297.11 (-0.04 %), Silver at $16.98 (-0.03 %), WTI Oil at $50.52 (-0.28 %), Brent Oil at $56.35 (-0.12 %)
- Rates: US 10-year yield at 2.25, UK 10-year yield at 2.35, German 10-year yield at 0.44
News & Data:
- (JPY) Flash Manufacturing PMI 52.6 vs 53.4 expected
- (EUR) French Flash Manufacturing PMI 56.0 vs 55.6 expected
- (EUR) French Flash Services PMI 57.1 vs 59.0 expected
- (EUR) German Flash Manufacturing PMI 60.6 vs 59.0 expected
- (EUR) German Flash Services PMI 55.6 vs 53.8 expected
- (EUR) Flash Manufacturing PMI 58.2 vs 57.2 expected
- (EUR) Flash Services PMI 55.6 vs 54.7 expected
- (CAD) CPI m/m 0.1 % vs 0.2 % expected
- (CAD) Core Retail Sales m/m 0.2 % vs 0.4 % expected
- (CAD) Common CPI y/y 1.5 % vs 1.4 % expected
- (CAD) Median CPI y/y 1.7 % vs 1.7 % previous
- (CAD) Retail Sales m/m 0.4 % vs 0.2 % expected
- (CAD) Trimmed CPI y/y 1.4 % vs 1.3 % previous
- Oil holds gains as producers say market rebalancing- RTRS
- Japan Abe to order $17.8 billion stimulus package – Sources
- North Korea's A-Bomb Is Deterring U.S. First Strike, Russia Says
CFTC Positioning Data:
- EUR long 62K vs 86K long last week.
- GBP short 10K vs 46K short last week.
- JPY short 51K vs 57K short last week.
- CHF short 1.5K vs 2K short last week.
- CAD long 59K vs 50K long.
- AUD long 72k vs 63k last week.
- NZD long 7K vs 12K long last week.
Markets Update:
Asia-Pacific equity markets were mixed on Monday. Investors shrugged off weekend election results in Germany and New Zealand. Stocks in Australia and Japan rose on local drivers, whereas other Asian markets opened in Red weighed by concerns about China’s economy.
In spite of losing more seats than expected, Germany’s Incumbent Chancellor Angela Merkel will continue to lead the government as she is expected to manage to form government in coalition. For New Zealand, the result was more or less as expected, the incumbent National Party achieved the highest proportion of votes but came three seats short of an outright legislative majority.
EURUSD is currently seen trading around 1.19334 as the Euro slid 0.2 percent against the US Dollar. The Euro has spent much of the session today edging back higher to try to fill its 'gap. The dollar index, which tracks the dollar against a basket of currencies rose 0.1 percent and is currently valued at 92.22
USDJPY had an active session early on Monday reaching as high as 112.54 following a disappointing Flash Manufacturing PMI, Price is seen trading at 112.24 as the yen currently stands 0.2 percent down against the US Dollar, kicking the week off on a down note after recording declines over the past two weeks. Japanese Prime Minister Abe is holding a news conference later today at 09: 00GMT – he is expected to announce an early election.
AUDUSD is currently seen Trading at 0.7964 trading up from its earlier lows below 0.7950. Notably, Australia’s S&P/ASX 200 was up earlier today on strength from big banks and mining companies. Meanwhile, The New Zealand Dollar dropped around 1 percent and is currently seen trading at 0.7263 against the US Dollar.
Upcoming Events:
- 05:35 GMT – (JPY) Flash Manufacturing PMI
- 05:35 GMT – (JPY) BOJ Gov Kuroda Speaks
- 08:00 GMT – (EUR) German Ifo Business Climate
- 12:30 GMT – (USD) FOMC Member Dudley Speaks
- 13:00 GMT – (EUR) ECB President Draghi Speaks
- 16:40 GMT – (USD) FOMC Member Evans Speaks
- 21:15 GMT – (AUD) RBA Assist Gov Bullock Speaks
- 21:45 GMT – (NZD) Trade Balance
- 22:30 GMT – (USD) FOMC Member Kashkari Speaks
The Week Ahead:
Tuesday, September 26th
- 00:00 GMT – (NZD) ANZ Business Confidence
- 06:00 GMT – (EUR) German Import Prices m/m
- 08:30 GMT – (GBP) High Street Lending
- 14:00 GMT – (USD) CB Consumer Confidence
- 14:00 GMT – (USD) New Home Sales
- 14:30 GMT – (USD) FOMC Member Brainard Speaks
- 16:45 GMT – (USD) Fed Chair Yellen Speaks
Wednesday, September 27th
- 08:00 GMT – (EUR) M3 Money Supply y/y
- 12:30 GMT – (USD) Core Durable Goods Orders m/m
- 12:30 GMT – (USD) Durable Goods Orders m/m
- 14:00 GMT – (USD) Pending Home Sales m/m
- 14:30 GMT – (USD) Crude Oil Inventories
- 15:45 GMT – (CAD) BOC Gov Poloz Speaks
- 18:00 GMT – (USD) FOMC Member Brainard Speaks
- 20:00 GMT – (NZD) Official Cash Rate
- 20:00 GMT – (NZD) RBNZ Rate Statement
Thursday, September 28th
- All Day – (EUR) German Prelim CPI m/m
- 06:35 GMT – (JPY) BOJ Gov Kuroda Speaks
- 07:00 GMT – (EUR) Spanish Flash CPI y/y
- 08:15 GMT – (GBP) BOE Gov Carney Speaks
- 09:00 GMT – (AUD) RBA Assist Gov Debelle Speaks
- 12:30 GMT – (USD) Final GDP q/q
- 12:30 GMT – (USD) Unemployment Claims
- 14:15 GMT – (USD) FOMC Member Fischer Speaks
Friday, September 29th
- Tentative– (GBP) MPC Member Broadbent Speaks
- 01:45 GMT – (CNY) Caixin Manufacturing PMI
- 06:00 GMT – (EUR) German Retail Sales m/m
- 07:00 GMT – (CHF) KOF Economic Barometer
- 08:30 GMT – (GBP) Current Account
- 08:30 GMT – (GBP) Final GDP q/q
- 08:30 GMT – (GBP) Net Lending to Individuals m/m
- 09:00 GMT – (EUR) CPI Flash Estimate y/y
- 09:00 GMT – (EUR) Core CPI Flash Estimate y/y
- 12:30 GMT – (CAD) GDP m/m
- 12:30 GMT – (CAD) RMPI m/m
- 12:30 GMT – (USD) Core PCE Price Index m/m
- 12:30 GMT – (USD) Personal Spending m/m
- 13:45 GMT – (USD) Chicago PMI
- 14:00 GMT – (USD) Revised UoM Consumer Sentiment
- 14:15 GMT – (EUR) ECB President Draghi Speaks
- 14:45 GMT – (GBP) BOE Gov Carney Speaks
- 15:00 GMT – (USD) FOMC Member Harker Speaks
Weekly Technical Outlook And Review: EUR/USD, GBP/USD, AUD/USD, USD/JPY, USD/CAD, USD/CHF, DOW 30, GOLD
A note on lower timeframe confirming price action...
Waiting for lower timeframe confirmation is our main tool to confirm strength within higher timeframe zones, and has really been the key to our trading success. It takes a little time to understand the subtle nuances, however, as each trade is never the same, but once you master the rhythm so to speak, you will be saved from countless unnecessary losing trades. The following is a list of what we look for:
- A break/retest of supply or demand dependent on which way you're trading.
- A trendline break/retest.
- Buying/selling tails ... essentially we look for a cluster of very obvious spikes off of lower timeframe support and resistance levels within the higher timeframe zone.
- Candlestick patterns. We tend to only stick with pin bars and engulfing bars as these have proven to be the most effective.
We typically search for lower-timeframe confirmation between the M15 and H1 timeframes, since most of our higher-timeframe areas begin with the H4. Stops are usually placed 1-3 pips beyond confirming structures.
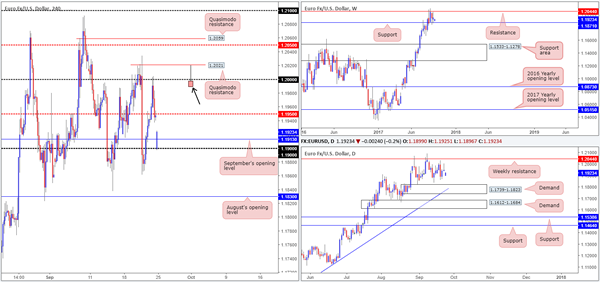
EUR/USD
Weekly gain/loss: + 7 pips
Weekly closing price: 1.1947
In recent news, Angela Merkel is set to secure her fourth term as German Chancellor after tight win over their nearest rival: the Social Democrats and their candidate Martin Schulz.
The single currency, as you can see, opened under pressure this morning. Despite the chips falling this way, a floor of support can be seen forming from the 1.19 neighborhood. As the bulls look to reassert their dominance from here, it is likely H4 price will look to immediately fill the weekend gap, bringing the major back up to the mid-level resistance 1.1950.
The story over on the bigger picture remains unchanged. On the whole, the EUR is still entrenched within a strong uptrend, but is currently seen sandwiched between weekly resistance planted at 1.2044 and weekly support at 1.1871/nearby daily demand at 1.1739-1.1823.
Suggestions: Near-term, the weekend gap will likely be filled, with resistance potentially forming from 1.1950.
Assuming 1.1950 is consumed today, the unit will likely gravitate north to reconnect with the large psychological band 1.20. For those considering shorts from 1.20, be prepared for the possibility of a fakeout. Directly above sits a H4 Quasimodo resistance at 1.2021, shadowed closely by weekly resistance at 1.2044. Both levels, in our opinion, are ideal candidates to help facilitate a fakeout above 1.20.
Instead of placing sell orders at 1.20, we will be looking for evidence that a fakeout has taken place before pulling the sell trigger. An ideal scenario would be for H4 price to print a bearish selling wick (as drawn on the chart) that pierces through 1.20, taps the noted H4 Quasimodo and closes lower. Should this trade come to fruition, stops are to be placed above the fakeout candle’s wick and the initial take-profit level would be 1.1950.
Data points to consider: German IFO business climate at 9am; ECB President Draghi speaks at 2am. Several FOMC members take to the stage today at 1.30pm, 5.40pm and 11.40pm GMT+1.
Levels to watch/live orders:
- Buys: Flat (stop loss: N/A).
- Sells: 1.20 region ([waiting for a fakeout of this number is advised before selling] stop loss: ideally beyond the fakeout candle’s wick).
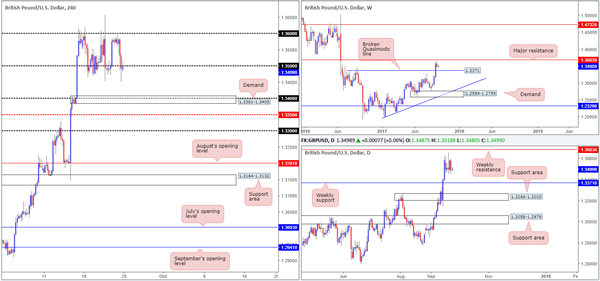
GBP/USD:
Weekly gain/loss: – 92 pips
Weekly closing price: 1.3491
On Friday, the British pound took a hit to the mid-section amid the Theresa May’s speech in Italy. The day ended with the H4 candles breaching and eventually closing beyond the 1.35 handle. Should the bears remain in the driving seat today, the next downside target on tap can be seen at demand drawn from 1.3381-1.3405, which happens to intersect with the 1.34 handle and is shadowed closely by the weekly broken Quasimodo line at 1.3371.
Suggestions: Put simply, with USDX weekly sellers trading from resistance at 11854, and GBP weekly chart showing room to advance as far as resistance at 1.3683, we may see buyers make an appearance this week. For now, however, the desk is going to continue watching H4 price action around the 1.35 boundary. Should a full, or near-full-bodied bearish candle take shape beneath here, a short could be an option down to 1.34ish.
Data points to consider: Several FOMC members take to the stage today at 1.30pm, 5.40pm and 11.40pm GMT+1.
Levels to watch/live orders:
- Buys: Flat (stop loss: N/A).
- Sells: Watch for H4 price to form a full, or near-full-bodied bearish candle below 1.35 for a sell (stop loss: ideally beyond the candle’s wick).
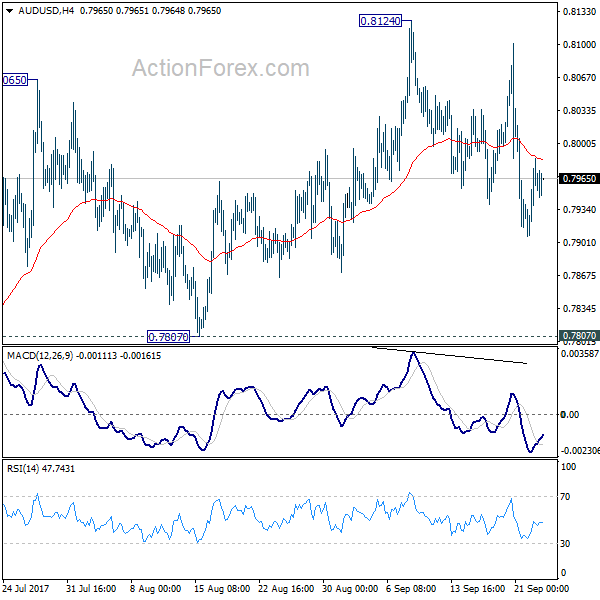
AUD/USD:
Weekly gain/loss: – 44 pips
Weekly closing price: 0.7955
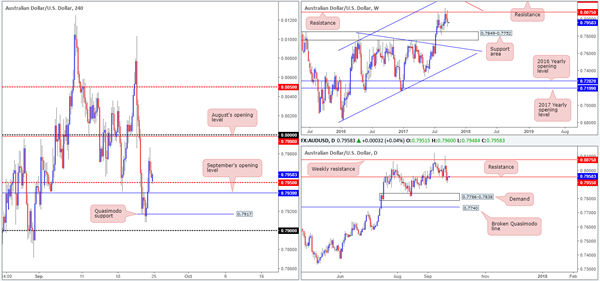
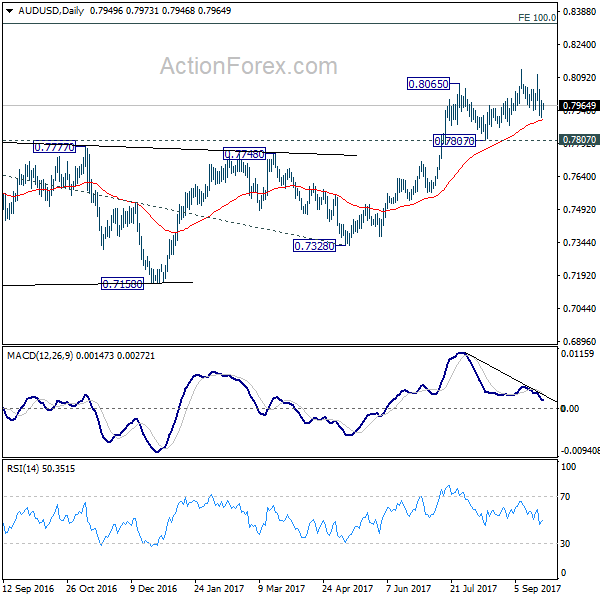
Sweeping over the weekly timeframe this morning we can see that the commodity currency extended losses last week, consequently bringing the unit ever closer to a support area carved from 0.7849-0.7752. In conjunction with the weekly timeframe, daily support at 0.7955 was taken out on Thursday and retested as resistance on Friday. Assuming that the bears hold their ground here, daily demand at 0.7786-0.7838 is likely going to be the next port of call (seen plotted within the walls of the noted weekly support area).
Across on the H4 timeframe, nevertheless, the mid-level support at 0.7950 has just been brought into play. Beneath this level, we have nearby support formed from September’s opening level at 0.7939, followed closely by a Quasimodo support at 0.7917 and the 0.79 handle.
Suggestions: Although both weekly and daily charts indicate further selling may be on the cards, shorting H4 price is a minefield due to the number of supports in view right now. For this reason, our desk will refrain from taking any short positions at this time.
Data points to consider: RBA Assist Gov. Bullock speaks at 10.15pm. Several FOMC members take to the stage today at 1.30pm, 5.40pm and 11.40pm GMT+1.
Levels to watch/live orders:
- Buys: Flat (stop loss: N/A).
- Sells: Watch for H4 price to form a full, or near-full-bodied bearish candle below 1.35 for a sell (stop loss: ideally beyond the candle’s wick).
AUD/USD:
Weekly gain/loss: – 44 pips
Weekly closing price: 0.7955
Sweeping over the weekly timeframe this morning we can see that the commodity currency extended losses last week, consequently bringing the unit ever closer to a support area carved from 0.7849-0.7752. In conjunction with the weekly timeframe, daily support at 0.7955 was taken out on Thursday and retested as resistance on Friday. Assuming that the bears hold their ground here, daily demand at 0.7786-0.7838 is likely going to be the next port of call (seen plotted within the walls of the noted weekly support area).
Across on the H4 timeframe, nevertheless, the mid-level support at 0.7950 has just been brought into play. Beneath this level, we have nearby support formed from September’s opening level at 0.7939, followed closely by a Quasimodo support at 0.7917 and the 0.79 handle.
Suggestions: Although both weekly and daily charts indicate further selling may be on the cards, shorting H4 price is a minefield due to the number of supports in view right now. For this reason, our desk will refrain from taking any short positions at this time.
Data points to consider: RBA Assist Gov. Bullock speaks at 10.15pm. Several FOMC members take to the stage today at 1.30pm, 5.40pm and 11.40pm GMT+1.
Levels to watch/live orders:
- Buys: Flat (stop loss: N/A).
- Sells: 1.2491-1.2461 area ([waiting for a reasonably sized H4 bearish candle to form – preferably a full, or near-full-bodied candle – is advised] stop loss: ideally beyond the candle’s wick).
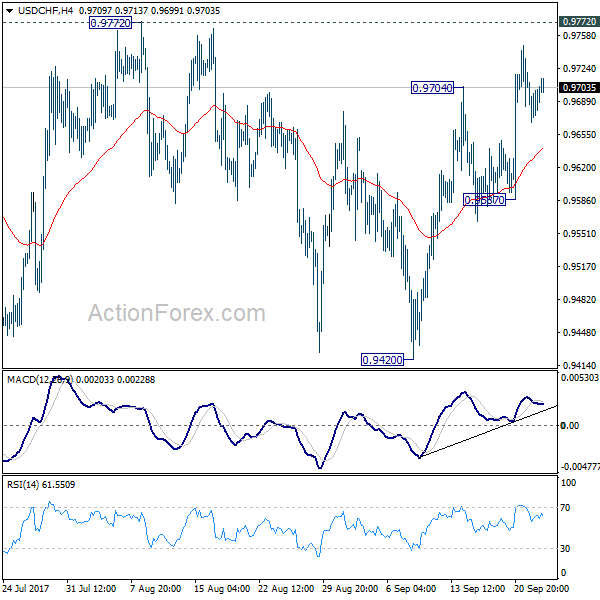
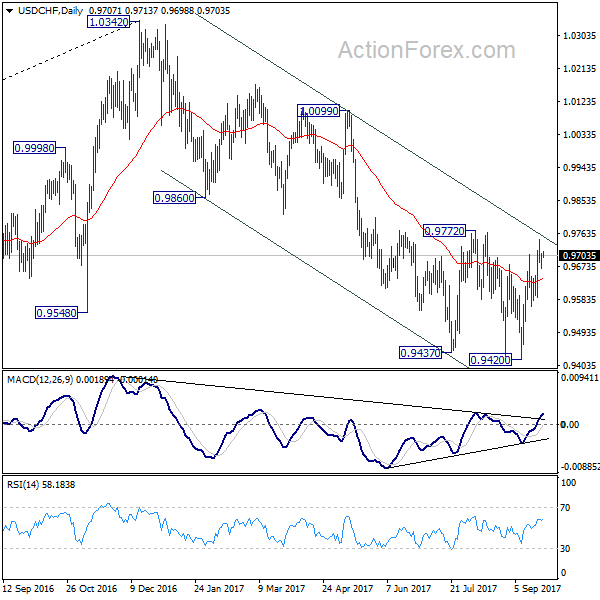
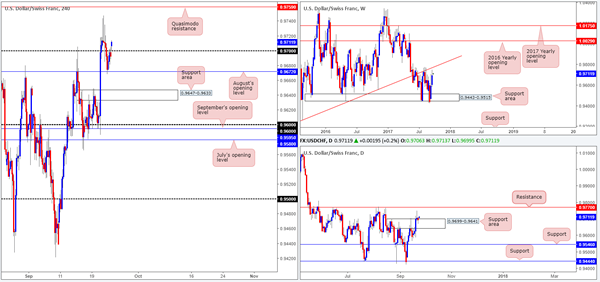
USD/CHF:
Weekly gain/loss: + 102 pips
Weekly closing price: 0.9692
Scanning the weekly timeframe this morning, the unit is seen closing in on the trendline resistance taken from the low 0.9257. Alongside this, we can also see that daily price recently closed above supply at 0.9699-0.9641, and is now being retested as a support area (demand). Providing that the bulls hold firm here, the next resistance can be seen at 0.9770, which happens to intersect with the noted weekly trendline resistance.
The Swissy opened steady this morning, gapping a minor 15 pips higher. This has, as you can see, placed H4 price above the 0.97 handle and potentially opened up the path north to a Quasimodo resistance line coming in at 0.9759.
Suggestions: Instead of trying to long the market above 0.97 when the unit is so close to testing weekly/daily structures, you could simply wait for price to challenge the noted H4 Quasimodo resistance and look to sell. Positioned just 10 pips beneath daily resistance at 0.9770 and intersecting with a weekly trendline resistance this H4 level is, in our opinion, enough to warrant a sell without the need for additional confirmation.
Data points to consider: Several FOMC members take to the stage today at 1.30pm, 5.40pm and 11.40pm GMT+1.
Levels to watch/live orders:
- Buys: Flat (stop loss: N/A).
- Sells: 0.9759 area (stop loss: 0.9776).
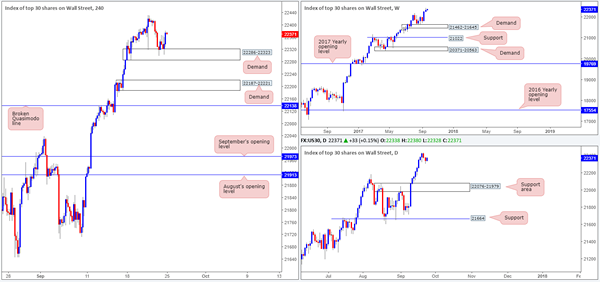
DOW 30:
Weekly gain/loss: + 82 pips
Weekly closing price: 22338
For those who read Friday’s report you may recall us highlighting the H4 demand zone at 22286-22323 as a potential buy zone. As you can see, H4 price printed a nice-looking near-full-bodied bull candle in early London on Friday from this area, which was, in our view, considered a strong buy signal. Alongside H4 price action, the other key thing to note is this market remains entrenched within a strong uptrend, and is trading from record highs as we write i.e. there is absolutely no resistance seen on the horizon!
Suggestions: With the above points in mind, our team is currently long from 22347 with a stop-loss order sited below the demand zone at 22279.
In the hope of joining the long-term trend, we intend on holding this position for now and will only look to reduce risk to breakeven once/if price achieves fresh highs.
Data points to consider: Several FOMC members take to the stage today at 1.30pm, 5.40pm and 11.40pm GMT+1.
Levels to watch/live orders:
- Buys: 22347 ([live] stop loss: 22279).
- Sells: Flat (stop loss: N/A).
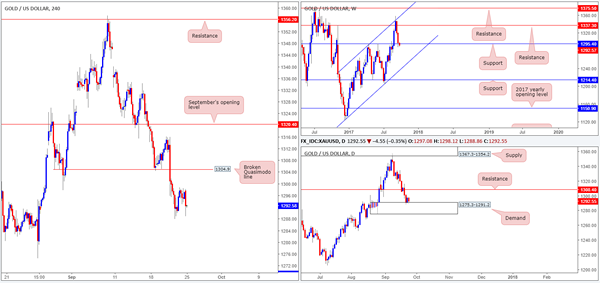
GOLD:
Weekly gain/loss: – $22.6
Weekly closing price: 1297.1
Kicking this morning’s report off with a quick look at the weekly timeframe shows price is currently seen crossing paths with support coming in at 1295.4. As you can see, the buyers have yet to register much interest here.
Sliding down to the daily timeframe, however, the candles recently connected with the top edge of a demand base logged at 1275.3-1291.2. Should the bulls hold ground here, the next upside target can be seen at resistance drawn from 1308.4. Before price can reach this level, nonetheless, daily buyers will need to contend with the H4 broken Quasimodo line at 1304.9.
Suggestions: Although a long from weekly support/daily demand looks tempting, buying into nearby H4 and daily resistances is not really our cup of tea. Along the same lines, selling at the noted H4/daily levels would, in our view, be considered courageous given the position of weekly and daily price at the moment!
On account of the above, our desk will remain on the sidelines for the time being and reassess structure going into tomorrow’s open.
Levels to watch/live orders:
- Buys: Flat (stop loss: N/A).
- Sells: Flat (stop loss: N/A).
AUD/USD Daily Outlook
Daily Pivots: (S1) 0.7916; (P) 0.7951; (R1) 0.7994; More...
Intraday bias in AUD/USD remains neutral for the moment as consolidation from 0.8124 continues. With 0.7807 support intact, outlook stays bullish for another rally. Above 0.8124 will target 100% projection of 0.6826 to 0.7833 from 0.7328 at 0.8335 next. However, considering bearish divergence condition in daily MACD, firm break of 0.7807 will indicate near term reversal and turn bias back to the downside for 0.7328 key support.
In the bigger picture, rise from 0.6826 medium term bottom is still in progress. At this point, there is no confirmation of trend reversal yet and we'll continue to treat such rebound as a corrective pattern. But in any case, break of 55 month EMA (now at 0.8090) will target 38.2% retracement of 1.1079 to 0.6826 at 0.8451. Break of 0.7807 support is needed to to be the first sign of completion of the rebound. Otherwise, further rise is now in favor.
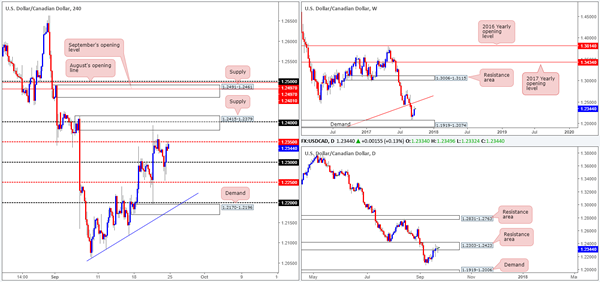
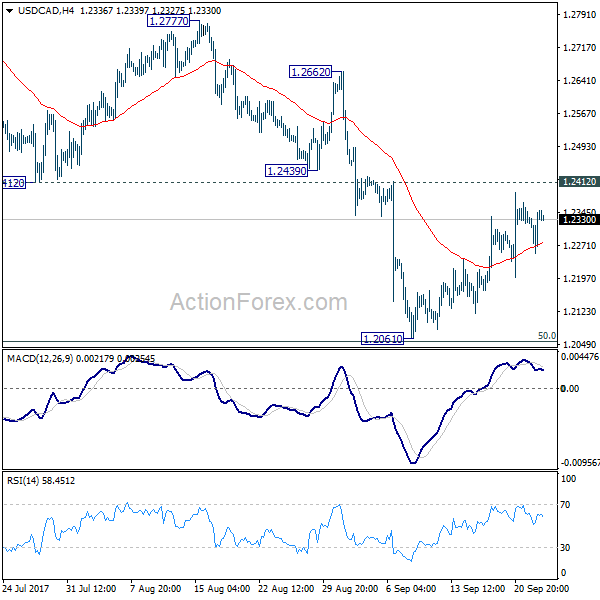
USD/CAD Daily Outlook
Daily Pivots: (S1) 1.2274; (P) 1.2313; (R1) 1.2374; More....
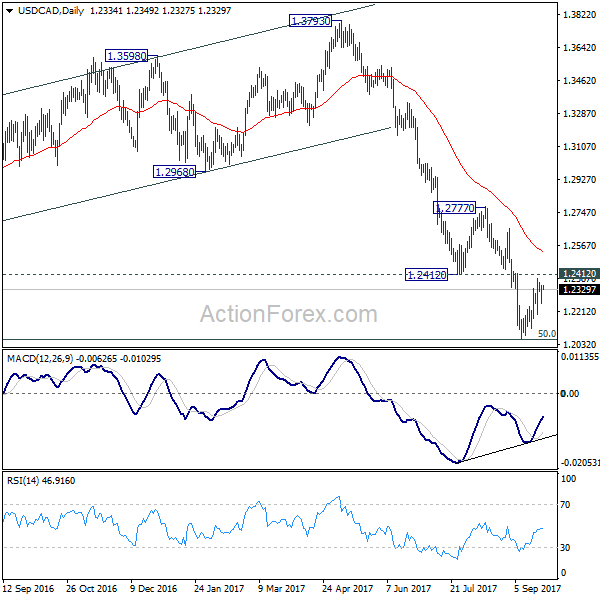
Intraday bias in USD/CAD remains neutral as consolidation from 1.2061 is still in progress. At this point, we'd remain cautious on strong support from 1.2048 to bring sustainable rebound. But still, break of 1.2439 support turned resistance is needed to be the first sign of trend reversal. Otherwise, outlook will remain bearish. Firm break of 1.2048 will pave the way to next fibonacci level at 1.1424. Break of 1.2412 will bring stronger rise back to 55 day EMA (now at 1.2531) and above.
In the bigger picture, focus remains on 50% retracement of 0.9406 to 1.4869 at 1.2048. As long as this level holds, we'd still favor that case that fall from 1.4689 is a correction. Rebound from 1.2048 could extend the larger up trend from 0.9406. However, firm break of 1.2048 will indicate that fall from 1.4689 is at least a medium term down trend and should target 61.8% retracement at 1.1424 and below.
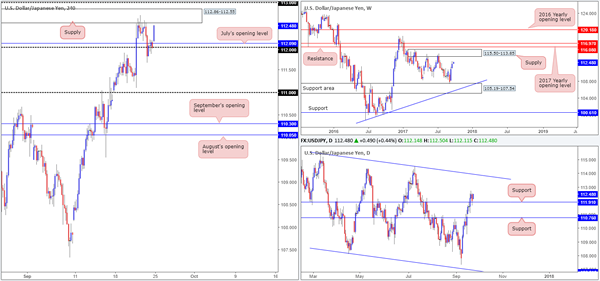
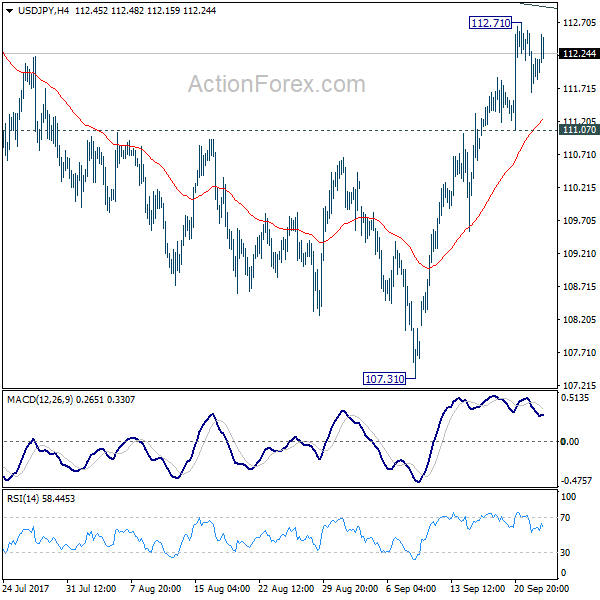
USD/JPY Daily Outlook
Daily Pivots: (S1) 111.57; (P) 112.06; (R1) 112.47; More...
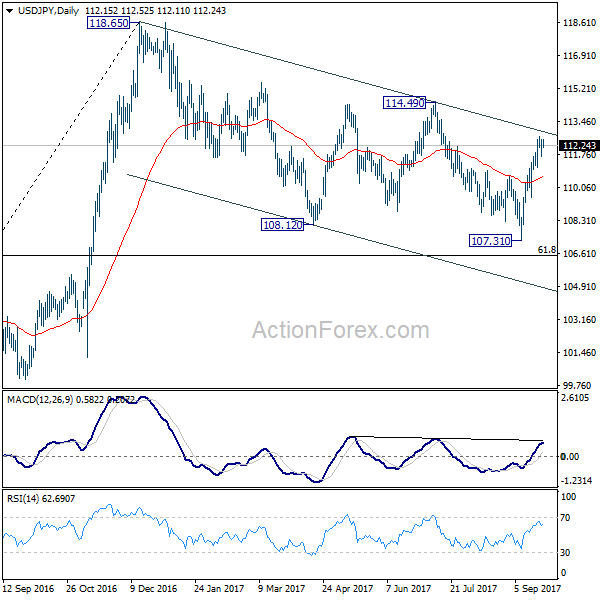
Intraday bias in USD/JPY remains neutral for the moment. Further rise is in favor with 111.07 support intact. Sustained break of medium term channel resistance (now at 113.03) will argue that whole correction from 118.65 has completed. In that case, further rise should be seen to 114.49 resistance for confirmation. However, break of 111.07 minor support will raise the risk of rejection from channel resistance and turn bias back to the downside for 55 day EMA (now at 110.64) and below.
In the bigger picture, rise from 98.97 (2016 low) is seen as the second leg of the corrective pattern from 125.85 (2015 high). It's unclear whether this this second leg has completed at 118.65 or not. But medium term outlook will be mildly bearish as long as 114.49 resistance holds. And, there is prospect of breaking 98.97 ahead. Meanwhile, break of 114.49 will bring retest of 125.85 high. But even in that case, we don't expect a break there on first attempt.
USD/CHF Daily Outlook
Daily Pivots: (S1) 0.9670; (P) 0.9689; (R1) 0.9711; More....
Intraday bias in USD/CHF remains neutral for the moment. On the upside decisive break of 0.9772 resistance will suggest that whole down trend form 1.0342 has completed. In that case, near term outlook will be turned bullish for 0.9860/1.0099 resistance zone. Nonetheless, with 0.9772 resistance intact, outlook remains bearish. Below 0.9587 minor support will turn bias back to the downside for retesting 0.9420 low.
In the bigger picture, current development suggests that 0.9443 key support (2016 low) could be taken out firmly as down trend form 1.0342 extends. There are various interpretation of the price actions. But in any case, medium term outlook will stay bearish as long as 0.9772 resistance holds. Current down trend could extend to 38.2% retracement of 0.7065 (2011 low) to 1.0342 (2016 high) at 0.9090. However, break of 0.9772 will indicate that USD/CHF has successfully defended 0.9443 again and turn outlook bullish for 1.0099 resistance.