Sample Category Title
EURUSD Fresh Weakness Has formed Head & Shoulders Pattern
The Federal Reserve did not disappoint those who were waiting for hawkish stance and firmer signals about central bank's next steps in coming few months.
As conclusion of FOMC's September meeting, US policymakers announced they left interest rates unchanged at 1.25%, as widely expected outcome, but signalled one more rate hike towards the end of the year and three more hikes in 2018.
Fed also announced the beginning of reduction of its massive portfolio as from October.
Hawkish signals from Fed put the dollar under increased pressure, in rather expected action in such scenario.
The Euro spiked to the session high at 1.2033 in a nervous pre-announcement trading, but quickly lost ground after FOMC delivered their verdict.
The EURUSD pair slipped below 1.1900 in initial sell-off, which retraced over 61.8% of 1.1837/1.2033 recovery leg and turned near-term bias with bears.
Further extension lower dented another important support at 1.1877 (daily Tenkan-sen) loss of which would generate further bearish signal.
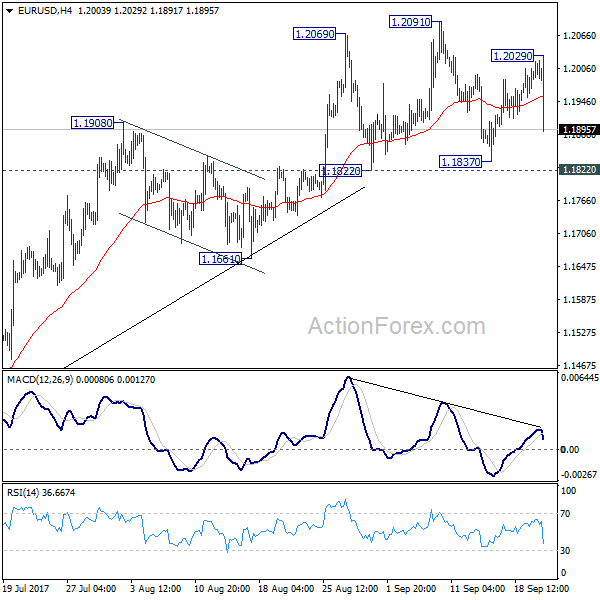
Fresh weakness has formed Head & Shoulders pattern on daily chart and exposed its neckline at 1.1837, with sustained break here, now seen as very likely scenario, expected to generate stronger reversal signal for bearish extension towards daily cloud top at 1.1792 and 17 Aug trough at 1.1662.
Res: 1.1877; 1.1915; 1.1964; 1.2000
Sup: 1.1837; 1.1792; 1.1740; 1.1662
Dollar Surges as Fed Keeps Intererst Rate Projections Unchanged, EUR/USD Forming Head and Shoulder Top
Dollar jumps after FOMC kept the target range of federal funds rate at 1.00-1.25% as widely expected. Fed also confirmed that the balance sheet normalization program will be initiated in October. The Dollar positive parts of the announcement are firstly, GDP growth projection for 2017 and 2019 are revised up. Secondly, unemployment rate forecast for 2018 and 2019 are revised down. Federal fund rates projection for 2017 and 2018 are kept unchanged. That indicates Fed is still on course for another rate hike this year and three hikes next year. Nonetheless, core PCE projection for 2017 and 2018 are both revised down.
In the accompanying statement, Fed tried to talk down the impact of hurricanes Harvey, Irma and Maria. It noted that "past experience suggests that the storms are unlikely to materially alter the course of the national economy over the medium term." Meanwhile, " higher prices for gasoline and some other items in the aftermath of the hurricanes will likely boost inflation temporarily". Still, "inflation on a 12-month basis is expected to remain somewhat below 2 percent in the near term but to stabilize around the Committee's 2 percent objective over the medium term."
Below is a summary of Fed's new median projections.
EUR/USD is still holding above 1.1822/37 support zone, for the moment. However, the pair could now be completing and head and shoulder top reversal pattern (ls: 1.2069, h: 1.2091, rs: 1.2029). Break of 1.1822/1837 support zone, together with bearish divergence condition in 4 hour MACD, will indicate near term reversal. That is, EUR/USD could then correct whole medium term rise fro 1.0339 and target 1.1661 support and below.
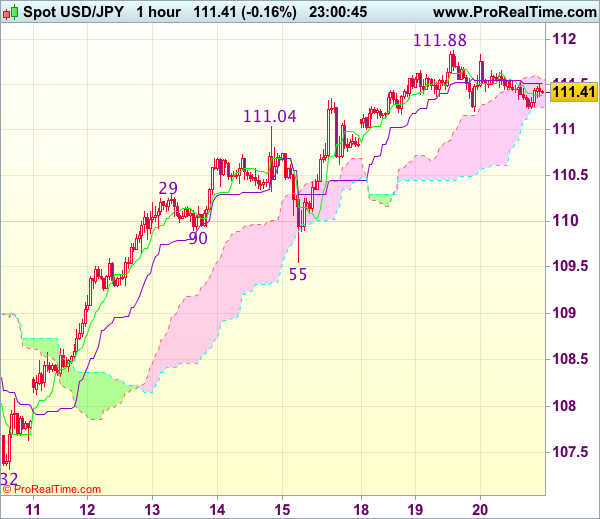
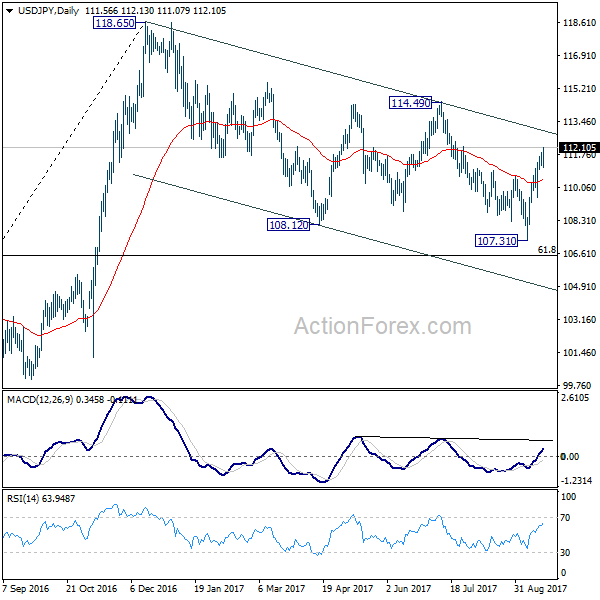
USD/JPY resumes recent rally and breaks through 111.87 temporary top. Intraday bias is back to the upside, current rise should target medium term channel resistance at 112.87 next.
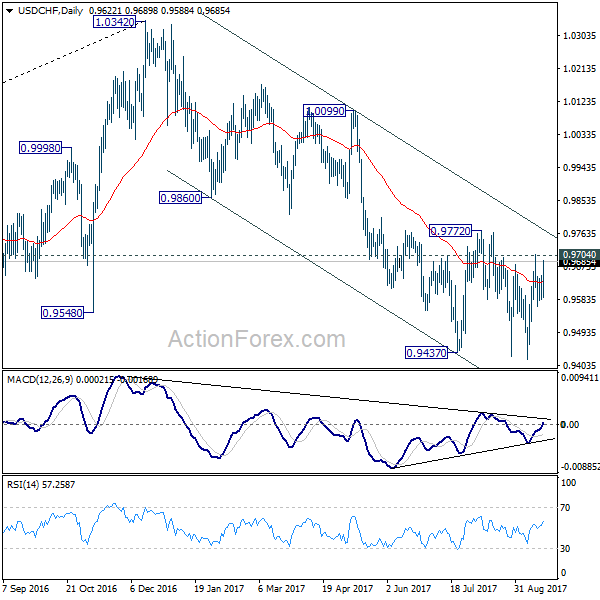
USD/CHF's strong rise now put 0.9704 resistance in focus. Break will target 0.9772 key resistance next. And decisive break there will confirm trend reversal.
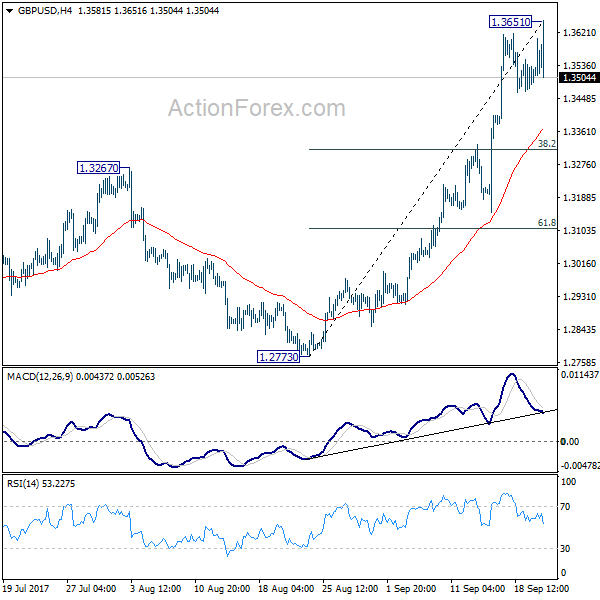
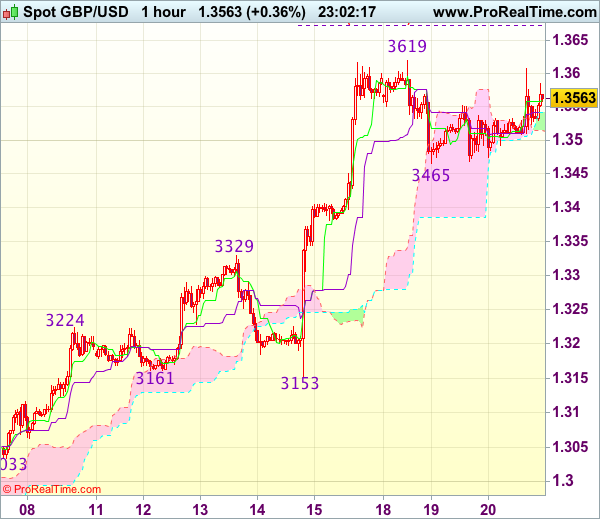
GBP/USD edged higher to 1.3651 earlier today but dips sharply after FOMC. The development suggest that more corrective trading should be seen in near term. And GBP/USD could dip further to 4 hour 55 EMA (now at 1.3369) before staging another rise.
(FED) FOMC Statement September 20, 2017
Information received since the Federal Open Market Committee met in July indicates that the labor market has continued to strengthen and that economic activity has been rising moderately so far this year. Job gains have remained solid in recent months, and the unemployment rate has stayed low. Household spending has been expanding at a moderate rate, and growth in business fixed investment has picked up in recent quarters. On a 12-month basis, overall inflation and the measure excluding food and energy prices have declined this year and are running below 2 percent. Market-based measures of inflation compensation remain low; survey-based measures of longer-term inflation expectations are little changed, on balance.
Consistent with its statutory mandate, the Committee seeks to foster maximum employment and price stability. Hurricanes Harvey, Irma, and Maria have devastated many communities, inflicting severe hardship. Storm-related disruptions and rebuilding will affect economic activity in the near term, but past experience suggests that the storms are unlikely to materially alter the course of the national economy over the medium term. Consequently, the Committee continues to expect that, with gradual adjustments in the stance of monetary policy, economic activity will expand at a moderate pace, and labor market conditions will strengthen somewhat further. Higher prices for gasoline and some other items in the aftermath of the hurricanes will likely boost inflation temporarily; apart from that effect, inflation on a 12-month basis is expected to remain somewhat below 2 percent in the near term but to stabilize around the Committee's 2 percent objective over the medium term. Near-term risks to the economic outlook appear roughly balanced, but the Committee is monitoring inflation developments closely.
In view of realized and expected labor market conditions and inflation, the Committee decided to maintain the target range for the federal funds rate at 1 to 1-1/4 percent. The stance of monetary policy remains accommodative, thereby supporting some further strengthening in labor market conditions and a sustained return to 2 percent inflation.
In determining the timing and size of future adjustments to the target range for the federal funds rate, the Committee will assess realized and expected economic conditions relative to its objectives of maximum employment and 2 percent inflation. This assessment will take into account a wide range of information, including measures of labor market conditions, indicators of inflation pressures and inflation expectations, and readings on financial and international developments. The Committee will carefully monitor actual and expected inflation developments relative to its symmetric inflation goal. The Committee expects that economic conditions will evolve in a manner that will warrant gradual increases in the federal funds rate; the federal funds rate is likely to remain, for some time, below levels that are expected to prevail in the longer run. However, the actual path of the federal funds rate will depend on the economic outlook as informed by incoming data.
In October, the Committee will initiate the balance sheet normalization program described in the June 2017 Addendum to the Committee's Policy Normalization Principles and Plans.
Voting for the FOMC monetary policy action were: Janet L. Yellen, Chair; William C. Dudley, Vice Chairman; Lael Brainard; Charles L. Evans; Stanley Fischer; Patrick Harker; Robert S. Kaplan; Neel Kashkari; and Jerome H. Powell.
Elliott Wave Analysis: EURCHF
Good day traders!
EURCHF is at new highs after recent nice triangle consolidation that completed wave 4 earlier this month. We can see nice move up now which can be wave 5 headed to 1.1700 about we already discussed in August.
EURCHF, Daily
Markets On Stand by for Yellen Speech
The focus of the market today will be the FOMC statement on monetary policy that will be published at 18:00 GMT. Investors do not expect a rate hike today, but the US central bank may decide to start reducing its balance sheet from the current 4.5 trillion dollars. Details about the timing and the scale of balance sheet cuts may influence investor sentiment. Traders will also be monitoring the FOMC economic projections that will also be released at 18:00 GMT. A spike in volatility is predicted after the Fed's chairwoman Janet Yellen's speech during which she may outline the Fed's opinion about the recent acceleration of inflation and the labor market data missing forecasts. In case of hawkish rhetoric, we may see a massive selloff of the EUR/USD. Some pressure on the greenback came from the existing home sales report, according to which the indicator has fallen to 5.35 million in August against the 5.46 million forecasted.
The USD/JPY retreated downwards amid profit taking ahead of the FOMC statement and from the Japanese trade surplus report that showed 0.37 trillion yen in August versus the 0.41 trillion yen expected. The demand for the yen as a defensive asset may rise in case of geopolitical tensions grow or if the stock markets take a dip. Traders are also waiting for the Monetary policy statement from the Bank of Japan at 03:00 GMT tomorrow.
Another important event investors should be on the lookout for this evening is the GDP report in New Zealand that will be published at 22:45 and may partially offset the influence of the FOMC statement on the NZD/USD.
EUR/USD
The EUR/USD quotes are consolidating near the 1.2000 level and keep moving within the local rising channel. After the end of the current sideways movement there is a high possibility of sharp moves. Breaking through the lower limit of the channel may result in drops to 1.1925 and 1.1825. On the other hand, the price may resume upward dynamics with the first goal at 1.2070.
USD/JPY
The USD/JPY was not able to gain a foothold above the 111.70 mark and rolled back. We do not exclude the growth resuming with potential upsides to 113.00 and 114.70. Breaking through the closest support at 111.00 will likely force the bears to pull the pair down with possible objectives at 110.30 and 109.60. Volatility is likely to rise soon.
NZD/USD
The NZD/USD is testing the local resistance at 0.7375 and its overcoming will help the bulls to push the quotes up to 0.7400 and the upper boundary of the local ascending channel. The RSI on the 15-minute chart approached the overbought zone, indicating a possible downward correction in the near future. The immediate goals in case of a fall may be located in the 0.7250-0.7300 range.
US: Existing Home Sales Continue Losing Streak as Harvey Weighs on Activity
Existing home sales continued to slide in August, falling 1.7% to 5.35 million (annualized), marking the fourth decline in five months. The headline print disappointed market expectations which called for a moderate uptick of 0.2% on the month.
The decline was concentrated in the single-family segment where transactions fell by 2.1% to 4.74 million, from 4.84 million in the month prior. Meanwhile, sales in the smaller condo/co-op segment managed to edge higher, rising 1.7% to 610 thousand.
Regional performances were mixed, as resale activity pulled back sharply in the South (-5.7%) given the likely impact from Hurricane Harvey in southeast Texas and West (-4.8%), while improving in the Midwest (+2.4%) and soaring in Northeast (+10.8%).
The inventory of homes available for sale fell by a seasonally unadjusted 2.1% on the month and remained low at 1.88 million – down 6.5% from year-ago levels. At the current sales pace, inventory accounts for just 4.2 months' worth of supply compared to 4.5 a year ago – well below the six months' of sales considered a balanced market.
Despite the low inventory, the upward pressure on median home prices moderated slightly, with prices advancing by 5.6% y/y compared to 6.1% in the month prior.
First-time homebuyers accounted for 31% of sales. This was down from 33% in the month prior but unchanged from year-ago. Meanwhile, homes typically stayed on the market for 30 days – unchanged from last month but down from year-ago (36 days).
Key Implications
This marks another disappointing report, with existing home sales now having contracted for three consecutive months. Although Hurricane Harvey, which disrupted activity in the last week of August, is partly to blame for this month's weakness, low inventory levels nationwide are one of the main culprits behind the weakening trend.
Resale activity is likely to go through some turbulence in the near-term, as the combined impacts of Hurricane Harvey and Irma likely weigh on the upcoming September report. However, we expect some respite in the fourth quarter as those impacts fade.
Further out, sales momentum should advance at a more steady pace, with demand for homes supported by continued job and income gains. Low inventories will continue to keep a lid on activity, but fast-rising prices that help encourage existing homeowners to put their homes on the market and increased homebuilding should provide some relief on that front. Having said that, both of these are likely to be gradual.
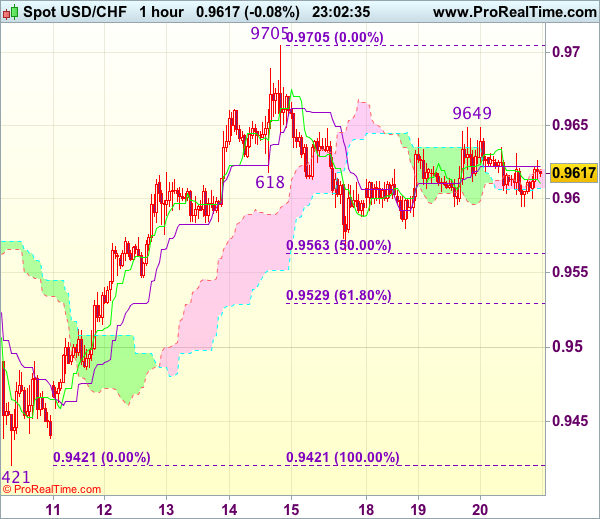
Trade Idea Wrap-up: USD/CHF – Hold short entered at 0.9625
USD/CHF - 0.9629
Most recent candlesticks pattern : N/A
Trend : Near term up
Tenkan-Sen level : 0.9613
Kijun-Sen level : 0.9622
Ichimoku cloud top : 0.9620
Ichimoku cloud bottom : 0.9607
Original strategy :
Sold at 0.9625, Target: 0.9525, Stop: 0.9650
Position : - Short at 0.9625
Target : - 0.9525
Stop : - 0.9650
New strategy :
Hold short entered at 0.9625, Target: 0.9525, Stop: 0.9650
Position : - Short at 0.9625
Target : - 0.9525
Stop : - 0.9650
The greenback has continued meeting resistance at 0.9649 and has remained locked within familiar range, retaining our view that further consolidation would take place and as long as said resistance at 0.9649 holds, mild downside bias remains for another fall towards 0.9563-65 (50% Fibonacci retracement of 0.9421-0.9705 and Friday’s low), break there would add credence to our view that top has been formed at 0.9705, bring further weakness to 0.9525-30 (61.8% Fibonacci retracement), however, downside should be limited to 0.9500 and 0.9480-85 should hold from here.
In view of this, we are holding on to our short position entered at 0.9625. Above 0.9649 would defer and risk rebound to 0.9675-80, break there would signal the pullback from 0.9705 has ended, bring retest of this level, a breach of this last week’s high would extend recent rise from 0.9421 to 0.9740-50 later.
Trade Idea Wrap-up: GBP/USD – Stand aside
GBP/USD - 1.3557
Most recent candlesticks pattern : N/A
Trend : Up
Tenkan-Sen level : 1.3559
Kijun-Sen level : 1.3541
Ichimoku cloud top : 1.3542
Ichimoku cloud bottom : 1.3514
New strategy :
Stand aside
Position : -
Target : -
Stop : -
The British pound has remained confined within near term established range and further consolidation would take place, although risk of another corrective fall towards support at 1.3465 remains, break there is needed to signal a temporary top has been formed at 1.3619, bring retracement of recent upmove to 1.3430 and later towards 1.3400 but reckon 1.3375-80 would hold from here.
On the upside, whilst recovery to 1.3570-75 cannot be ruled out, break of 1.3605-10 is needed to signal the pullback from 1.3619 has ended, bring retest of this level first, break there would extend recent upmove towards 1.3650 later. As near term outlook has turned mixed, would be prudent to stand aside in the meantime.
Trade Idea Wrap-up: EUR/USD – Hold long entered at 1.1970
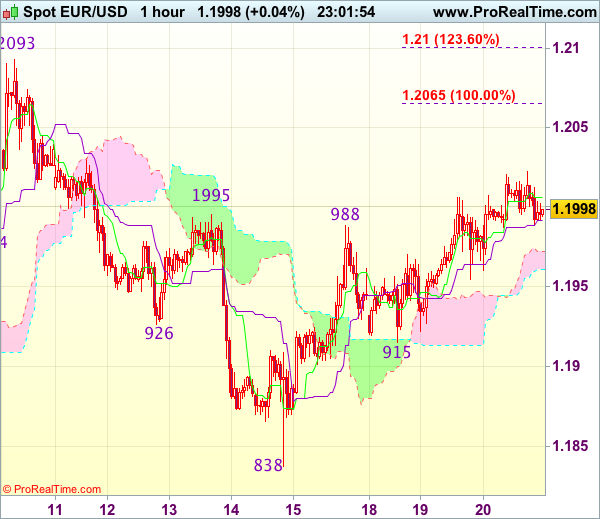
EUR/USD - 1.1987
Most recent candlesticks pattern : N/A
Trend : Sideways
Tenkan-Sen level : 1.2003
Kijun-Sen level : 1.1991
Ichimoku cloud top : 1.1972
Ichimoku cloud bottom : 1.1961
Original strategy :
Bought at 1.1970, Target: 1.2070, Stop: 1.1950
Position : - Long at 1.1970
Target : - 1.2070
Stop : - 1.1950
New strategy :
Hold long entered at 1.1970, Target: 1.2070, Stop: 1.1950
Position : - Long at 1.1970
Target : - 1.2070
Stop : - 1.1950
Yesterday’s breach of indicated resistance at 1.1995-00 (previous resistance and 61.8% Fibonacci retracement of 1.2093-1.1838) adds credence to our view that the fall from 1.2093 top has ended at 1.1838 last week and consolidation with upside bias remains for further gain to 1.2030-35, then 1.2050-55, however, break of 1.2070 is needed to signal early upmove has resumed for retest of 1.2093 first.
In view of this, we are holding on to our long position entered at 1.1970. Below 1.1950-55 would defer and risk weakness towards support at 1.1915 (Monday’s low) but only break there wold signal the rebound from 1.1838 has ended instead, bring further fall to 1.1880.
Trade Idea Wrap-up: USD/JPY – Buy at 110.70
USD/JPY - 111.39
Most recent candlesticks pattern : N/A
Trend : Up
Tenkan-Sen level : 111.38
Kijun-Sen level : 111.52
Ichimoku cloud top : 111.57
Ichimoku cloud bottom : 111.25
Original strategy :
Buy at 110.70, Target: 111.70, Stop: 110.35
Position : -
Target : -
Stop : -
New strategy :
Buy at 110.70, Target: 111.70, Stop: 110.35
Position : -
Target : -
Stop : -
Dollar’s retreat after rising to 111.88 yesterday has retrained our view that minor consolidation below this level would be seen and pullback to 111.00 cannot be ruled out, however, reckon 110.60-70 would limit downside and bring another rise later, above said resistance would extend recent upmove to 112.00, then 112.20 (previous resistance) but near term overbought condition should prevent sharp move beyond 112.40-45.
In view of this, would not chase this move here and would be prudent to buy dollar on subsequent pullback as 110.60-70 should limit downside. Below 110.45-50 would abort and signal a temporary top is formed instead, risk correction to 110.30, then towards 110.00 which is likely to hold from here.