Sample Category Title
GBP/USD Daily Outlook
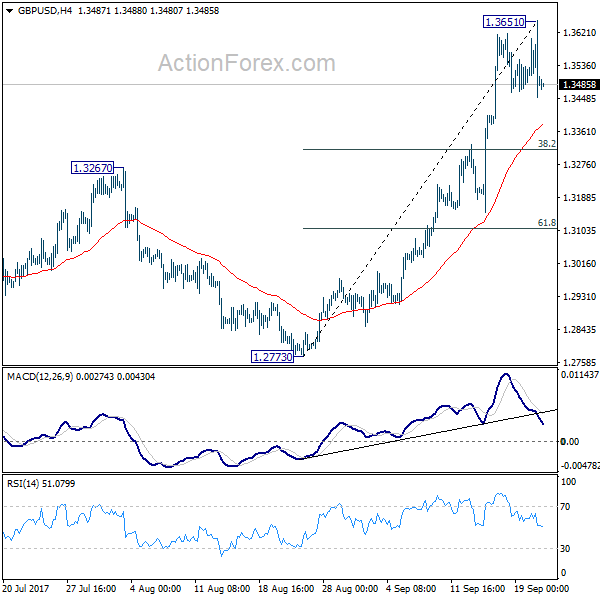
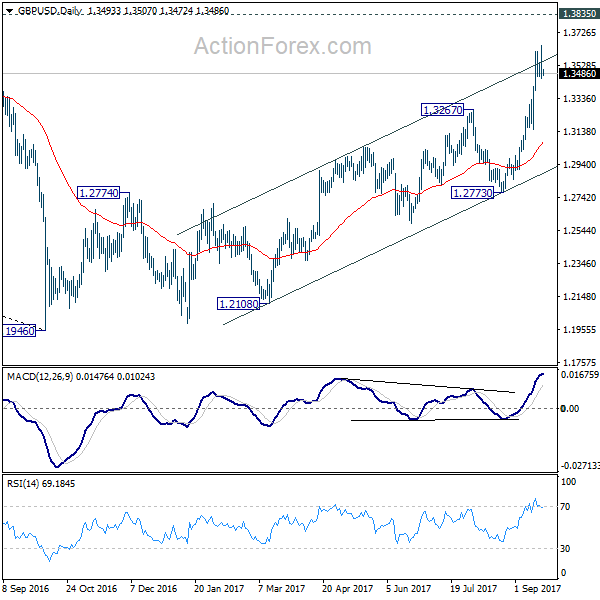
Daily Pivots: (S1) 1.3412; (P) 1.3533; (R1) 1.3616; More....
GBP/USD edged higher to 1.3651 but quickly retreated back into established range. Intraday bias stays neutral for more consolidations. In case of deeper fall, downside should be contained by 38.2% retracement of 1.2773 to 1.3651 at 1.3316 and bring rise resumption. Above 1.3651 will turn bias back to the upside for 1.3835 support turned resistance next. Break there will target 55 month EMA (now at 1.4405).
In the bigger picture, the strong break of 1.3444 key resistance now argues that the long term trend in GBP/USD has reversed. That is a key bottom was formed back in 1.1946 on bullish convergence condition in monthly MACD. Current rise from 1.1946 will target 38.2% retracement of 2.1161 (2007 high) to 1.1946 (2016 low) at 1.5466 next. In any case, medium term outlook will now stay bullish as long as 1.2773 support holds.
USD/CHF Daily Outlook
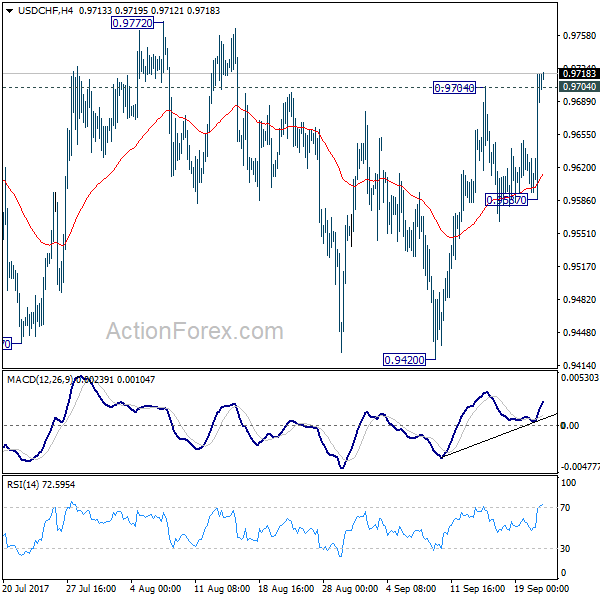
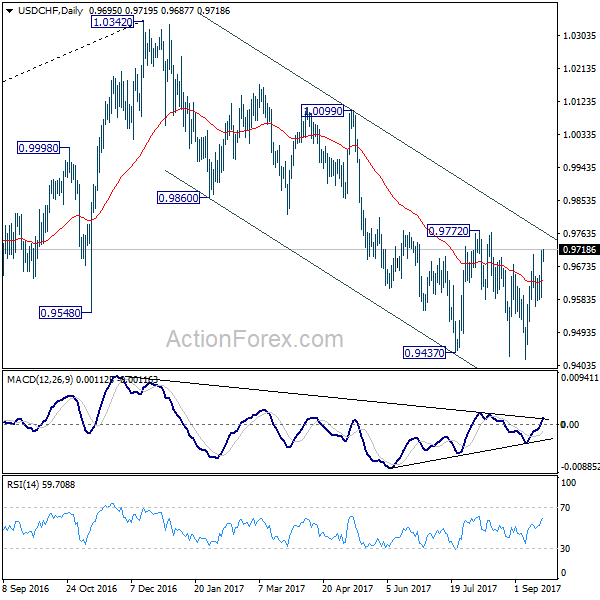
Daily Pivots: (S1) 0.9617; (P) 0.9667; (R1) 0.9747; More....
USD/CHF's rebound from 0.9420 resumed by taking out 0.9704 resistance. Intraday bias is now back on the upside for 0.9772 key resistance next. Decisive break there will suggest that whole down trend form 1.0342 has completed. In that case, near term outlook will be turned bullish for 0.9860/1.0099 resistance zone. Nonetheless, with 0.9772 resistance intact, outlook remains bearish. Below 0.9587 minor support will turn bias back to the downside for 0.9420 low.
In the bigger picture, current development suggests that 0.9443 key support (2016 low) could be taken out firmly as down trend form 1.0342 extends. There are various interpretation of the price actions. But in any case, medium term outlook will stay bearish as long as 0.9772 resistance holds. Current down trend could extend to 38.2% retracement of 0.7065 (2011 low) to 1.0342 (2016 high) at 0.9090. However, break of 0.9772 will indicate that USD/CHF has successfully defended 0.9443 again and turn outlook bullish for 1.0099 resistance.
USD/JPY Daily Outlook
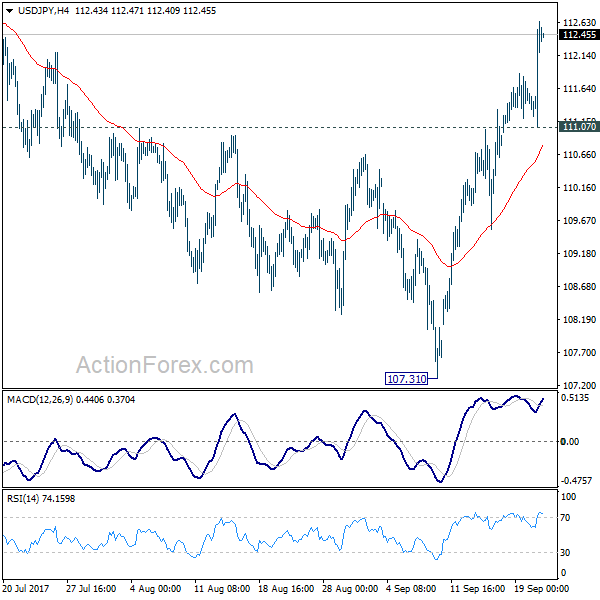
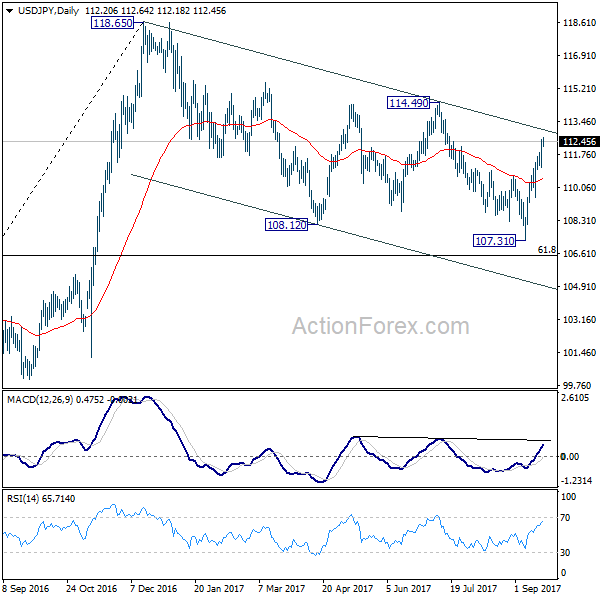
Daily Pivots: (S1) 111.23; (P) 111.55; (R1) 111.92; More...
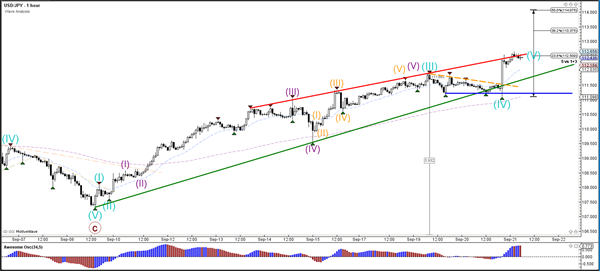
USD/JPY's rally from 107.31 extends to as high as 112.62 so far. Intraday bias is back on the upside for medium term channel resistance (now at 113.03). Sustained break there will argue that whole correction from 118.65 has completed too. In that case, further rise should be seen to 114.49 resistance for confirmation. On the downside, below 111.07 minor resistance will raise the risk of rejection from channel resistance and turn bias back to the downside for 55 day EMA (now at 110.53).
In the bigger picture, rise from 98.97 (2016 low) is seen as the second leg of the corrective pattern from 125.85 (2015 high). It's unclear whether this this second leg has completed at 118.65 or not. But medium term outlook will be mildly bearish as long as 114.49 resistance holds. And, there is prospect of breaking 98.97 ahead. Meanwhile, break of 114.49 will bring retest of 125.85 high. But even in that case, we don't expect a break there on first attempt.
Dollar Firm after Hawkish FOMC, BoJ Dove Not Too Dovish
The financial markets responded to Fed's hawkish announcement overnight rather positively. DOW gained 41.79 pts or 0.19% to close at 22412.59. S&P 500 rose 1.59 pts or 0.06% to end at 2508.25. Both indices made new record high. In short, Fed's new economic projections showed that policymakers are still projecting another rate hike in December, and three more next year. Fed fund futures are pricing in 73.4% chance of a December hike, comparing to 57.7% chance a day ago, and 48.6% a week ago. 10 year yield rose 0.034 to close at 2.277, extend recent rebound from 2.034. Dollar is now trading as one of strongest for the week among Aussie and Kiwi. Yen and Swiss Franc are trading as the softest ones. Gold dipped lower and breached 1300 handle following Dollar's strength.
The Fed finally made formal announcement that it would begin normalizing the balance sheet in October. As indicated in June, the process does not involve active selling of securities, but a passive run-off of its holdings. The policy rate also stayed unchanged at 1-1.25%. The overall tone of the statement and the press conference came in more hawkish than expected. Despite downward revision in the core CPI for this year, the staff upgraded the economic growth outlook and downgraded the unemployment rate forecast.
The median dot plot continued to project one more rate hike this year, followed by three more increases in 2018. As CME's 30-day Fed funds futures suggested, bets for a December hike markedly jumped to 73.4% from 57.7% in the prior day. The overall tone signaled that the Fed is committed to carry on the rate hike schedule (three increases for 2017) as indicated earlier this year. Barring a 'material' change in the economic outlook, the Fed should implement its rate hike and balance sheet normalization policies any planned. More in Fed To Reduce Balance Sheet From October, Committed To One More Rate Hike This Year.
More on FOMC:
- FOMC Review: Unchanged Hiking Signals As QT Is Set To Begin Next Month
- FOMC: Gauging Normality For Investors: Real Rates Positive
- Fed Announces Tapering But No Rate Hike; Unchanged Dots Seen as Hawkish
- FOMC Leaves Rates Unchanged and Sticks to its Plans to Gradually Unwind Balance Sheet
BoJ dove not that dovish
BoJ left monetary policy unchanged today as widely expected. Short term policy interest is kept at -0.1%. And the central bank will continue to dive 10 year JGB rate at around 0%. Annual pace of monetary base expansion is kept at JPY 80T under the yield curve control framework. The biggest surprise for the decision is that new comer Goushi Kataoka dissented as he believed that "monetary easing effects gained from the current yield curve were not enough for 2 percent inflation to be achieved around fiscal 2019". And Kataoka also "opposed the description on the outlook for the CPI" as " possibility of the rate of change increasing toward 2 percent from 2018 onward was low at this point."
But after all, Kataoka's dovish voice is indeed not much of a surprise. He has been considered a vocal, firm advocate of aggressive monetary easing. And he's believed to be brought in by Prime Minister Shinzo Abe to replace the relatively hawkish voice of former policymaker Takahide Kiuchi and Takehiro Sato. One could even argue that it's actually a surprise that Kataoka is not dovish enough to push for rate cut of expanding the QQE program.
ECB Knot urged decisive rebalancing away from non-standard measures
In Eurozone, ECB Governing Council member Klass Knot said that "the main rationale for central bank asset purchases has disappeared." And, "the appreciation of the euro should be considered a reflection of the relative strength and stability of the euro area economy." He said that is a " clear indicator of the factors that underlie the reduced necessity of continued asset purchases ... supporting the call for a gradual but decisive rebalancing away from non-standard towards traditional instruments of monetary policy." But he emphasized that ending stimulus could pose some challenges by there is "no reason to be overly dramatic".
South Korea approved USD 8m humanitarian aid to North
US ally South Korea approved a USD 8m of aid to North Korea's children and pregnant women. The South suspended humanitarian aid to the North after the latter conducted its fourth nuclear test back in January 2016. But now, the government had decided to support programs by the United Nations Children's Fund and the UN World Food Program in providing food and medicines to the North. The South's Unification Ministry emphasized that the cash is not included in the assistance, and there is "realistically no possibility" that the North could use it to support its military.
North Korea responded to US President Donald Trump's threat to totally destroy the country if the US and its allies are threatened. North's Foreign Minister Ri Yong-ho told reporters near the United Nations headquarters that "even when dogs bark, the parade goes on". And, "if [Trump] was thinking about surprising us with the sound of a barking dog then he is clearly having a dog dreaming."
China's Foreign Minister Want Yi warned that the situation in the Korean peninsula is getting more serious day by day. And Wang said "we call on all parties to be calmer than calm and not let the situation escalate out of control." China's official newspaper also criticized that "Trump's political chest-thumping is unhelpful, and it will only push the DPRK to pursue even riskier policies, because the survival of the regime is at stake."
On the data front
New Zealand GDP grew 0.8% qoq in Q2, in line with expectation. Swiss trade balance and UK public sector net borrowing are the main feature in European session. US will release jobless claims, Philly Fed survey, house price index and leading indicators later in the day.
USD/JPY Daily Outlook
Daily Pivots: (S1) 111.23; (P) 111.55; (R1) 111.92; More...
USD/JPY's rally from 107.31 extends to as high as 112.62 so far. Intraday bias is back on the upside for medium term channel resistance (now at 113.03). Sustained break there will argue that whole correction from 118.65 has completed too. In that case, further rise should be seen to 114.49 resistance for confirmation. On the downside, below 111.07 minor resistance will raise the risk of rejection from channel resistance and turn bias back to the downside for 55 day EMA (now at 110.53).
In the bigger picture, rise from 98.97 (2016 low) is seen as the second leg of the corrective pattern from 125.85 (2015 high). It's unclear whether this this second leg has completed at 118.65 or not. But medium term outlook will be mildly bearish as long as 114.49 resistance holds. And, there is prospect of breaking 98.97 ahead. Meanwhile, break of 114.49 will bring retest of 125.85 high. But even in that case, we don't expect a break there on first attempt.
Economic Indicators Update
| GMT | Ccy | Events | Actual | Forecast | Previous | Revised |
|---|---|---|---|---|---|---|
| JPY | BoJ Monetary Policy Statement | |||||
| 22:45 | NZD | GDP Q/Q Q2 | 0.80% | 0.80% | 0.50% | 0.60% |
| 4:30 | JPY | All Industry Activity Index M/M Jul | -0.10% | 0.40% | ||
| 5:45 | CHF | SECO Economic Forecasts | ||||
| 6:00 | CHF | Trade Balance (CHF) Aug | 2.41B | 3.51B | ||
| 8:00 | EUR | ECB Economic Bulletin | ||||
| 8:30 | GBP | Public Sector Net Borrowing (GBP) Aug | 6.5B | -0.8B | ||
| 12:30 | CAD | Wholesale Sales M/M Jul | -0.90% | -0.50% | ||
| 12:30 | USD | Initial Jobless Claims (SEP 16) | 302K | 284K | ||
| 12:30 | USD | Philadelphia Fed Business Outlook Sep | 17.5 | 18.9 | ||
| 13:00 | USD | House Price Index M/M Jul | 0.40% | 0.10% | ||
| 14:00 | EUR | Eurozone Consumer Confidence Sep A | -1.5 | -1.5 | ||
| 14:00 | USD | Leading Indicators Aug | 0.20% | 0.30% | ||
| 14:30 | USD | Natural Gas Storage | 91B |
Daily Technical Analysis: EUR/USD Bearish Break Of Rising Wedge During FOMC Statement
Currency pair EUR/USD
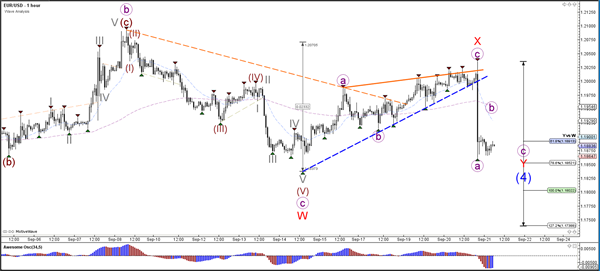
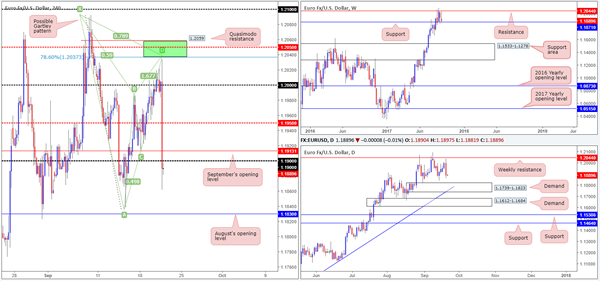
The EUR/USD broke the rising wedge chart pattern as mentioned in yesterday's headline. Price broke below the support trend line during the FOMC statement and interest rate decision by the Federal Reserve in the US. The bearish fall is confirming the extended WXY (red) correction within wave 4 (blue). The Fibonacci levels of wave Y (red) and wave 4 (blue) could act as potential support levels.
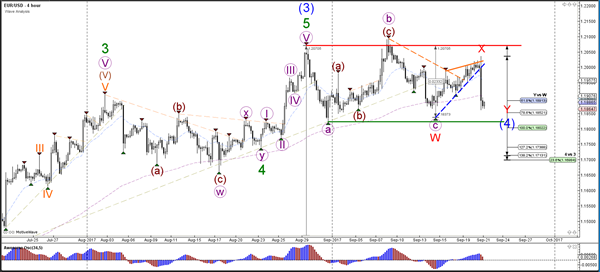
The EUR/USD break of the rising wedge chart pattern occurred with strong momentum and hence price could continue with its bearishness and build an ABC (purple) correction.
Currency pair GBP/USD
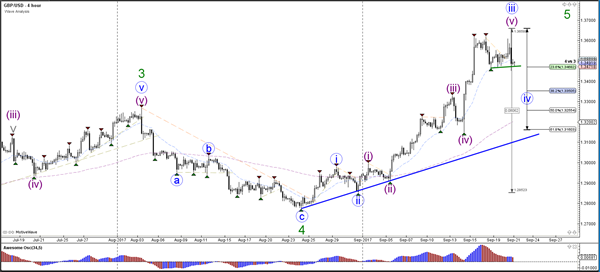
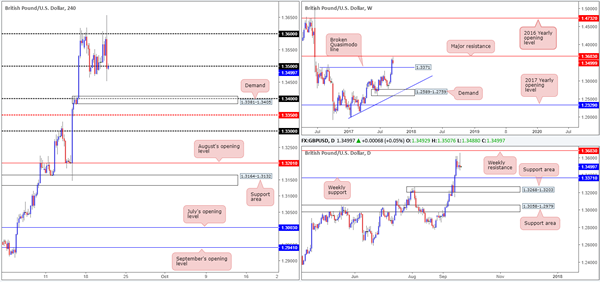
The GBP/USD made a higher high but price quickly fell back during the FOMC statement. The bullish move could have completed the wave 3 (blue) and started the wave 4 (blue) correction.
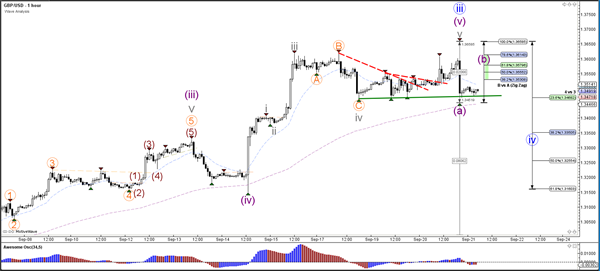
The GBP/USD completed a ending diagonal within the last 5th wave (grey) before price fell quickly back to the support level (green). Considering the strong bearish momentum, price could continue lower via an ABC (purple) correction towards the wave 4 (blue) Fibonacci levels.
Currency pair USD/JPY
The USD/JPY received one more boost during yesterday's FOMC statement. The USD/JPY moved up strongly after bouncing at the support trend line (green). Price has reached the resistance trend line (red) again.
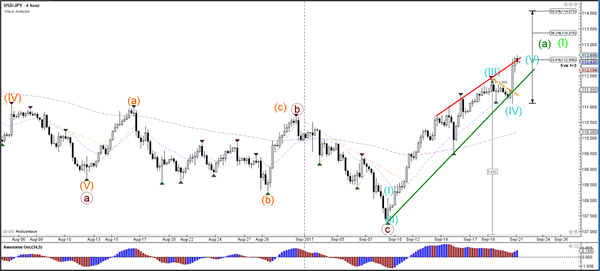
The USD/JPY broke the resistance trend line (dotted orange) and is continuing with the uptrend.
Daily Technical Outlook And Review: EUR/USD, GBP/USD, AUD/USD, USD/JPY, USD/CAD, USD/CHF, DOW 30, GOLD
A note on lower timeframe confirming price action...
Waiting for lower timeframe confirmation is our main tool to confirm strength within higher timeframe zones, and has really been the key to our trading success. It takes a little time to understand the subtle nuances, however, as each trade is never the same, but once you master the rhythm so to speak, you will be saved from countless unnecessary losing trades. The following is a list of what we look for:
- A break/retest of supply or demand dependent on which way you're trading.
- A trendline break/retest.
- Buying/selling tails ... essentially we look for a cluster of very obvious spikes off of lower timeframe support and resistance levels within the higher timeframe zone.
- Candlestick patterns. We tend to only stick with pin bars and engulfing bars as these have proven to be the most effective.
We typically search for lower-timeframe confirmation between the M15 and H1 timeframes, since most of our higher-timeframe areas begin with the H4. Stops are usually placed 1-3 pips beyond confirming structures.
EUR/USD
The aftermath of Wednesday's FOMC meeting saw the single currency aggressively drive over 100 pips south. H4 price reached a high of 1.2034, falling 4 pips short of our green sell zone (comprised of a H4 Quasimodo resistance at 1.2059, a H4 mid-level resistance at 1.2050, a H4 Harmonic bearish Gartley pattern completion at 1.2038, weekly resistance at 1.2044), before pressing lower. Very frustrating indeed!
As you can see, yesterday's move lower brought H4 candles below the 1.19 handle, which on this scale has potentially opened up the path south down to August's opening level at 1.1830. Daily action now appears poised to challenge nearby demand marked at 1.1739-1.1823, and weekly flow is currently testing support fixed at 1.1871 (USDX weekly flow trading beneath resistance at 11854).
Suggestions: Although H4 looks good for a sell down to the 1.1830 region, this would entail selling into potential weekly buyers, which is not really something we would label a high-probability setup. And likewise, a long in this market, while in-line with the overall trend and corresponding with current weekly structure, faces potential opposition from 1.19, followed closely by September's opening level at 1.1913.
A long on a H4 close back above the 1.1913 neighborhood would, in our opinion, be a safer approach. However, you'd need to pin down a reasonably tight setup beyond here as potential resistance lies just ahead at 1.1950.
Data points to consider: ECB President Draghi takes to the stage at 2.30pm. US Weekly unemployment claims at 1.30pm GMT+1.
Levels to watch/live orders:
- Buys: Flat (stop loss: N/A).
- Sells: Flat (stop loss: N/A).
GBP/USD
The British pound pushed higher against its US counterpart during London on Wednesday, but failed to muster enough strength to breach the 1.36 handle. Thanks to FOMC shenanigans, the pair put in a high of 1.3659 and drove marginally beyond the 1.35 mark going into the closing bell.
As is clear from the H4 chart this morning, price is currently retesting the underside of 1.35 as we write. Although weekly price failed to connect with resistance at 1.3683, yesterday's move could be enough to encourage further selling today. Below 1.35, we see little stopping the unit from reaching the 1.34 boundary, which intersects with nice-looking H4 demand at 1.3381-1.3405 and sits just above a weekly broken Quasimodo level at 1.3371.
Suggestions: In view of the above notes, looking for short trades around 1.35 today could be an option (waiting for lower-timeframe confirmation is advised – see the top of the report). Should this come to fruition, we'd look to take full profits around 1.34 and likely switch over to longs given how close the aforesaid weekly support is located.
Data points to consider: US Weekly unemployment claims at 1.30pm GMT+1.
Levels to watch/live orders:
- Buys: Flat (stop loss: N/A).
- Sells: 1.35 region ([waiting for a lower-timeframe sell signal to form is advised] stop loss: dependent on where one confirms this area).
AUD/USD
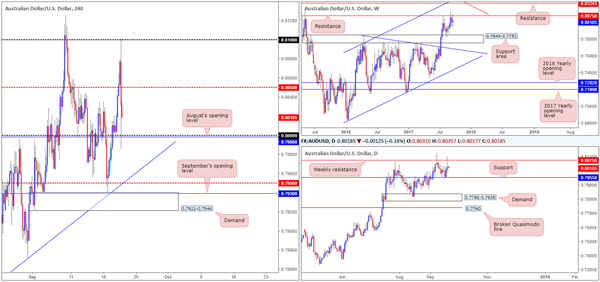
From the weekly timeframe this morning, price action shows that the commodity currency continues to reflect a bearish stance below resistance at 0.8075. Daily price on the other hand indicates that the unit has now entered into a phase of consolidation between the aforesaid weekly resistance barrier and a support level drawn from 0.7955.
Across on the H4 timeframe, the Aussie came under considerable pressure once it shook hands with the 0.80 boundary, following Wednesday's FOMC meet. Post-Fed momentum, however, eased after connecting with the large psychological number 0.80, shadowed closely by August's opening level at 0.7998.
Suggestions: Neither a long nor short seems attractive at this point. Yes, weekly price is trading beneath resistance, but with H4 bulls defending 0.80 it would be a dangerous sell right now, in our view. And clearly, trying to buy this market when weekly price is teasing resistance would be just as risky, even though the pair's overall trend is facing north.
Data points to consider: RBA Gov. Lowe speaks at 6.10am. US Weekly unemployment claims at 1.30pm GMT+1.
Levels to watch/live orders:
- Buys: Flat (stop loss: N/A).
- Sells: Flat (stop loss: N/A).
USD/JPY
Trade update: stopped out at breakeven.
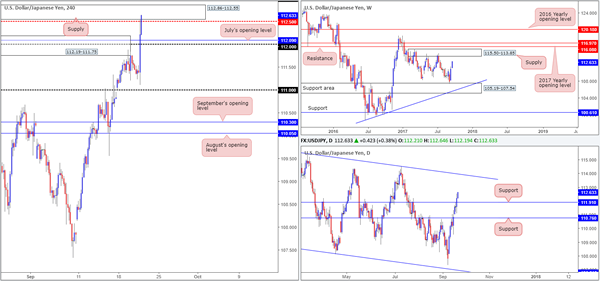
Kicking this morning's report off with a look at the weekly timeframe, we can clearly see the bulls look poised to challenge the supply area at 115.50-113.85. In conjunction with the weekly timeframe, daily action recently crossed above resistance coming in at 111.91 and shows little resistance stopping price from reaching trendline resistance extended from the high 115.50 (intersects with the aforementioned weekly supply area).
Leaving the 111 handle unchallenged, H4 price aggressively advanced north after yesterday's FOMC meeting. The move, as you can see, took out offers from supply at 112.19-111.75, the 112 handle and July's opening level at 112.09, consequently allowing price to cross paths with supply at 112.86-112.55.
Suggestions: With the dollar showing remarkable strength at the moment, and both weekly and daily timeframes offering little nearby resistance, a short from the H4 supply is not a trade we'll be taking. A break above this area would, as far as we can see, immediately open up the door to 113, and another supply seen at 113.57-113.38 (not seen on the screen). So, although we're expecting further upside in this market, buying beyond the current supply is somewhat restricted for the time being.
Data points to consider: BoJ interest-rate decision and policy statement (tentative); BoJ Press conference at 7.30am. US Weekly unemployment claims at 1.30pm GMT+1.
Levels to watch/live orders:
- Buys: Flat (stop loss: N/A).
- Sells: Flat (stop loss: N/A).
USD/CAD
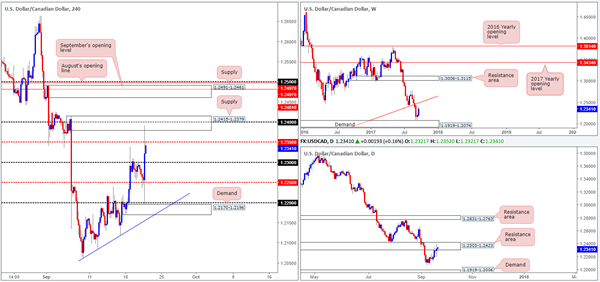
The USD/CAD pair rose sharply following Wednesday's FOMC meet, consequently running through the 1.23 handle. It was only once H4 price whipsawed through mid-level resistance at 1.2350 and brought supply at 1.2415-1.2379 into the picture, nevertheless, did we see the unit pullback.
The noted H4 supply, as you can probably see, is positioned within the walls of a daily resistance area coming in at 1.2303-1.2423. Before we all get too excited and punch the sell button though, it might be worth noting that weekly price shows room to extend above the daily area to tap a long-term weekly trendline resistance extended from the low 0.9633.
Suggestions: Given the threat of further upside on the weekly scale, the team is reluctant to sell from current prices. An area we would be interested in selling, however, is the H4 supply seen at 1.2491-1.2461. Not only is it surrounded by both September/August's opening levels at 1.2497/1.2481, as well as the 1.25 handle, it also intersects nicely with the noted weekly trendline resistance.
As H4 price could potentially fake above 1.2491-1.2461 to attack offers at 1.25, we would advise waiting for a reasonably sized H4 bear candle to take shape from here (preferably a full, or near-full-bodied candle), before pulling the trigger.
Data points to consider: US Weekly unemployment claims at 1.30pm GMT+1.
Levels to watch/live orders:
- Buys: Flat (stop loss: N/A).
- Sells: 1.2491-1.2461 area ([waiting for a reasonably sized H4 bearish candle to form – preferably a full, or near-full-bodied candle – is advised] stop loss: ideally beyond the candle's wick).
USD/CHF
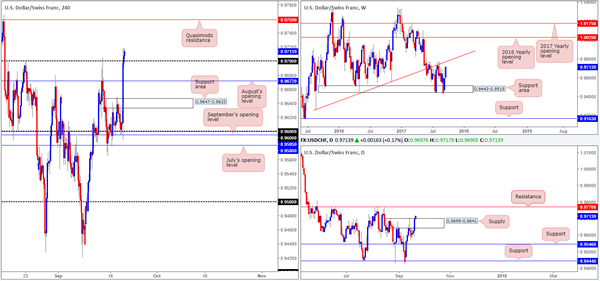
Basing our analysis from the weekly timeframe this morning, it is clear to see price closing in on the weekly trendline resistance taken from the low 0.9257 after a rather dominant push north from a support area at 0.9443-0.9515. Moving down to the daily timeframe, the unit is currently trading above supply at 0.9699-0.9641. The next upside target in view, should the bulls continue to push north, can be seen around a resistance level pegged at 0.9770 (intersects with the noted weekly trendline resistance).
A closer look at price action on the H4 timeframe shows the Swissy aggressively launched itself north after yesterday's FOMC meet. The day ended with the unit closing above the 0.97 handle, which in turn has potentially opened up the runway north to a Quasimodo resistance at 0.9759.
Suggestions: Keeping it Simple Simon today, we see two possible scenarios playing out:
A retest of 0.97 as support, followed by a reasonably sized H4 bull candle (preferably a full, or near-full-bodied candle). This could be good enough for a move up to the aforementioned H4 Quasimodo resistance line.
Instead of trying to long a market which is so close to testing weekly/daily structures, you could simply wait for price to challenge the H4 Quasimodo resistance and look to sell. Positioned just 10 pips beneath daily resistance at 0.9770 and intersecting with a weekly trendline resistance this H4 level is, in our opinion, enough to warrant a sell without the need for additional confirmation.
Data points to consider: US Weekly unemployment claims at 1.30pm GMT+1.
Levels to watch/live orders:
- Buys: 0.97 region ([waiting for a reasonably sized H4 bullish candle to form – preferably a full, or near-full-bodied candle – is advised] stop loss: ideally beyond the candle's tail).
- Sells: 0.9759 area (stop loss: 0.9776).
DOW 30
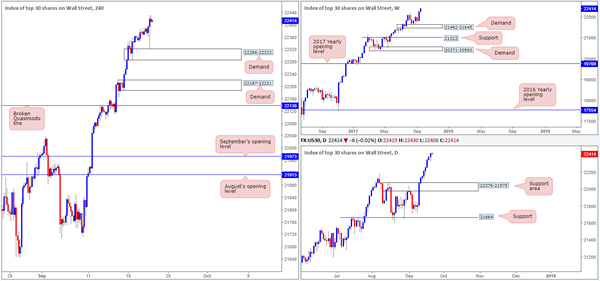
US equities, as you can see, hit the brakes and pressed to a low of 22319 (the top edge of H4 demand at 22286-22323) in the immediate aftermath of Wednesday's FOMC meet. Despite this, the index quickly pared losses and closed the day at a fresh record high of 22431. A pullback on the H4 timeframe could see price revisit the noted H4 demand. A violation of this area, however, likely opens the door for a test of the demand base coming in at 22187-22221.
Suggestions: With absolutely no resistances seen on the horizon, this remains a buyers' market right now as far as we're concerned. As such, we'll continue to watch both the above said H4 demands for possible buying opportunities should the index dip lower.
Data points to consider: US Weekly unemployment claims at 1.30pm GMT+1.
Levels to watch/live orders:
- Buys: 22286-22323 ([waiting for a reasonably sized H4 bullish candle to form – preferably a full, or near-full-bodied candle – is advised] stop loss: ideally beyond the candle's tail). 22187-22221 ([waiting for a reasonably sized H4 bullish candle to form – preferably a full, or near-full-bodied candle – is advised] stop loss: ideally beyond the candle's tail).
- Sells: Flat (stop loss: N/A).
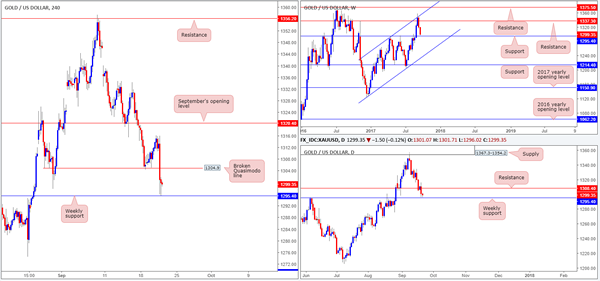
GOLD
Across the board, the US dollar rallied after yesterday's FOMC meet, thus pushing the price of gold lower. This not only saw price storm through the H4 Quasimodo support at 1304.9 (now acting resistance), it also saw daily price close below support at 1308.4 (now acting resistance) and place weekly price within touching distance of support at 1295.4.
With the recent H4 buying tails printed just ahead of weekly support, this could lead to a short-term bounce back up to the recently broken H4 Quasimodo line. The reason behind believing that this bounce may only be short term simply comes down to daily resistance seen plotted just above the H4 resistance at 1308.4.
Suggestions: Right now, we do not see much to hang our hat on. Granted, a long from weekly support could be an option, but with H4/daily resistance structures positioned nearby, we're wary of buying at the moment.
Levels to watch/live orders:
- Buys: Flat (stop loss: N/A).
- Sells: Flat (stop loss: N/A).
Market Morning Briefing: The FOMC Has Kept Rates On Hold For Now
STOCKS
Stocks look bullish to sideways for the near term. Need to be cautious on Nifty, Shanghai and Dax as there could be some important resistances coming up in the near term.
Dow (22412.59, +0.19%) is strongly bullish and is rising fast towards our 22500-22600 target mentioned yesterday. Initial rejection could be seen after a few sessions from near 22600.
Dax (12569.17, +0.06%) is almost stable near 12600 levels. An attempt to rise towards 12680 cannot be negated just now.
Nikkei (20479.88, +0.83%) is trading higher and has almost achieved our target of 20500. A break above 20500 can take it higher towards 20800-20900 in the medium term. Near term looks bullish.
Shanghai (3369.56, +0.11%) is trapped within the broad 3390-3350 region and could trade within this region for some more time. Sideways consolidation for another week may not be surprising.
Nifty (10141.15, -0.06%) is paused below 10200 as expected and could spend the next few sessions in the 10200-10100 region. Although there could be some chances of a rise towards 10300 in the longer term, the index could remain stable or dip in the coming sessions.
COMMODITIES
Overall precious metals are trading low after the FED policy meet yesterday as Dollar surged to 93.50 from levels near 91.70. Copper could turn bearish for the coming sessions. Crude may move up just now but could face some rejection in the next few sessions.
Gold (1299.30) came down to test 1296 as mentioned on Tuesday on a spike in US Dollar after the FED policy meet yesterday. In case the price sustains below 1300, there could be some chances of a fall towards 1280-1260 too. But we would like to wait for some confirmation.
Silver (17.09) is also down and could come down to 17.00-16.75 in the coming sessions before rising back again.
56.55-57.20 is an important resistance zone for Brent (56.18) from where the price could come off in the near term. Similarly, WTI (50.71) has some scope of testing resistance near 52 before coming off again towards 50.
Copper (2.9365) is trading below our mentioned support near 2.95 and if that sustains, the fall could extend towards 2.90 or even lower in the medium term.
FOREX
BONDS AND FOREX - Together today...
The FOMC has kept rates on hold for now. But market is pricing in a 66% chance of hike on 13th Dec and 3 more hikes in 2018. Balance Sheet "normalisation" is to start from October. How? Bonds maturing in Oct will not be replaced/ bought back.
As a result...
A) US Yields have risen. The US 10yr is 2.28%, up from 2.24%, and just above resistance at 2.26% mentioned yesterday and seems like it can rise more. The 5Yr (1.88%) also looks like to can try to move up towards 1.95-2.0% in the coming days/ weeks.
In the meanwhile, the German 10Yr (0.44%) has dipped by 1 bp. This brings the German-US 10Yr Spread down to -1.88%, compared to -1.77% earlier. The earlier uptrend since -2.16% since April 2017 is clearly broken now. It would be prudent to plan for -1.90% at least now.
B) This has pulled Euro lower to 1.1883, Dollar-Yen higher to 112.43 and Dollar Index up to 92.56.
Although there is immediate Support at 1.1850 on the Euro, the upside might be limited and downside might be open to 1.1750. The Dollar Index too could rise towards 94-95-96 if breaks above 93.00.
As mentioned earlier, Dollar-Yen is likely to rise further to 113.00-50. The Pound (1.3491) has come down sharply again after having risen past 1.36 yesterday. As such, the long-term Resistance at 1.38 looks respectable now. The Aussie (0.7998) might have also exhausted its upmove after the rally to 0.8100 yesterday. A break below 0.7950 will lead to further profit-taking.
Dollar-Yuan trades higher near 6.5889. Although Dollar-Rupee shows 64.29/34 on the NDF, we should be careful about how the market opens. The big question is, will FIIs take money out of Indian Bonds? If they do, it may weaken the Rupee.
Another BIG Question also is, how much of the Fed balance sheet normalisation is priced into the market? The US Yield Curve has flattened sharply with the 2Yr (1.43%) and 5Yr (1.88%) moving up sharply. This belied our expectation of a dovish Fed and suggests that the market has yet to price in the Fed normalisation.
Fed To Reduce Balance Sheet From October, Committed To One More Rate Hike This Year
The Fed finally made formal announcement that it would begin normalizing the balance sheet in October. As indicated in June, the process does not involve active selling of securities, but a passive run-off of its holdings. The policy rate also stayed unchanged at 1-1.25%. The overall tone of the statement and the press conference came in more hawkish than expected. Depsite downward revision in the core CPI for this year, the staff upgraded the economic growth outlook and downgraded the unemployment rate forecast. The median dot plot continued to project one more rate hike this year, followed by three more increases in 2018. As CME's 30-day Fed funds futures suggested, bets for a December hike markedly jumped to 73.4% from 57.7% in the prior day.
As a recap of the plan announced in June, the Fed has set the cap at US$10B/ month initially. That is, the caps start for the first three months at US$6B and US$4B for Treasuries and MBS respectively, before rising each quarter until they reach US$30B and US$20B per month Treasuries and MBS respectively, by October 2018.
Despite subdued inflation, the Fed remained firm on raising the policy rate. The median dot plot showed little change from June's. 4 of out the 16 members favored leaving the policy rate unchanged for the rest of the year. Yet, 11 members believed one more hike is appropriate, whilst one opted for two more hikes. For 2018, the median participant favored three rate hikes, whereas 5 members preferred fewer, compared with 4 in June. The above results suggested that the majority of members viewed the current weak inflation as transitory. However, Chair Janet Yellen noted that the committee's 'understanding of the forces driving inflation is imperfect and in light of the unexpected lower inflation readings this year, the committee is monitoring inflation developments closely'. She added that if the inflation shortfall does prove persistent then 'it will be necessary to adjust monetary policy to address that'.
On the economic outlook, the staff revised lower the core PCE inflation for this year and 2018 to +1.5% (June: +1.7%) and +1.9% (June: +2%), respectively. Forecasts for 2019 and 2020 stayed unchanged at 2%. However, the Fed has turned more upbeat over the economic environment otherwise. GDP growth is upgraded to +2.4% for this year, up from +2.2% previously, while the unemployment rate is revised lower to 4.1% for both 2018 and 2019 (June: 4.2%). The impacts of a number of hurricanes appeared limited. According to the Fed, although Hurricanes Harvey, Irma, and Maria would put some near-term pressure on growth and upward pressure on inflation in the near-term, the storms are 'unlikely to materially alter the course of the national economy over the medium term'.
The overall tone signaled that the Fed is committed to carry on the rate hike schedule (three increases for 2017) as indicated earlier this year. Barring a 'material' change in the economic outlook, the Fed should implement its rate hike and balance sheet normalization policies any planned.
FOMC Review: Unchanged Hiking Signals As QT Is Set To Begin Next Month
- As expected, Fed maintained the target range at 1.00%-1.25% and announced it will start shrinking its balance sheet ('quantitative tightening') next month.
- More interestingly – and in line with our expectations as written in our preview - the Fed maintained its signal of one more additional hike this year and three hikes next year and made no changes to inflation wordings in the statement.
- Markets interpreted this hawkishly by sending EUR/USD lower and US Treasury yields higher. Markets are now pricing 60% probability of a December rate hike. The dip in EUR/USD should prove shallow and short-lived
- Process of reducing the balance sheet in line with what the Fed has previously communicated but we were surprised that the Fed did not communicate a target for the balance sheet.
Fed still expects one more hike this year and three next year
It was not a big surprise that the Fed kept the target range unchanged at 1.00%-1.25% and announced 'quantitative tightening' will begin in October.
More interestingly and in line with our expectations as written in our preview, the Fed maintained its current policy signal, as the median 'dots' were unchanged at one additional hike this year and three hikes next year and the Fed did not make changes to inflation wordings in the FOMC statement despite low inflation. The Fed still says it is monitoring inflation 'closely' and Yellen repeated at the press conference that she thinks the low inflation is 'transitory'. Markets had expected a more dovish Fed, so in terms of market expectations (but not ours), this was a 'hawkish hold' leading to a stronger dollar and selloff in US fixed income markets.
The statement and dots confirm our view that while the four most dovish members (probably Bullard, Brainard, Evans and Kashkari, in our view) are still concerned about low inflation and do not think it is appropriate to raise rates further this year, core FOMC members still believe that above-trend growth and a tighter labour market will lead to higher wage growth and hence inflation eventually.
December hike likely due to low unemployment rate
Most Fed members putting more weight on labour market data relatively to inflation data is the main reason why we still think the Fed will hike in December. In other words, it is still the belief in the Phillips curve that dominates the Fed. However, we still see a risk Fed will pause its hiking cycle next year due to low inflation, which may not be just 'transitory' given the low inflation expectations, although it requires the Fed to put more weight on its inflation mandate. The reason for this is that tightness of the labour market is not the only factor determining wage growth, as second-round effects after many years with low inflation have hit wage growth. When employees expect inflation to remain low, they can live with low wage growth, as real wage growth may still be solid, making it less likely inflation will reach the target (see also Strategy: Central banks consider leaving the party, 30 June).
Our base case is currently two hikes next year assuming the Fed continues to put more weight on labour market and growth data. At the moment, the markets price in more than 62% probability of a December Fed hike (up from 50% before the meeting) and 1.8 hikes before year-end 2018. However, as we wrote in our preview, it is more difficult to forecast what the Fed does next year in terms of monetary policy given the four vacant seats in the Board of Governors. For a more thorough debate on this issue, see page 3 in our FOMC preview: Fed to announce QT and still signal one more hike this year, 15 September.
QT set to begin in October but no balance sheet level target yet
On the balance sheet, most was in line with expectations: This means that caps for Treasuries will begin at USD6bn per month and increase by USD6bn at three-month intervals until it reaches USD30bn per month and the caps for mortgage-backed securities will be set at USD4bn per month initially and increase USD4bn at three-month intervals until it reaches USD20bn per month. Given the outlined cap-structure, Fed will still be a fairly active buyer of Treasuries likely reinvesting around USD200bn in Treasuries during 2018 (versus USD216bn last year and USD176bn projected this year). For more details see Fed's quantitative tightening details, 19 June.
However, we were a bit surprised that the Fed did not announce how much it wants to lower its balance sheet (or alternatively, for how long it wants to continue QT). It seems like the Fed wants to keep flexibility to adjust along the way if necessary, perhaps because the Fed is still concerned about a repetition of something like the taper tantrum in 2013. We still think that it is not a trivial question how much the Fed can lower the balance sheet due to increasing regulation, something the Fed has also touched upon previously, see Research US: Fed's regulatory hurdle for starting quantitative tightening, 13 March. In the addendum from June, however, it is mentioned that the level of the quantity of reserve balances was also mentioned as it 'will reflect the banking system's demand for reserve balances and the Committee's decisions about how to implement monetary policy most efficiently and effectively in the future. The Committee expects to learn more about the underlying demand for reserves during the process of balance sheet normalization
Longer-run 'dot' revised down again
The longer-run dot was revised down from 3.00% to 2.75%, which we wrote in our preview was likely, as the Fed has once again become less optimistic on how much the natural rate will increase in coming years due to higher productivity growth. This is really interesting given the theoretical debate within the Fed (and actually also at the ECB and Bank of England) about the level of the so-called neutral rate (simply put, it is the rate which should prevail when the output gap is closed and growth is on trend), which the longer-run dot reflects. This means that the Fed now thinks that the level at which US yields should trade in equilibrium is not as high as previously expected. Also very interesting, Fed Chair Yellen said that the 2.75% estimation is still based on the expectation of an increasing neutral rate, as the current level of the neutral rate is lower than 3%. Yellen repeated at the press conference that she thinks monetary policy is currently close to neutral (meaning that the current Fed funds rate is close to the current neutral rate and hence that monetary policy is soon neither expansionary nor contractionary), hikes further out are due to an increasing neutral rate. If the neutral rate does not increase as expected, it means that the hiking cycle may end sooner than most analysts expect. As we wrote in our preview, it seems like markets buy into that story given the very soft pricing of the Fed, partly reflecting that investors do not expect a pickup in the neutral rate in coming years.
FX. Dip in EUR/USD should be shallow and short-lived
EUR/USD fell below 1.19 on the Federal Reserve statement. Yellen's comments at the following press conference sent the pair further down and firmly below 1.19. It serves to show that while EUR/USD has been buoyed by strong EUR momentum as capital flows have started to reverse, the cross is not immune to continued tightening of US monetary policy. As the market is now pricing 60% probability of a December rate hike, there should be limited further support to the USD from tightening of US monetary policy, though. Hence, the dip in EUR/USD should prove shallow and short-lived and we look for it to recover to 1.20 in the short term. Furthermore, we stick to our 12M forecast of 1.25. USD liquidity could, however, start to tighten substantially around mid-2018 when Federal Reserve's balance sheet runoff accelerates. That could lead to a widening of EUR/USD CCS and increase cost hedging USD assets and income.
FOMC: Gauging Normality For Investors: Real Rates Positive
With the current FOMC assessment, we are back to a position in the economy where the FOMC can begin to normalize its balance sheet. The key story is the implied rise into positive real rates ahead.
Focus on the Balance Sheet As Planned
FOMC officials are comfortable enough with the strength and sustainability of the U.S. economy to finally initiate a draw-down of the balance sheet to levels more consistent with normal economic conditions. As such, the balance sheet run-off will commence (starting in October) with modest caps of $10 billion per month ($6 billion for Treasuries and $4 billion for agency/MBS), reinvesting principal payments that exceed those caps. Every three months, and assuming economic conditions still warrant the terms, the Fed will raise those caps by equal amounts four more times, until the final cap amount stands at $50 billion per month ($30 billion for Treasuries and $20 billion for agency/MBS). Nearly one-half of the Fed's $2.4 trillion in Treasury holdings come due between now and 2020, making now an opportune time for the Fed to begin to reduce the size of its balance sheet (top graph). This pattern does not represent an issue until late 2018 when caps start to exceed reinvestment flows.
Economic Projections as a Basis for Policy: Lower Inflation
According to the FOMC, the U.S. economy entered the current quarter with renewed strength (Q2 U.S. GDP at a 3.0 percent annualized pace). Likewise, the hurricanes' shock is temporary and, therefore, does not appear set to derail the underlying strength of the U.S. economy.
As for inflation (middle graph), the FOMC lowered its median expectation for both overall and PCE inflation a touch for 2018 and then held steady the pace of inflation for 2019 and 2020 at the 2 percent target.
We differ. There is a clear structural break in inflation (both CPI and the PCE deflator) after 2008. Moreover, the recent weakness in inflation is not solely transitory (please refer to our recent report: Inflation Slowdown: Transitory or Persistent). Finally, there is a persistent pattern in inflation that helps explain why it has taken so long for the inflation pace get back to 2 percent. Our core PCE inflation forecast is lower than the FOMC's for 2018 to reflect the long drawn out pattern of inflation adjustments.
Dot Plot, Real Interest Rates and Fixed Income Implications
An updated FOMC policy statement and the economic projections indicate a steady rise in the funds rate (dot-plot in bottom graph) and, given the steady FOMC projections for inflation, the net result is a steady rise in the real short-term fed funds rate. This rise in real rates will represent a significant shift given that the majority of this economic and financial recovery has occurred in an environment of negative real rates.
The updated dots for 2017 do not take a December rate hike off the table. However, the dots do imply there is one less FOMC move in 2019. Interesting to note that the fed funds rate for 2020 at 2.9 percent is actually higher than the long-run 2.8 percent.