Sample Category Title
Forex Technical Analysis: EUR/USD, USD/JPY, GBP/USD
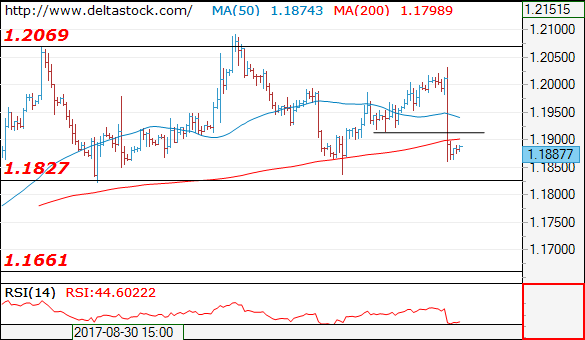
EUR/USD
Current level - 1.1887
Yesterday's reversal at 1.2035 has been confirmed with the break through 1.1915 and the bias is negative, for a tight test of 1.1830 major support. The latter is the last hurdle before 1.1660 area.
| Resistance | Support | ||
| intraday | intraweek | intraday | intraweek |
| 1.1915 | 1.2160 | 1.1830 | 1.1830 |
| 1.2035 | 1.2500 | 1.1830 | 1.1660 |
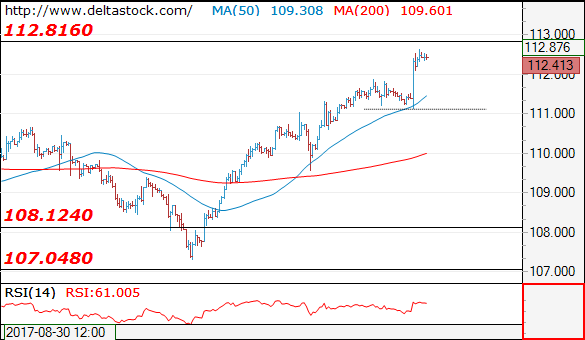
USD/JPY
Current level - 112.43
The recent consolidation built a base at 111.10 and the uptrend is intact, heading for a tight test of 112.80 resistance area. Initial intraday support lies at 111.90 and crucial on the downside is 111.10.
| Resistance | Support | ||
| intraday | intraweek | intraday | intraweek |
| 112.80 | 112.80 | 111.90 | 108.12 |
| 112.80 | 114.50 | 111.10 | 107.30 |
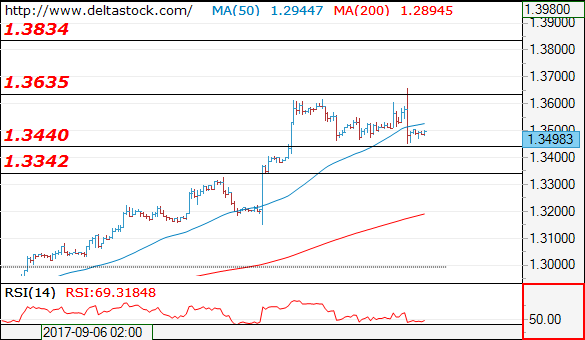
GBP/USD
Current level - 1.3498
The sharp reversal at 1.3655 signals a negative bias, for a test of 1.3440 support and a break through that area will challenge 1.3340 zone. Initial intraday resistance lies at 1.3530.
| Resistance | Support | ||
| intraday | intraweek | intraday | intraweek |
| 1.3530 | 1.3650 | 1.3440 | 1.3340 |
| 1.3650 | 1.3830 | 1.3340 | 1.3150 |
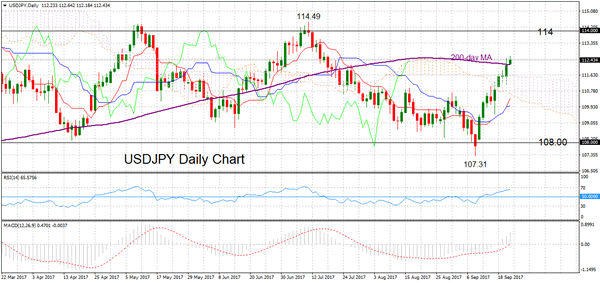
USDJPY Retains Medium-Term Neutral Outlook, Short-Term Bullish Phase Intact
USDJPY remains neutral in the medium term and has been trading in a broad range between 108 and 114 over the past 6 months. The near-term bullish phase that started last week from near solid support in the 108-area is still in place.
Momentum indicators are providing bullish signals, as the RSI has crossed above 50 and the MACD above zero. Ichimoku cloud analysis shows the market has risen above the cloud, while the Tenkan-sen line has crossed above the Kijun-sen line, giving a bullish signal.
The bounce off the September 8 low of 107.31 is still in progress. The short-term bias is strongly bullish after USDJPY rose above the 200-day MA to hit a high of 112.64 so far. There is scope for another push higher towards the top of the range at 114. Breaking above the July 11 high of 114.49 would allow the uptrend to extend further to target the next major peak at 115.50. From here the market would shift its neutral medium-term bias to a bullish one.
Failure to rise above resistance at 114 could see USDJPY reverse back down towards the lower end of the range. Immediate support is at the top of the cloud at 111.60. A drop into the cloud would change the short-term bullish technical tone and focus would turn to the 108-support area. Should this solid support level be broken, USDJPY would move out of the 6-month range and the medium-term picture would turn from neutral to bearish.
In the short term, there is limited risk to the downside but the medium-term outlook remains neutral within the established 6-month range between 108 and 114.
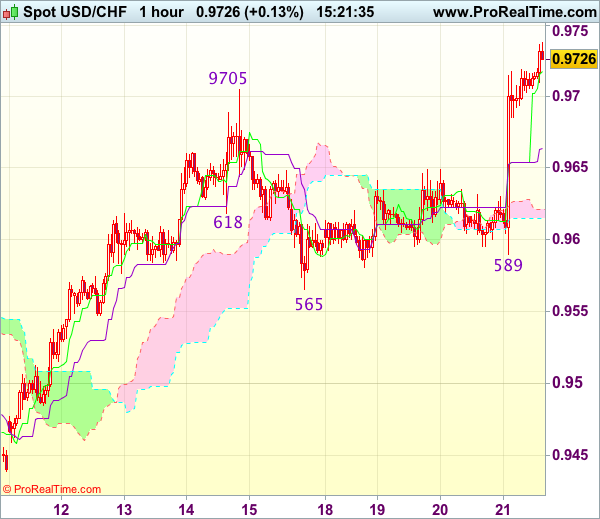
Trade Idea : USD/CHF – Stand aside
USD/CHF - 0.9720
Most recent candlesticks pattern : N/A
Trend : Near term up
Tenkan-Sen level : 0.9724
Kijun-Sen level : 0.9667
Ichimoku cloud top : 0.9621
Ichimoku cloud bottom : 0.9615
Original strategy :
Sold at 0.9625, stopped at 0.9650
Position : - Short at 0.9625
Target : -
Stop : - 0.9650
New strategy :
Stand aside
Position : -
Target : -
Stop : -
The greenback only fell to 0.9589 yesterday before staging another rally (after Fed) above resistance at 0.9705, suggesting recent rise from 0.9421 low is still in progress and may extend gain towards 0.9761-66 (50% Fibonacci retracement of 1.0100-0.9421 and previous resistance) but reckon another previous resistance at 0.9773 would hold on first testing due to near term overbought condition, risk from there is seen for a retreat later.
In view of this, would not chase this rise here and would be prudent to stand aside for now. Below 0.9685 would bring test of the Kijun-Sen (now at 0.9667) but break there is needed to signal an intra-day top is formed, bring retracement to 0.9635-40 but said support at 0.9589 should remain intact.
Kiwi Dollar Tumbles Post Fed Decision And NZ GDP
Key Highlights
- The New Zealand Dollar likely made a short-term top near 0.7430 against the US Dollar.
- The NZD/USD is attempting a close below an important support at 0.7330 on the 4-hours chart.
- Fed kept the interest rates unchanged, but the central bank’s hawkish tone caught the market attention.
- New Zealand Gross Domestic Product in Q2 2017 increased 0.8%, similar to the forecast.
NZDUSD Technical Analysis
The New Zealand Dollar made good ground this past week and traded above 0.7400 against the US Dollar. However, the NZD/USD pair struggled to sustain momentum and currently trading below 0.7360.
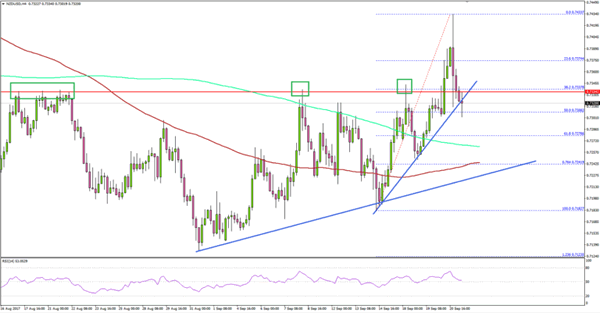
Looking at the 4-hours chart of NZD/USD, it seems like the pair is forming a short-term top near 0.7433. The pair started a downtrend and moved below the 38.2% Fib retracement level of the last wave from the 0.7182 low to 0.7433 high.
During the recent slide, the pair broke a major support area near 0.7335. At the outset, it is attempting a close below an important support at 0.7330 on the same chart.
If there is a close below 0.7330 followed by a break of the 50% Fib retracement level of the last wave from the 0.7182 low to 0.7433 high, there can be more declines towards 0.7280-0.7250 in the near term.
New Zealand Gross Domestic Product
Today in New Zealand, the Gross Domestic Product for Q2 2017 was released by the Statistics New Zealand. The forecast was slated for a rise of 0.8% in the GDP compared with the previous quarter.
However, the actual result was in line with the forecast as there was an increase of 0.8% in the GDP in Q2 2017, but it was more than the last revised 0.6%. Looking at the yearly change, there was an increase of 2.5%, similar to the forecast and the last +2.5%.
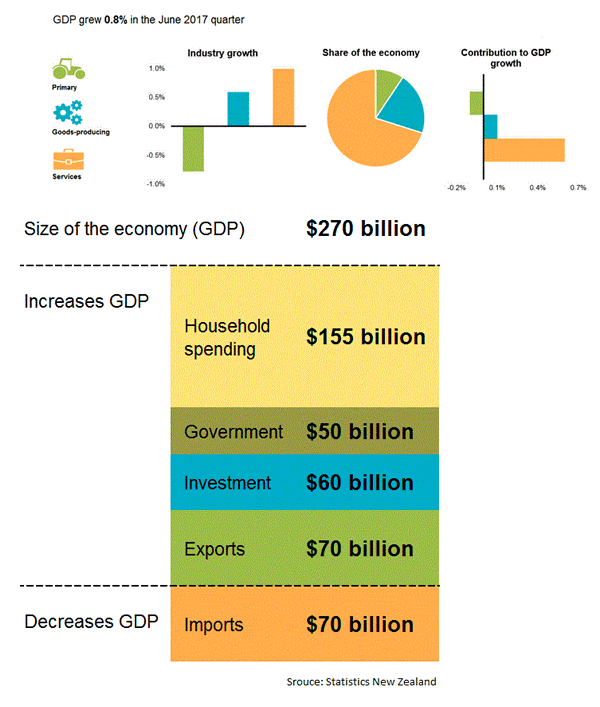
Commenting on the same, the national accounts senior manager, Gary Dunnet, stated:
Strong export and domestic demand underpinned growth this quarter. Demand for exports has resulted in strong production growth in manufacturing and service industries. Eleven of 16 industries increased in the latest quarter, with retail trade and accommodation having the biggest rise.
Overall, the result was positive, but the market sentiment is bearish for NZD/USD, which could take it towards the 0.7280 level in the near term.
Fed Holds Rates For Now But…
Unsurprisingly, the Federal Reserve kept rates on hold following the end of its 2-day meeting on Wednesday. They did, however, indicate that one more hike is possible before year-end. The recent drop in inflation appears to not have unsettled the policymakers, with Fed Chair Yellen commenting “What we need to figure out is whether the factors that have lowered inflation are likely to prove persistent” if they do “it would require an alteration of monetary policy”. In justification of the decision for an additional hike later this year the Fed cited low unemployment, growth in business investment and a moderate but durable economic expansion. Fed projections are suggesting 3 rate hikes in 2018, 2 hikes in 2019 and 1 hike in 2020. Also, as expected, the Fed said it would begin to reduce its massive holding of bonds and mortgage-backed securities in October. With an estimated $4.2 Trillion in assets, the reductions will take place gradually and moderately in the coming months and years.
In another unsurprising move on Thursday, the Bank of Japan kept their monetary policy unchanged, keeping interest rates on hold and their asset purchase program unchanged.
EURUSD gave up recent gains to trade as low as 1.18653 overnight. Currently, EURUSD is trading around 1.1895.
USDJPY climbed to 3-month highs reaching 112.643 in early Thursday trading. Currently, USDJPY is trading around 112.40.
GBPUSD is currently trading around 1.35 in relatively quiet early trading.
Gold gave back gains against USD, as the precious metal traded overnight to a 3-week low of $1,295.80.
WTI remains strong against USD, with WTI trading up to $50.82pb in early trading. Currently, WTI is trading around $50.70pb.
Major economic data releases for today:
At 13:30 BST, the US Department of Labor will release Initial Jobless Claims for the week ending September 15th and continuing Jobless Claims for the week ending September 8th. The forecast is for an increase to 300K from the previous 284K. The US Labor market has been robust throughout the year, and whilst a higher reading would generally be bearish for the USD, the impact of the recent storms makes this less impactful.
At 14:30 BST, the ECB President, Mario Draghi, is due to provide welcome remarks at the 2nd ESRB annual conference in Frankfurt, Germany.
Trade Idea : GBP/USD – Sell at 1.3595
GBP/USD - 1.3509
Most recent candlesticks pattern : N/A
Trend : Up
Tenkan-Sen level : 1.3494
Kijun-Sen level : 1.3555
Ichimoku cloud top : 1.3542
Ichimoku cloud bottom : 1.3512
New strategy :
Sell at 1.3595, Target: 1.3480, Stop: 1.3630
Position : -
Target : -
Stop : -
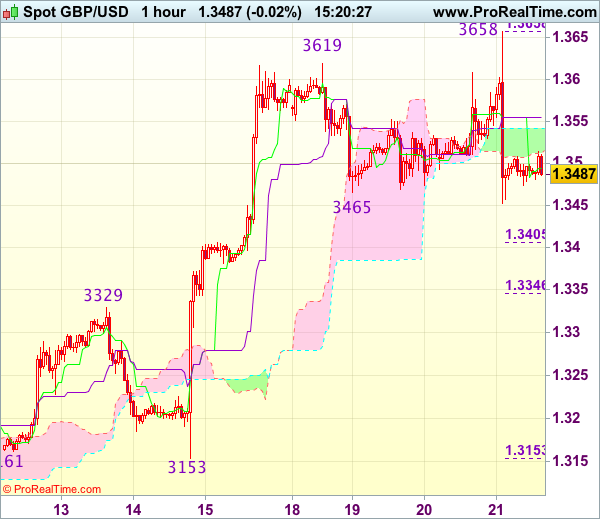
Although the British pound resumed recent rise and rose to as high as 1.3658, lack of follow through buying and the subsequent sharp retreat suggest top is possibly formed there and consolidation with mild downside bias is seen, below 1.3450 would bring further fall towards 1.3400-05 (50% Fibonacci retracement of 1.3153-1.3658), however, near term oversold condition should prevent sharp fall below 1.3345-50 (61.8% Fibonacci retracement) and previous resistance at 1.3329 should remain intact.
In view of this, we are looking to sell cable on recovery as 1.3590-00 should limit upside. Above 1.3620 would risk retest of said yesterday’s high at 1.3658 but only break there would revive bullishness and extend recent upmove to 1.3690-00 later.
Trade Idea : EUR/USD – Sell at 1.1950
EUR/USD - 1.1894
Most recent candlesticks pattern : N/A
Trend : Sideways
Tenkan-Sen level : 1.1883
Kijun-Sen level : 1.1948
Ichimoku cloud top : 1.1995
Ichimoku cloud bottom : 1.1968
Original strategy :
Bought at 1.1970, stopped at 1.1950
Position : - Long at 1.1970
Target : -
Stop : - 1.1950
New strategy :
Sell at 1.1950, Target: 1.1850, Stop: 1.1985
Position : -
Target : -
Stop : -
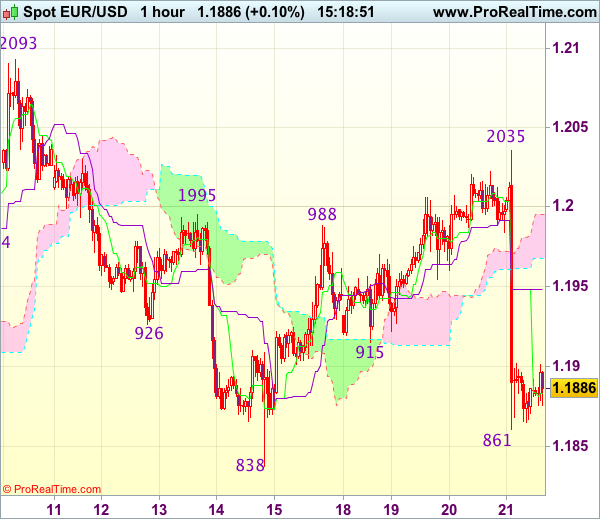
Although the single currency rose to as high as 1.2035 in late NY, euro ran into strong selling pressure there and has dropped sharply after Fed, suggesting early rebound from 1.1838 has ended there and downside bias is seen for retest of said support, break there would signal another leg of corrective decline from 1.2093 top is underway and extend weakness to 1.1800-05 but near term oversold condition would limit downside to 1.1770 and reckon 1.1750 would hold.
In view of this, we are looking to sell euro on recovery as the Kijun-Sen (now at 1.1948) should limit upside and bring another decline later. Above the lower Kumo (now at 1.1968) would defer and risk a stronger rebound to the upper Kumo (now at 1.1995) but said resistance at 1.2035 should remain intact.
AUD/USD Drops Like A Rock
AUD/USD drop fast and could hit new lows in the upcoming hours. It could drop below the 0.7939 previous low and could hit the lower median line (LML) of the major ascending pitchfork. Technically is expected to drop after another spike. Is traded outside the minor ascending pitchfork’s body, a valid breakdown below the LML will open the door for a major drop.
GBP/JPY BOJ Policy Rate Unchanged
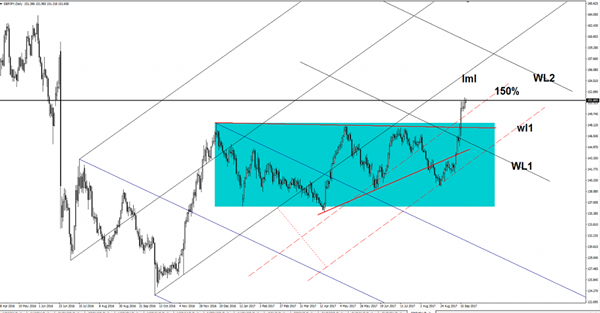
GBP/JPY continues to stay higher as the Yen is weakened by the Nikkei’s impressive rally. The index has managed to climb much above the 20320 previous high, but now seems a little exhausted and could slip lower. I’ve said in a previous report that the JP225 is somehow expected to decrease a little after the amazing upside momentum, it could come even to retest the 20058 former resistance before will climb much higher. BOJ kept the interest rate steady at the -0.10%, remains to see how the Yen will react after the BOJ Press Conference.
GBP/JPY reached the 151.66 horizontal obstacle, only a valid breakout will confirm a further increase towards the lower median line (LML) of the ascending pitchfork.
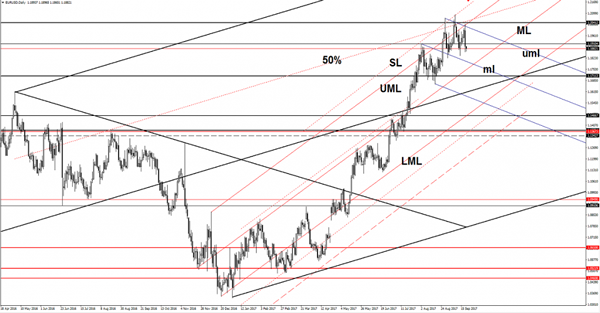
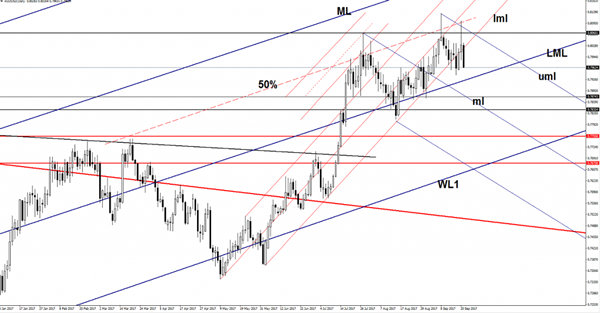
EUR/USD More Downside In View
Price dropped significantly after the FOMC and looks poised to start a corrective phase on the short term. EUR/USD is narrowing on the short term, but it could breakout from this range and could make a significant move. Technically, it could drop much deeper on the short term after the retest of some important resistance levels.
The dollar has taken the lead again as the USDX has climbed much higher since yesterday's US session, the index is trading in the green, but is facing a tough resistance.
USDX is pressuring the 92.49 major horizontal resistance, a valid breakout will validate a further increase and a USD's dominance. The USD still needs more support from the United States economy, some positive data in the afternoon could give it the needed bullish spark. The Unemployment Claims are expected to jump from 284K to 302K jobs in the previous week, a better report will boost the greenback.
Price is moving sideways, but it could drop much deeper after the retest of the UML and the upper median line (uml) of the minor descending pitchfork. Actually, it could drop after the failure to reach the confluence area formed at the intersection between the UML with the upper median line (uml). EUR/USD failed to close near the mentioned resistance levels, signaling that is expected to drop significantly. The pair could be attracted by the confluence area formed at the intersection between the median line (ml) with the ML of the ascending pitchfork.