
Sample Category Title
Nasdaq-100 Index Wave Analysis
Nasdaq-100: ⬆️ Buy
- Nasdaq-100 broke key resistance level 29750,00
- Likely to rise to resistance level 31000.00
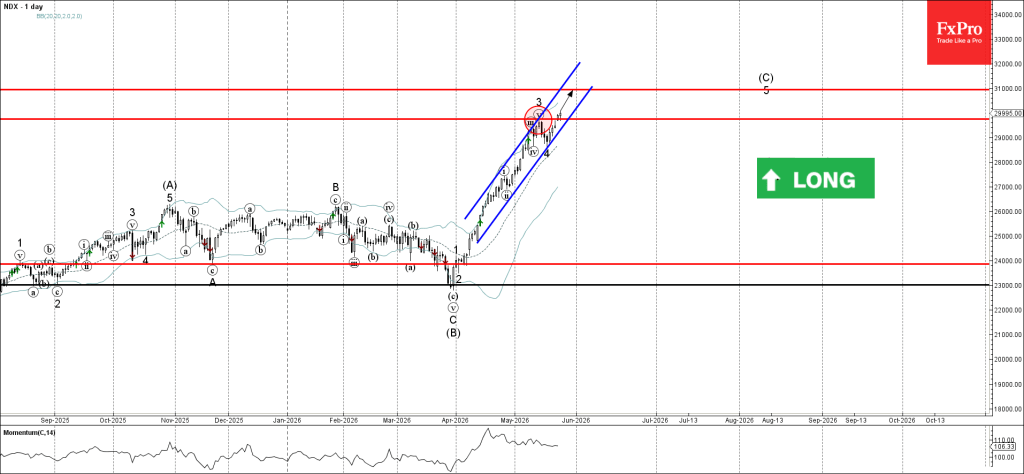
Nasdaq-100 index recently broke above the key resistance level 29750,00 – which stopped the previous impulse wave 3.
The active impulse wave 3 belongs to wave 5 of the sharp intermediate impulse wave (C) from the end of March.
Given the clear daily uptrend, Nasdaq-100 index can be expected to rise to the next resistance level 31000.00 (the target for the completion of the active impulse wave (C)).
RBNZ Delivers Hawkish Hold as Split Vote Signals Rate Hikes Coming Soon
The Reserve Bank of New Zealand left the Official Cash Rate unchanged at 2.25% today, but the decision delivered a distinctly hawkish message as policymakers signaled that rate hikes are likely coming sooner and more aggressively than previously expected. In a major surprise, the Monetary Policy Committee split evenly 3-3, forcing Governor Anna Breman to use her casting vote to keep rates on hold.
The central bank warned that inflation pressures linked to the Middle East conflict are intensifying and broadening through the economy. Annual CPI is now expected to peak at 4.3% in the September quarter before only returning to the 2% target midpoint in mid-2027. The statement explicitly warned that “the OCR will most likely need to increase sooner and by more than envisaged in the February Monetary Policy Statement.” Policymakers are increasingly concerned that higher fuel and petrochemical costs could trigger broader second-round inflation effects through wages and business pricing behavior.
At the same time, the RBNZ acknowledged that the economic outlook has weakened materially. The Committee said “the balance of risks is to the upside for inflation and to the downside for growth,” highlighting weaker consumer confidence, softer business investment, elevated unemployment, and a still-fragile housing market. GDP growth for 2026 is now expected to be nearly one percentage point lower than projected in February as higher energy costs squeeze household purchasing power and corporate profit margins.
Still, the overall tone left little doubt that tightening is approaching. All Committee members agreed that “increasing the OCR at upcoming meetings would likely be necessary” to prevent near-term inflation from becoming embedded over the medium term. The split vote itself underscored how close the RBNZ already is to restarting hikes, with three members arguing that “monetary conditions remained accommodative” and favoring an immediate 25bps increase today.
Australia CPI Slows More Than Expected to 4.2% as Fuel Inflation Eases
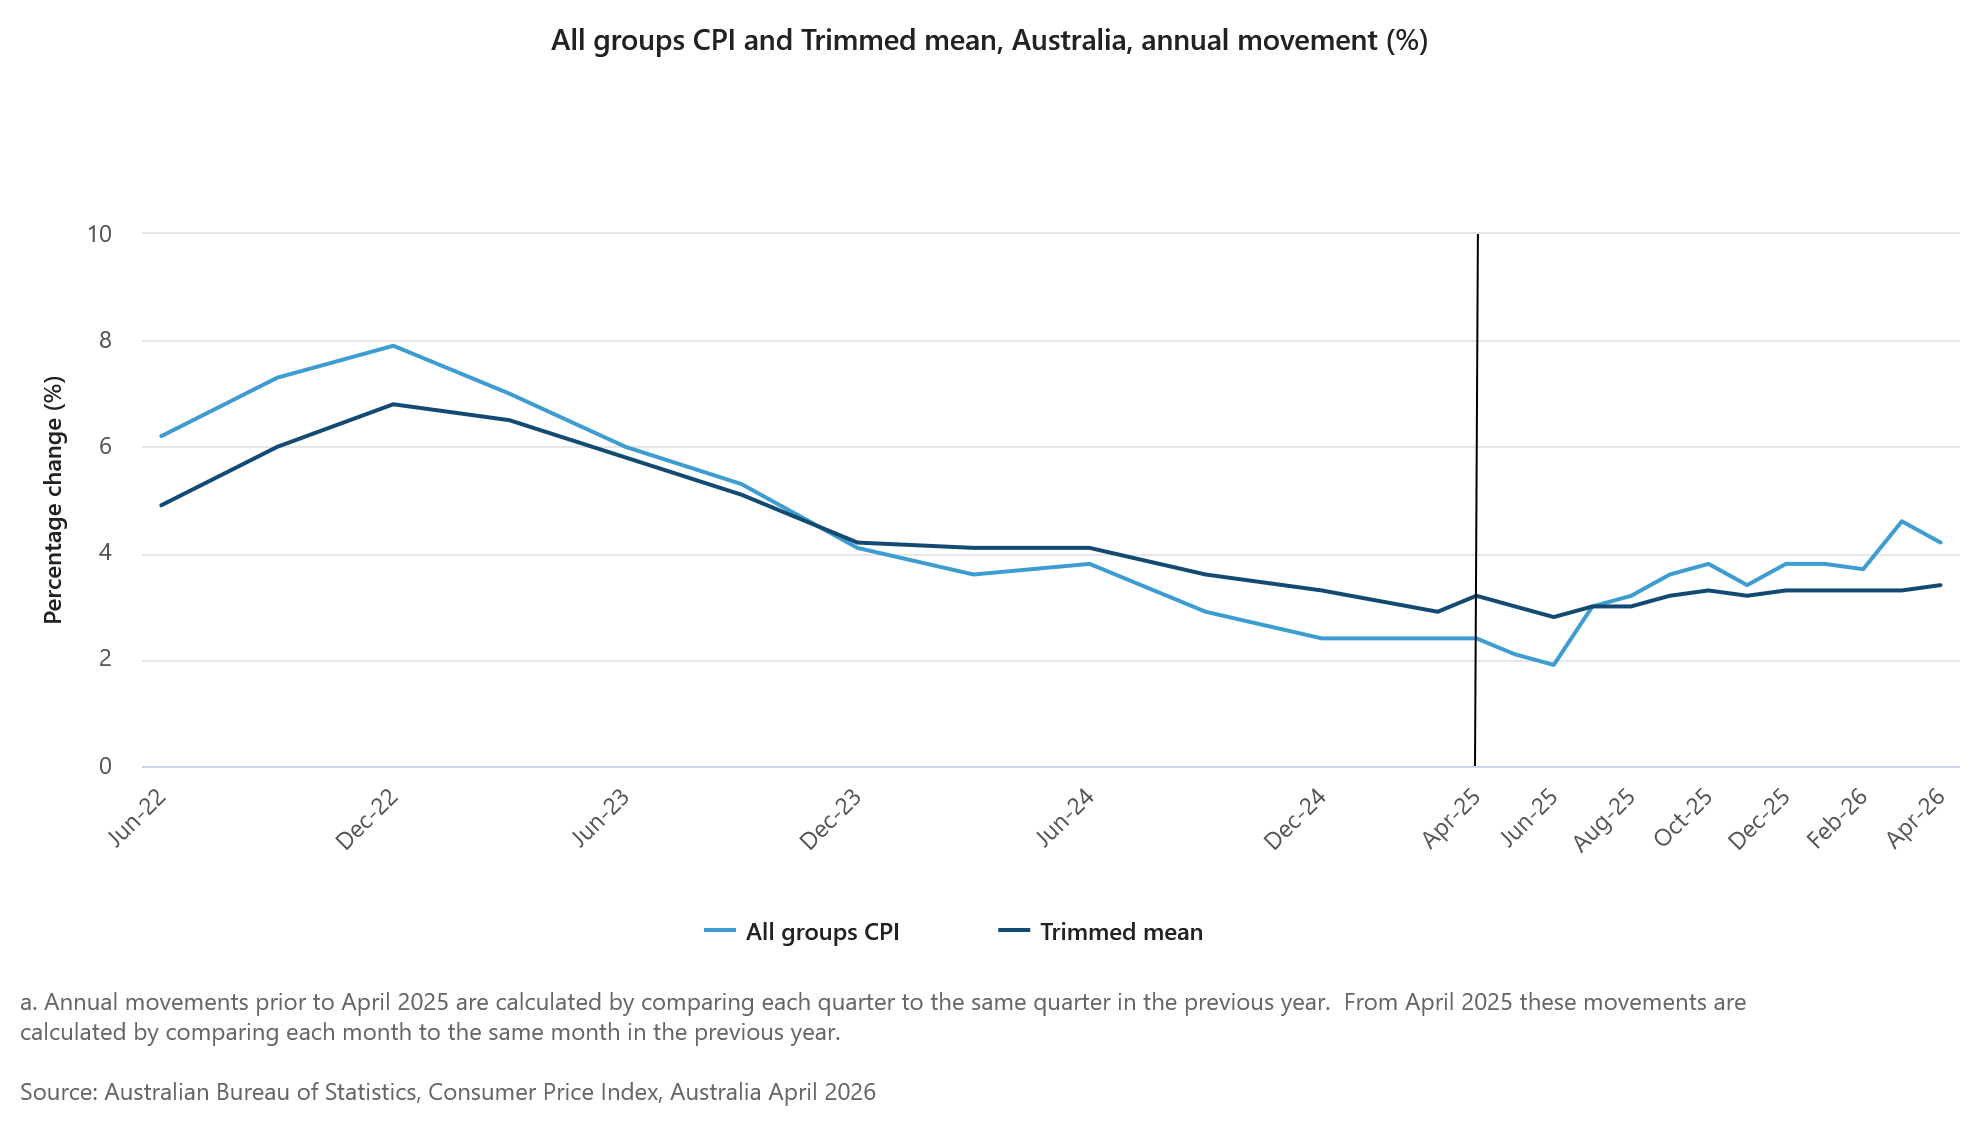
Australia’s headline inflation unexpectedly softened in April, reinforcing the view that the Reserve Bank of Australia may remain cautious about delivering further rate hikes despite still-elevated core price pressures. Headline CPI slowed from 4.6% yoy to 4.2% yoy, below expectations of 4.4% yoy. On a monthly basis, CPI rose 0.4% mom, undershooting forecasts of 0.6% mom.
The moderation was driven largely by easing goods inflation, particularly fuel prices. Annual goods inflation slowed sharply from 5.5% yoy to 4.7% yoy, with automotive fuel inflation easing from 24.2% yoy to 18.6% yoy. Services inflation also edged lower from 3.6% yoy to 3.5% yoy, though housing and essential services continued exerting upward pressure. Housing inflation remained elevated at 6.3% yoy, while transport costs rose 6.6% yoy and food and non-alcoholic beverages increased 2.8% yoy.
Underlying inflation, however, stayed relatively sticky. Trimmed mean CPI edged up from 3.3% yoy to 3.4% yoy, matching expectations and marking the highest reading since mid-2024. Monthly trimmed mean CPI rose 0.3% mom, slightly below expectations of 0.4% mom.
The mixed report is likely to support the RBA’s current wait-and-see stance, with softer headline inflation easing immediate tightening pressure after the three rate hikes this year, while resilient core inflation continues preventing policymakers from declaring victory over price stability.
| Indicator | Previous | Latest | Expectation |
|---|---|---|---|
| Headline CPI YoY | 4.6% | 4.2% | 4.4% |
| Headline CPI MoM | 1.1% | 0.4% | 0.6% |
| Trimmed Mean CPI YoY | 3.3% | 3.4% | 3.4% |
| Trimmed Mean CPI MoM | 0.2% | 0.3% | 0.4% |
| Goods Inflation YoY | 5.5% | 4.7% | — |
| Automotive Fuel Inflation YoY | 24.2% | 18.6% | — |
| Services Inflation YoY | 3.6% | 3.5% | — |
Eco Data 5/27/26
| GMT | Ccy | Events | Act | Cons | Prev | Rev |
|---|---|---|---|---|---|---|
| 23:50 | JPY | Corporate Service Price Index Y/Y Apr | 3.00% | 3.00% | 3.10% | 3.30% |
| 01:00 | AUD | Westpac Leading Index M/M Mar | 0.00% | -0.10% | ||
| 01:30 | AUD | CPI M/M Apr | 0.40% | 0.60% | 1.10% | |
| 01:30 | AUD | CPI Y/Y Apr | 4.20% | 4.40% | 4.60% | |
| 01:30 | AUD | Trimmed Mean CPI M/M Apr | 0.30% | 0.40% | 0.30% | 0.20% |
| 01:30 | AUD | Trimmed Mean CPI Y/Y Apr | 3.40% | 3.40% | 3.30% | |
| 02:00 | NZD | RBNZ Interest Rate Decision | 2.25% | 2.25% | 2.25% | |
| 08:00 | CHF | UBS Economic Expectations May | -11.1 | -30.3 |
| 23:50 | JPY |
| Corporate Service Price Index Y/Y Apr | |
| Actual | 3.00% |
| Consensus | 3.00% |
| Previous | 3.10% |
| Revised | 3.30% |
| 01:00 | AUD |
| Westpac Leading Index M/M Mar | |
| Actual | 0.00% |
| Consensus | |
| Previous | -0.10% |
| 01:30 | AUD |
| CPI M/M Apr | |
| Actual | 0.40% |
| Consensus | 0.60% |
| Previous | 1.10% |
| 01:30 | AUD |
| CPI Y/Y Apr | |
| Actual | 4.20% |
| Consensus | 4.40% |
| Previous | 4.60% |
| 01:30 | AUD |
| Trimmed Mean CPI M/M Apr | |
| Actual | 0.30% |
| Consensus | 0.40% |
| Previous | 0.30% |
| Revised | 0.20% |
| 01:30 | AUD |
| Trimmed Mean CPI Y/Y Apr | |
| Actual | 3.40% |
| Consensus | 3.40% |
| Previous | 3.30% |
| 02:00 | NZD |
| RBNZ Interest Rate Decision | |
| Actual | 2.25% |
| Consensus | 2.25% |
| Previous | 2.25% |
| 08:00 | CHF |
| UBS Economic Expectations May | |
| Actual | -11.1 |
| Consensus | |
| Previous | -30.3 |
Dollar Contradicts the Peace Trade – EUR/USD, GBP/USD and Dollar Index Overview
US stock markets opened with strong optimism, but other asset classes are not as confident.
While equities are rising and catching up to the previous session’s futures rally, currency and commodity markets remain cautious about unresolved issues in the latest diplomatic talks.
The overall geopolitical outlook appears positive, as both sides have agreed to reopen the Strait of Hormuz in the next 30 days and work toward a longer-term peace process within 60 days.
Still, a final agreement is proving difficult. Reports show that Iranian negotiators remain stuck on key issues, especially the release of frozen funds and where Tehran’s enriched nuclear stockpiles will go.
Ongoing diplomatic tensions are causing a quick shift in commodities, leading to a rebound in crude oil prices, especially Brent.
The continued geopolitical risks and concerns about inflation are giving strong support to the US Dollar, the subject of this morning’s analysis.
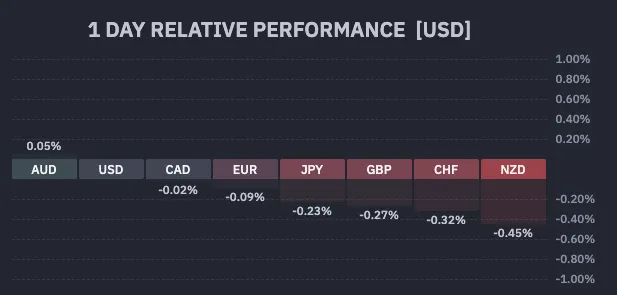
Current session’s FX performance – Courtesy of Finviz. May 26, 2026.
Even though hopes for peace are pushing risk assets to new highs, the US Dollar remains strong, going against the broader trend.
We will look at the Dollar Index, EUR/USD, and GBP/USD to see how recent peace flows have already impacted the FX market and where to look next.
Dollar Index 4H Chart
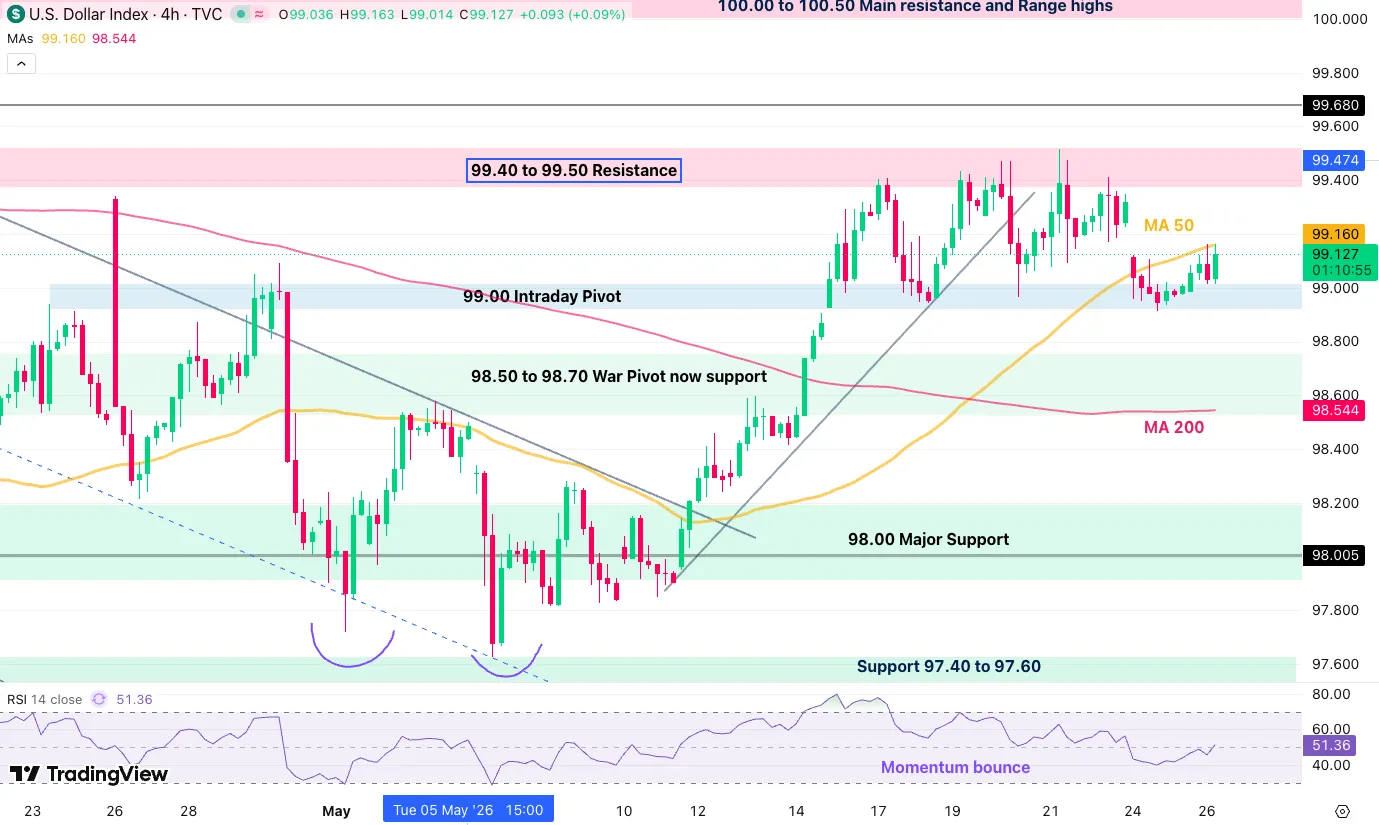
Dollar Index 4H Chart, May 26, 2026 – Source: TradingView.
The US Dollar is currently consolidating between 99.00 and 99.50, a much higher range compared with late-April trading, when it was closer to 98.00.
Bulls are pushing price action above the 4H 50-period MA, pointing to a potential test of the upper bound of the range.
With RSI momentum also picking up, the setup looks more bullish for the US Dollar. Watch reactions at 99.50 to see whether momentum continues from there.
Levels of Interest for the Dollar Index:
Resistance Levels
- 99.40 to 99.50 resistance — range highs
- 99.68 — Initial war spike
- 100.00 to 100.50 — Main resistance zone
- 100.544 — War highs
Support Levels
- 99.00 intraday pivot — range lows
- 98.50 to 98.70 — War pivot, now support
- 97.40 to 97.60 — Triple-bottom support
- 96.40 to 96.80 — 2025 lows support
- Range lows at early-2022 consolidation, just below 96.00
GBP/USD 4H Chart and Technical Levels
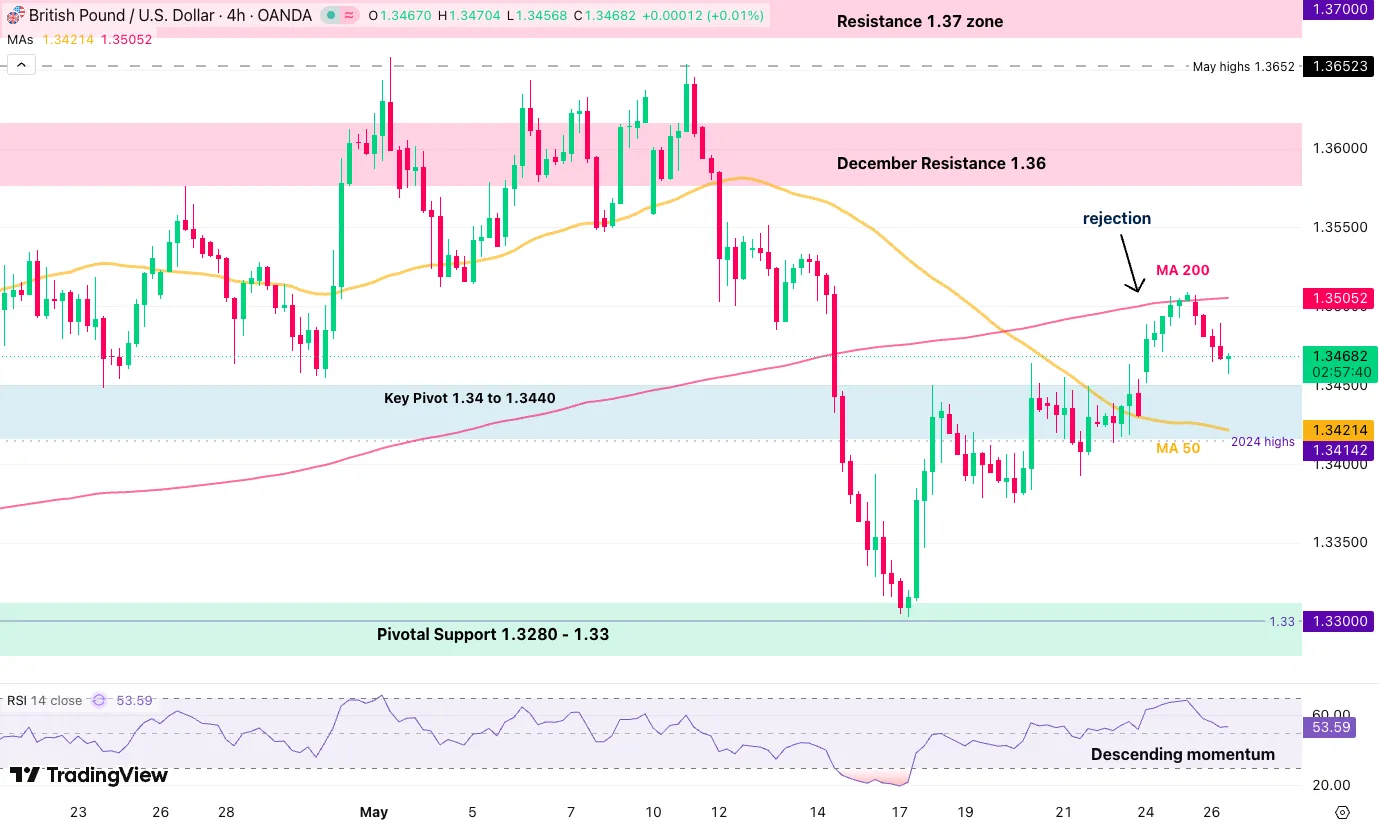
GBP/USD 4H Chart, May 28, 2026 – Source: TradingView.
GBP/USD kept rallying above the pivot zone but stalled right at its 4H 200-period MA around 1.3500.
With price currently retracing back toward the pivot zone, the action is more mixed than fully bearish. Traders could wait for either a double top around the MA or a break below 1.3420, the 50-MA, to confirm lower action.
Any close above the 200-MA would add further bullish momentum.
Levels of Interest for GBP/USD:
Resistance Levels
- 4H 200-period MA around 1.3500
- 1.3600 — December resistance and range highs
- 1.36010 — Pre-FOMC highs
- 1.3700 — Resistance zone
- 2025 resistance around 1.3800
Support Levels
- 1.3400 to 1.3440 — Key pivot
- 1.3280 to 1.3300 — Pivotal support
- 1.3200 — War support
EUR/USD 4H Chart and Technical Levels
EUR/USD 4H Chart, May 26, 2026 – Source: TradingView.
EUR/USD is rejecting its 4H 50-period MA, with RSI momentum also turning bearish, pointing to more downside ahead.
After failing to break the mid-level of the longer-run bear channel, the lower bound at 1.1580 could soon be retested.
Any break and close above 1.1660 would void the bearish formation.
Levels to Place on Your EUR/USD Charts:
Resistance Levels
- 1.1635 to 1.1655 — Pivot
- 1.1700 to 1.1720 — March resistance
- Resistance zone around 1.1800, plus or minus 150 pips
- 1.1830 — June 2025 highs
Support Levels
- 1.1580 — Channel lower bound
- 1.1540 to 1.1580 — War support
- 1.1475 to 1.1500 — November support
- 1.1410 — War lows
Safe trades!
Gold Loses Safe-Haven Edge as Geopolitics Fuel Inflation Fears
- Gold traders appear confused amid the Middle East conflict.
- Fed rate hike bets prevail, increasing the metal’s opportunity cost.
- Strong central bank demand is keeping losses limited.
- Heightened inflation fears could push gold below the key $4,500 zone.
Inflation Concerns Eliminate Gold’s Haven Appeal
It has been a very confusing period for gold traders lately, as they have been trying to figure out whether selling it or buying it is the appropriate strategy amid tensions in the Middle East.
The conflict began on February 28, and the initial reaction of the precious metal was to spike higher amid safe-haven demand. But as soon as investors started realizing that the closure of the Strait of Hormuz could result in accelerating inflation, they started liquidating their positions, feeling the pressure of rising yields around the globe and increasing bets that the Fed is unlikely to cut interest rates further. The metal hit a high of $5,420 and then sold off to hit a low of $4,345 on March 23.
A recovery followed as soft data sparked some recession fears, allowing the metal to reclaim its safe-haven status. That said, this did not last long, as the continued closure of the Hormuz Strait prompted major central banks to sound even more hawkish, with the RBA raising interest rates three times already, the ECB seen raising interest rates twice by the end of the year, and a strong chance being assigned to a Fed rate increase by December.
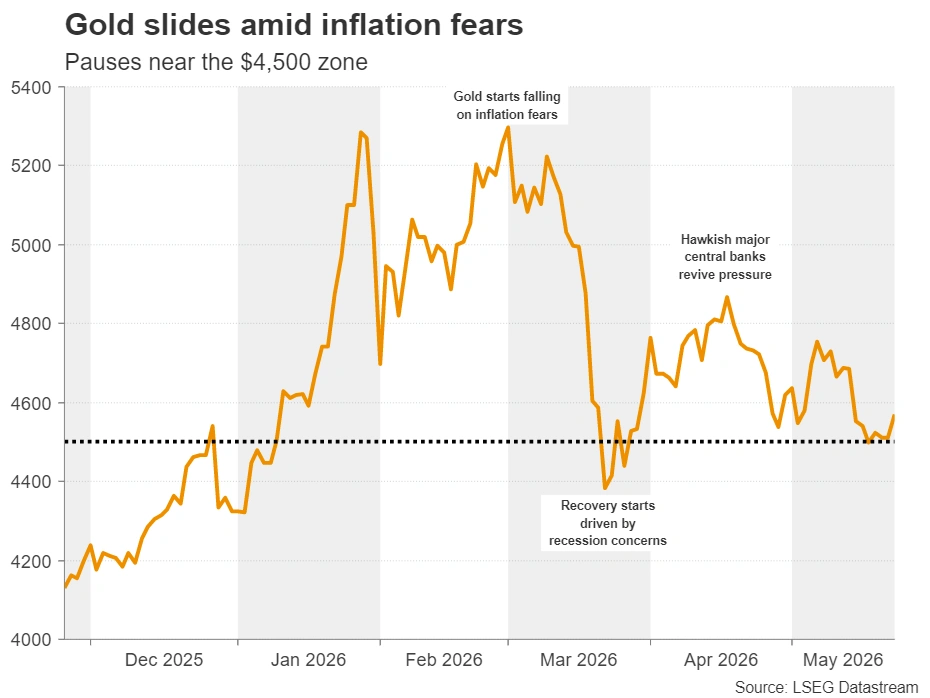
Following the recovery, the metal hit resistance at $4,890 and pulled back to settle near the $4,500 zone. Even with a ceasefire in place and headlines hitting the wires every now and then, traders appear unwilling to scale back their rate hike bets, which is required for reducing the opportunity cost of holding gold and thereby allowing a stronger recovery. Perhaps this is because every time a headline hits the wire about a potential peace deal, it is quickly refuted by an exchange of hostile rhetoric between US and Iranian officials, or by new attacks.
Central Bank Demand Increases in Q1 2026
But gold did not extend its losses either. One would have expected that further advances in Treasury yields and increasing rate hike bets would exert more pressure on the metal. But it didn’t.
Maybe a major supportive force is the continued demand by major central banks. According to the World Gold Council, central bank demand increased by 17% in Q1 compared to Q4 2025. This could mean that the de-dollarization scheme continues as several nations want to loosen their dependency on the US economy, and that banks may still be following an inflation-hedging strategy.
Elevated Inflation Increases Fed Rate Hike Chances
Moving ahead, despite gold’s support from major central banks, it is hard to envision a strong and robust recovery toward record highs any time soon. Even if the US and Iran agree on further negotiations and peace talks, as long as the Strait of Hormuz remains closed, rising oil prices could result in stickier headline inflation that feeds through into underlying price pressures.
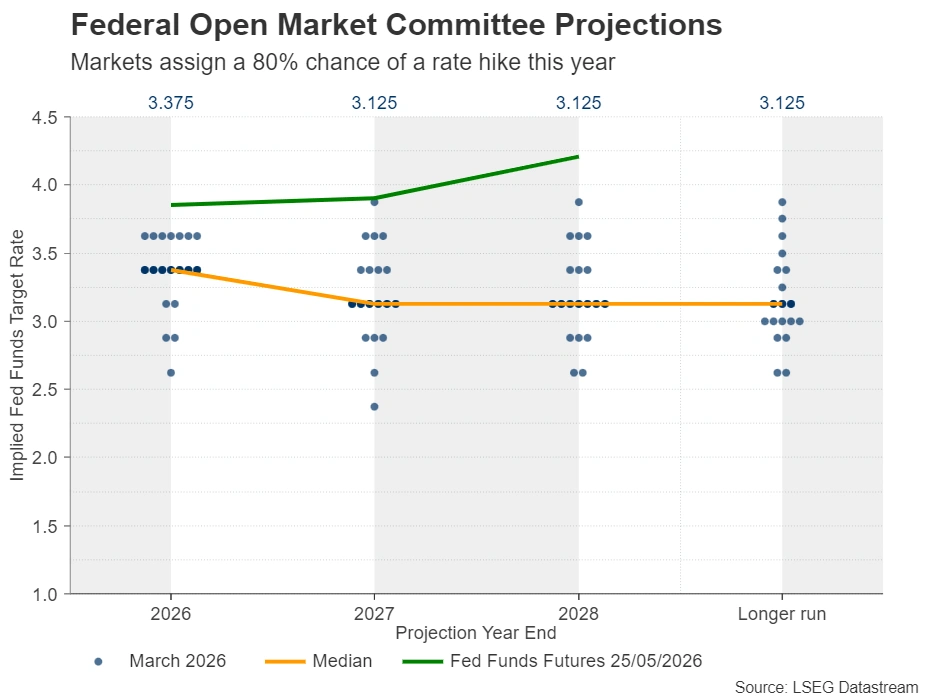
This could keep rate hike bets, and thereby Treasury yields, elevated, perhaps helping the US dollar recover some of its recently lost ground. According to Fed funds futures, a 25bps rate hike by the Fed is more than fully priced in for March 2027, while there is a strong 80% chance that this could happen by the end of this year.
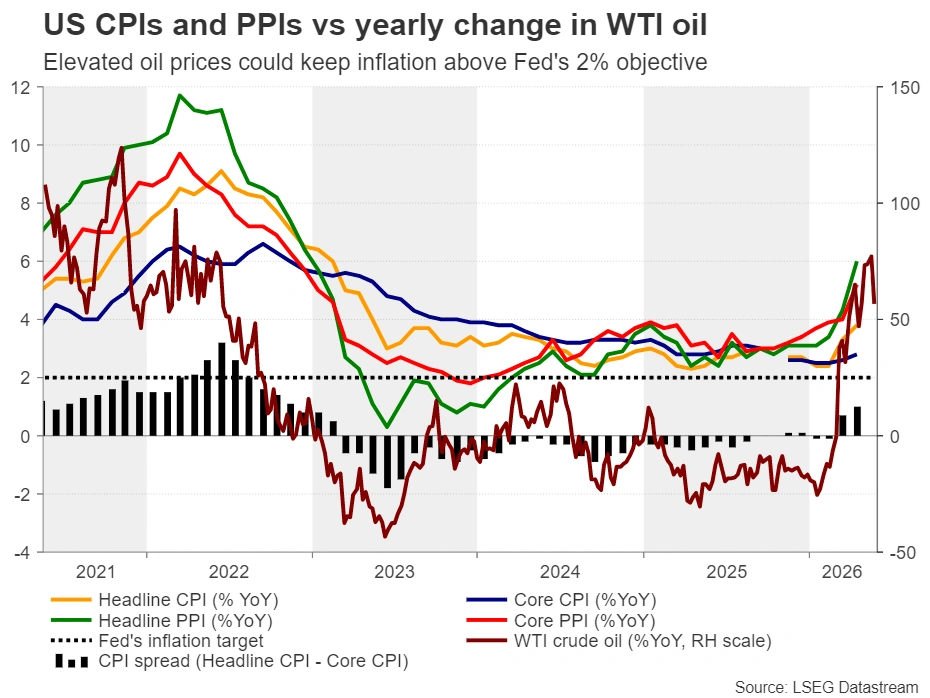
The hawkish narrative was boosted by the latest inflation data, with both the CPI and PPI figures revealing hotter-than-expected inflation for April. With the headline PPI rate surging at 6%, it seems that CPI inflation could remain elevated in the months to come, as producer prices could translate into higher consumer prices for products arriving on store shelves a few months after production. What also argues for a prolonged period of high inflation is the elevated oil prices. Despite the latest pullback, oil prices remain well above the levels seen a year ago, keeping the year-on-year rate high, meaning that it may take some time before annual inflation rates retreat to the Fed’s 2% objective.
Thus, US data corroborating that view may allow investors to bring the rate-hike timing closer. A reasonable timing for the Fed to press the hike button may be September. June or July may be too soon, as those would be the first meetings under the leadership of Kevin Warsh. Let’s not forget that Kevin Warsh was appointed by US President Trump on the basis that he will be more dovish than his predecessor, Jerome Powell. So beginning his term with a rate hike may not be the best strategy. Having said that, a major dovish shift is unlikely as well amid all these inflationary threats. Also, Jerome Powell is expected to remain within the Federal Reserve as a governor, and his more hawkish views could translate into rate-hike votes.
How Long Will the $4,500 Region Hold?
From a technical standpoint, the risks from a more hawkish Fed could translate into downside risks for gold. A decisive dip below $4,500 could invite more bears into the game and perhaps see scope for declines toward the 200-day exponential moving average, or the $4,345 zone. A break lower could carry more bearish implications, perhaps targeting the low of March 23 at $4,100.
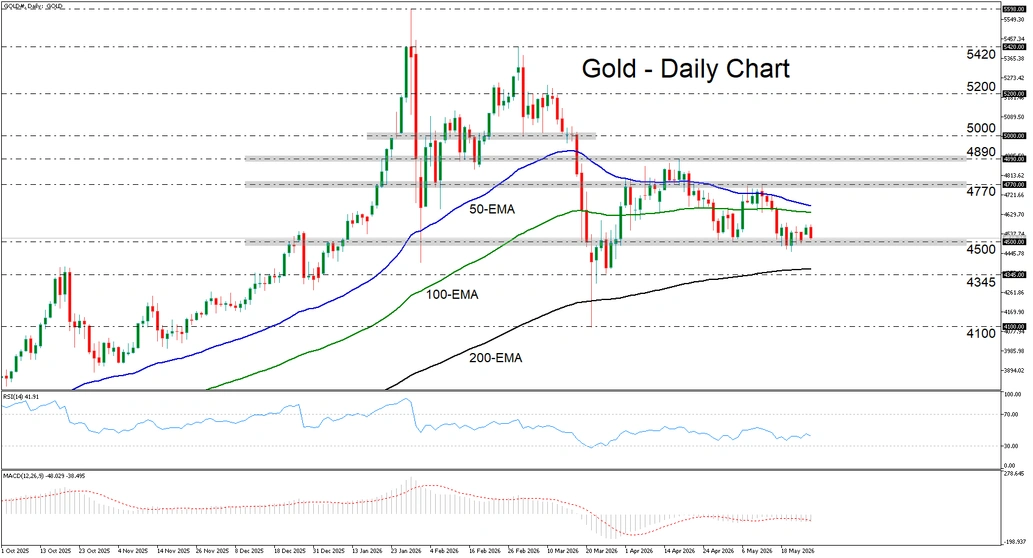
On the upside, the move signaling a brighter future may be a break above $4,770. This could initially target the $4,890 zone, marked by the high of April 17, a break of which could set the stage for advances toward the $5,200 area.
US Consumer Confidence Slips to 93.1 as Middle East Inflation Pressures Weigh on Households
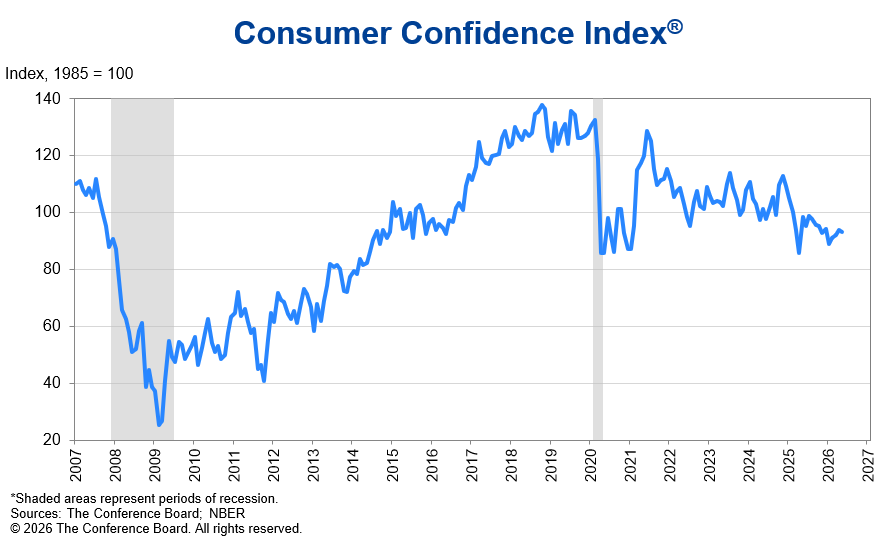
US Conference Board Consumer Confidence edged down from 93.8 to 93.1 in May, slightly beating expectations of 91.6 but still highlighting growing pressure on households from elevated energy costs tied to the Middle East conflict. The decline suggests consumers are becoming somewhat less comfortable with current economic conditions even as broader recession fears remain contained.
The deterioration was concentrated in assessments of present conditions. The Present Situation Index fell from 124.4 to 121.2, reflecting weaker views on current business and labor market conditions. However, the Expectations Index improved modestly from 73.4 to 74.4, suggesting consumers still see some stabilization ahead over the next six months despite ongoing geopolitical and inflation uncertainty.
Dana Peterson, Chief Economist at The Conference Board, said “consumer confidence edged downward in May as the inflationary impacts of the war in the Middle East intensified.” She added that consumers were “moderately less positive” about current business and labor conditions, though this was partly offset by improved expectations for the months ahead.
At the same time, Peterson warned that income expectations weakened as more consumers anticipated lower earnings, underscoring concerns that persistent inflation may increasingly pressure household purchasing power.
| Indicator | Previous | Latest | Expectation |
|---|---|---|---|
| Consumer Confidence | 93.8 | 93.1 | 91.6 |
| Present Situation Index | 124.4 | 121.2 | — |
| Expectations Index | 73.4 | 74.4 | — |
Sunset Market Commentary
Markets
US & UK markets desynchronized with (most) European markets today. After a holiday yesterday, the first two adapted to (presumed) positive headline news on a deal in the US-Iran conflict. EMU markets already are in the correction/reversal phase on yesterday’s hope-driven risk-repositing as hostilities in the Strait of Hormuz illustrate the fragility of the process. Whatever the outcome, the ECB clearly entered the finetuning phase ahead of the June 11 meeting. In the current environment, a central bank stays cautious on any guidance. Even so, the direction of thinking is clear. ECB Schabel in a Reuters interview said that the central bank needs to raise interest rates at the June meeting, even in in case a peace deal might be reached. “Given the size and the persistence of the current shock, looking through is no longer an option”. According to Schnabel the inflation dynamics already moved beyond the adverse scenario, which assumed a rapid normalization of the oil price. There are also ever growing signs of price increases spilling to other parts of the consumer basket. ECB Chief economist Lane was less outspoken in an interview with Nikkei. Even so, Lane also indicated that the central bank likely will make a further upward adjustment to the inflation forecast. Even as he didn’t formally say what scenario the ECB currently has to cope with, he “admitted” that oil prices are likely to remain elevated for longer than anticipated in the March scenario. He also sees indirect effects beyond energy prices. After easing by up to 10 bps yesterday, German yields today rebound between 5 bps (5-y) and 1.5 bps (30-y). Philip Lane indicated that this is not a context to give guidance on what has to happen beyond June. Markets currently discount 90% of a 25 bps June rate hike. A next step is almost fully discounted by September (80%). US yields are catching up with the decline in Europe yesterday, easing between 7 bps (2-y) and 5 bps (30-y). After yesterday’s setback, Brent oil also rebounds ($100/b) as markets try to assess the status of the progress in the negotiations between the US and Iran. In a similar divergence US equites still open with gains between 0.3% (Dow) and 0.8% (Nasdaq). The EuroStoxx 50 corrects 0.6% after yesterday’s gain of about 2%. The dollar rebounds modestly (DXY 99.1, EUR/USD 1.163) but moves mostly remain technically irrelevant.
News & Views
The Confederation of British Industry (CBI) latest quarterly Distributive Trades Survey showed retail price growth cooling in May amid weak demand. Sales volumes in the retail sector fell short of seasonal norms in May, while annual sales volumes continued to fall but at a slightly slower pace. Next month, sales are expected to remain “poor” for the time of year, with the sales decline in annual volumes set to ease slightly further. Weak demand continues to weigh on retailers’ sentiment, which has remained negative since mid-2024, as firms anticipate that their business situation will deteriorate over the coming quarter. Against this backdrop, retailers expect to pare back both investment and hiring plans, extending a period of weakness that dates back to 2022. CBI nevertheless commented that despite the weakness in demand, there are already signs of renewed price pressures in wholesalers’ selling price inflation coming from the conflict in the Middle East.
The Hungarian central bank (MNB) left its policy rate unchanged (6.25%). The MPC assesses that the inflation outlook has improved significantly. Consumer prices rose by 2.1% Y/Y in April with core CPI running at 2.2%. Both figures were lower than projected in the March Inflation Report, placing inflation near the lower bound of the tolerance band. The stronger forint, as well as the postponed phaseout of regulated fuel prices and price margin caps moderate the rate of price increases. Corporate price expectations rose but still indicate subdued dynamics. Household inflation expectations declined further. All point to a more moderate inflation outlook despite upside risks from energy and commodity prices, opening the door to rate cut(s). The MNB for now sticks to the view that price stability can be achieved through tight monetary conditions. Going forward, it holds a data-dependent approach in which the persistence of the decrease in risk premia will also play a role. HUF swap rates today lose 11 to 14 bps across the curve. The forint is unfazed at EUR/HUF 355.
Oil Stabilizes Near Lows, Peace Trade Cooling But Not Collapsing
Optimism surrounding a US-Iran peace agreement faded slightly today. Fresh military activity and tougher negotiation rhetoric cooled some of the aggressive optimism that swept across markets earlier this week. Yet the broader market message remains surprisingly calm: traders still believe some form of deal is more likely than collapse.
That confidence is visible most clearly in oil markets. Brent crude recovered modestly today but remained near $96 a barrel — dramatically below last week’s panic highs above $110. US 10-year Treasury yields also continued slipping below 4.5%, while US equity futures pointed higher again. In other words, markets may have stopped aggressively adding to the peace trade, but they are not meaningfully reversing it either.
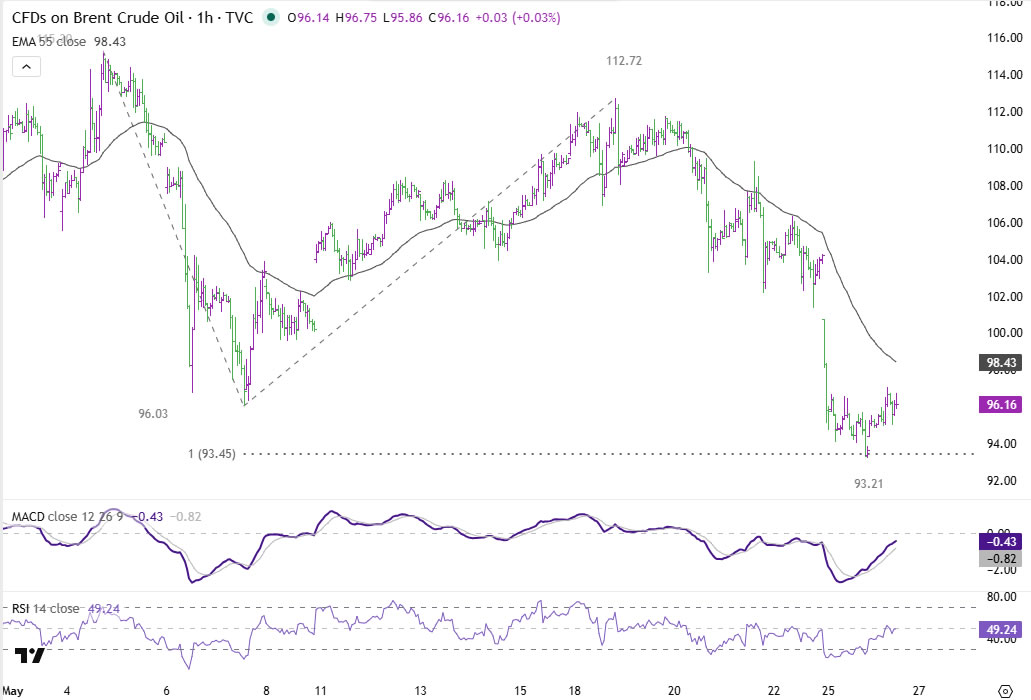
The latest headlines, however, exposed just how fragile the current ceasefire remains. U.S. Central Command confirmed “self-defense strikes” near Bandar Abbas targeting Iranian-linked vessels allegedly attempting to deploy mines as well as missile launch sites. Iran’s Revolutionary Guard responded by warning of retaliation after engaging U.S. drones and an F-35 jet fighter that entered Iranian airspace. The coexistence of active military operations and ongoing diplomacy is the defining feature of this conflict.
Negotiations themselves are also entering the harder implementation stage. Iran’s Tasnim agency described talks with Washington as “overall good,” but said the proposed memorandum of understanding depends on the release of USD 24 billion in frozen Iranian funds. Top negotiator Mohammad Baqr Qalibaf has reportedly traveled to Qatar to finalize that mechanism, with Tehran demanding half the funds upfront simply to sign the 14-point agreement. Meanwhile, US President Donald Trump warned there would either be “a Great Deal for all or, no Deal at all,” while U.S. Secretary of State Marco Rubio acknowledged the process could still “take a few days.”
Currency markets reflected that more cautious tone. Dollar rebounded as traders partially unwound aggressive anti-Dollar positioning tied to rapid Hormuz normalization hopes. Euro firmed up after ECB Chief Economist Philip Lane and Executive Board member Isabel Schnabel strongly reinforced expectations for a June rate hike. Schnabel’s warning that the economic damage from the conflict may already be irreversible even if peace is reached immediately reinforced the view that central banks may still need to tighten despite falling oil prices.
For now, markets are essentially defending the peace trade rather than expanding it. Oil prices, bond yields, and equities all continue suggesting investors still expect eventual normalization. But conviction is no longer as strong as it was at the start of the week.
USD/JPY Rising Again, Markets May Test Japan Before They Test Iran
The “peace dividend” trade that crushed oil prices and weakened Dollar earlier this week is starting to wobble. As optimism over a rapid US-Iran agreement fades and USD/JPY climbs, traders may soon test Tokyo’s intervention tolerance at 160 before negotiators even finalize a Hormuz deal. Read More.
ECB’s Lane Says Inflation Outlook Worsened as June Hike Expectations Build
ECB Chief Economist Philip Lane gave markets little reason to doubt that another rate hike is approaching in June. Lane said inflation forecasts will likely be revised higher again next month as the Iran conflict keeps oil prices elevated and adds “upward pressure on inflation” across the Eurozone economy. Read More
ECB’s Schnabel Says Iran Peace Deal May Already Be Too Late to Avoid June Hike
ECB Executive Board member Isabel Schnabel warned that even a US-Iran peace deal may no longer be enough to stop a June rate hike. Schnabel said the ECB can no longer “look through” the energy shock because inflation pressures are already spreading into the broader Eurozone economy through second-round effects and rising inflation expectations. Read More.
Euro Fights “Two-Front War” Against Sterling and Swiss Franc
Euro may be rising against Dollar this week, but it is quietly losing ground in the more important relative-value battles against Sterling and Swiss Franc. Weak Eurozone PMIs, falling bond yields, and collapsing oil prices are exposing growing vulnerabilities in EUR/GBP and EUR/CHF as traders increasingly favor UK manufacturing resilience and renewed CHF demand. Read More.
BoJ’s Himino Keeps Hawkish Tone but Signals Caution on Middle East Shock
Bank of Japan Deputy Governor Shinichi Himino reaffirmed that the BoJ will continue raising rates, but warned that Middle East tensions could still reshape Japan’s economic outlook. Himino said rising global bond yields reflect “global concerns about inflation” while emphasizing that policymakers are closely monitoring oil prices, market functionality, and geopolitical risks before deciding the pace of further tightening. Read More.
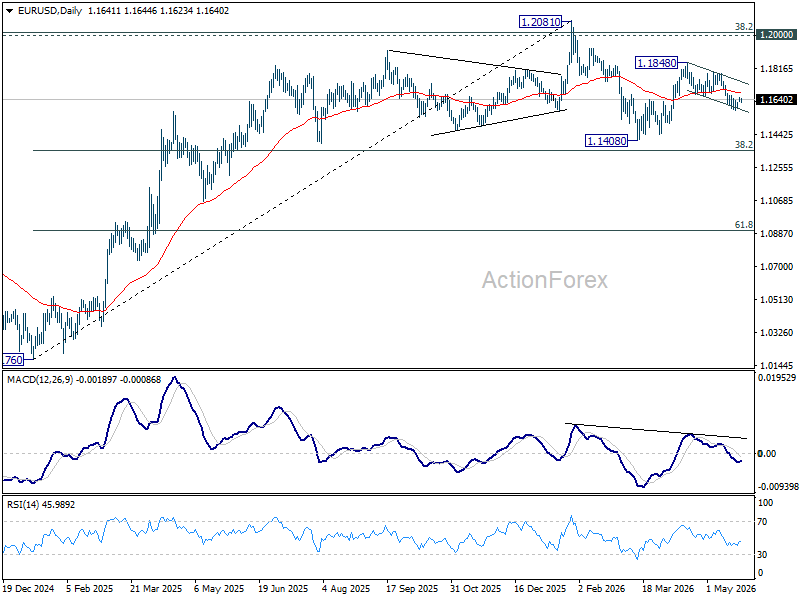
EUR/USD Daily Outlook
Range trading continues in EUR/USD and intraday bias stays neutral at this point. On the upside, firm break of 1.1660 resistance will argue that fall from 1.1848 has completed as a correction at 1.1575. Intraday bias will be back on the upside for 1.1795 resistance first. On the downside, break of 1.1575 will solidify the case that rebound from 1.1408 has completed at 1.1848, and bring deeper fall back to retest 1.1408 low.
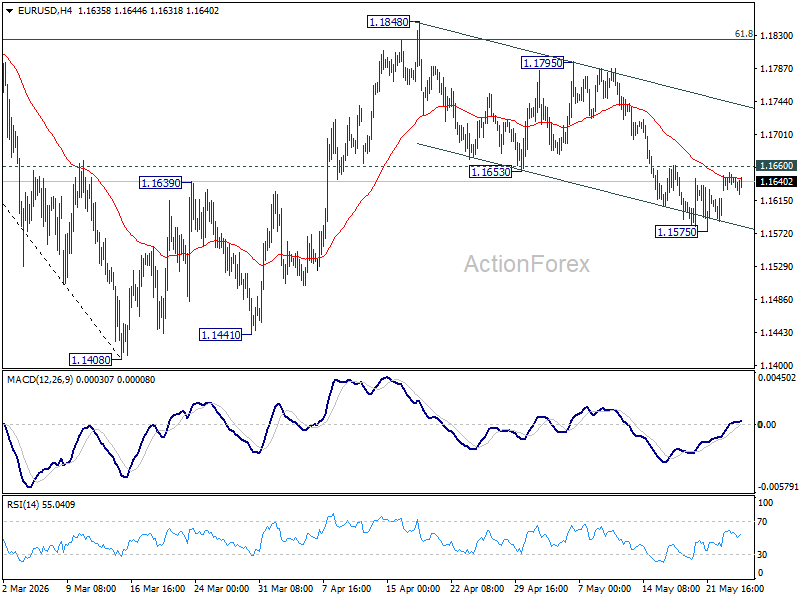
In the bigger picture, the strong support from 38.2% retracement of 1.0176 to 1.2081 at 1.1353 suggests that the pullback from 1.2081 is more likely a corrective move. Strong support was also found in 55 W EMA (now at 1.1544). Focus is back on 1.2 key cluster resistance level. Decisive break there will carry long term bullish implications. Nevertheless, break of 1.1408 support will revive the case of medium term bearish trend reversal.
ECB’s Lane Says Inflation Outlook Worsened as June Hike Expectations Build
European Central Bank Chief Economist Philip Lane gave markets little reason to doubt that a rate hike is approaching next month. As investors increasingly price tighter policy following the Middle East energy shock, Lane signaled that policymakers are comfortable with those expectations, saying, “I don't think the market needs some kind of extra guidance from us.”
His remarks add to a growing chorus inside the ECB arguing that the inflation consequences of the Iran conflict are becoming more persistent. Lane warned that “there are several factors related to the Iran war that show that the macroeconomic outlook has gotten worse,” while also acknowledging that oil prices are likely to remain elevated for longer than the ECB had projected in March.
Although stronger U.S. natural gas exports could help stabilize energy markets, he stressed that “on net” the impact has still been “upward pressure on inflation.”
Perhaps most importantly for markets, Lane confirmed that the ECB is preparing to raise its inflation forecasts again in June. “We are likely to make a further upward adjustment to the inflation forecast in June,” he said.