
Sample Category Title
EUR/AUD Daily Outlook
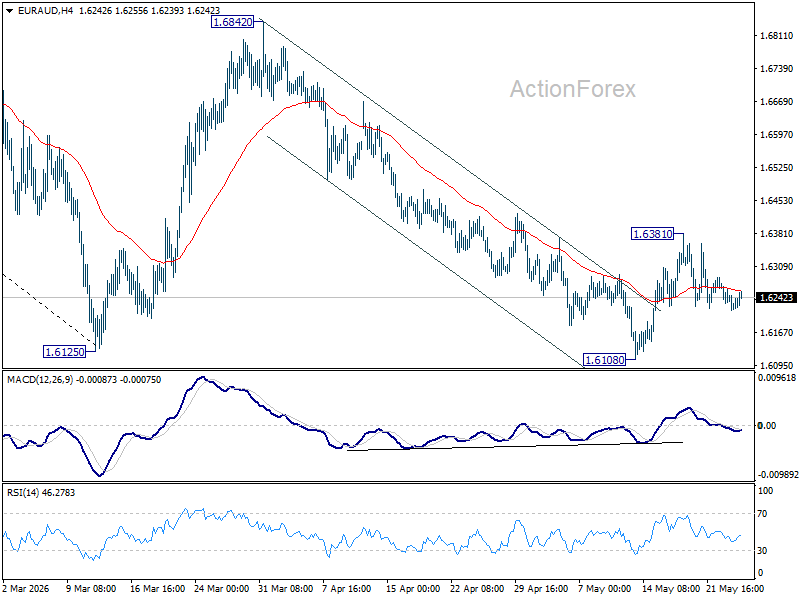
EUR/AUD is still bounded in range trading and intraday bias stays neutral. Rise from 1.6108 is tentatively seen as the third leg of the pattern from 1.6125. Above 1.6381 will target 55 D EMA (now at 1.6422) and above. Nevertheless, firm break of 1.6108 will resume the larger down trend from 1.8554.
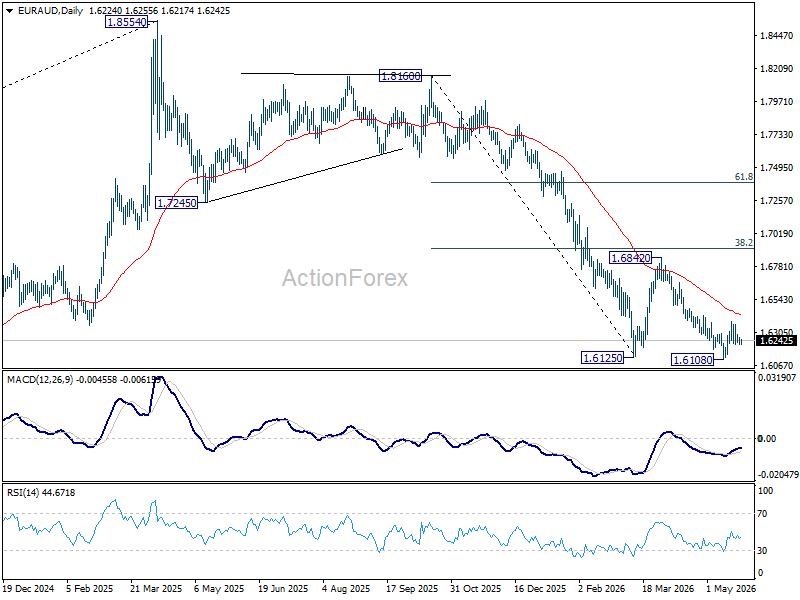
In the bigger picture, fall from 1.8554 (2025 high) is in progress and deeper decline should be seen to 61.8% retracement of 1.4281 to 1.8554 at 1.5913, which is slightly below 1.5963 structural support. Decisive break there will pave the way back to 1.4281 (2022 low). For now, risk will stay on the downside as long as 55 W EMA (now at 1.6984) holds, even in case of strong rebound.
EUR/CHF Daily Outlook
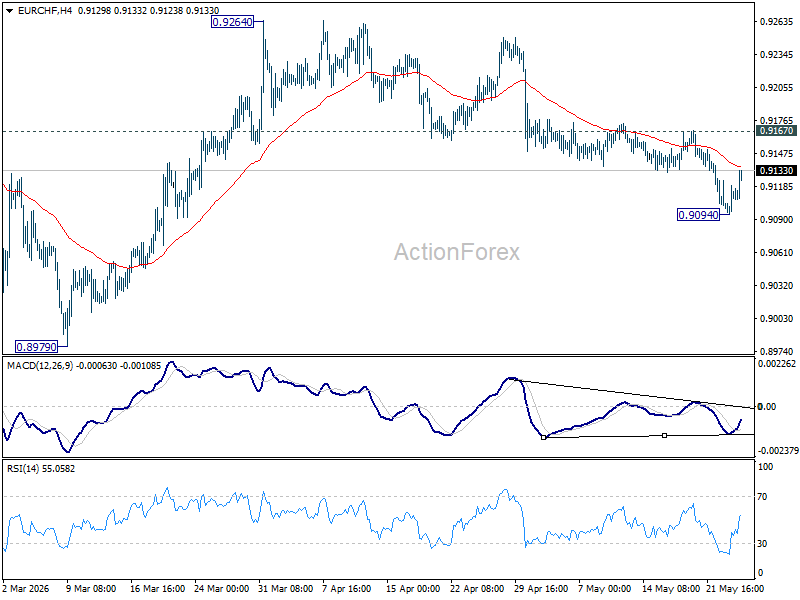
Intraday bias in EUR/CHF is turned neutral with current recovery, and some consolidations could be seen above 0.9094 temporary low. Risk will stay on the downside as long as 0.9167 resistance holds. Rebound from 0.8979 should have completed at 0.9264. Below 0.9094 will target a retest on 0.8979 low. However, firm break of 0.9167 will dampen this bearish view, and bring stronger rise back to retest 0.9264 instead.
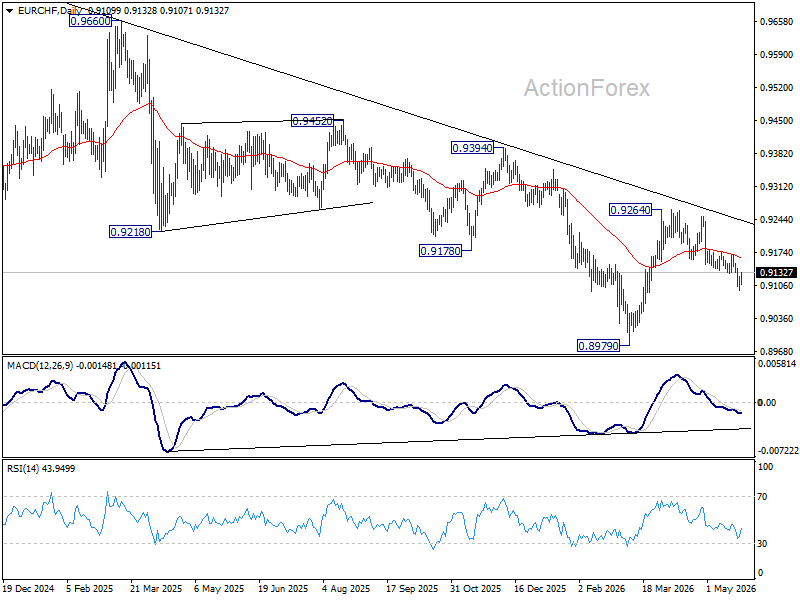
In the bigger picture, the rejection by 55 W EMA (now at 0.9252) suggests that the down trend from 0.9928 (2024 high) is still in progress. Firm break of 0.8979 will confirm down trend resumption. Outlook will stay bearish as long as 0.9394 resistance holds, in case of another rebound.
Three Scenarios for EURUSD
- An escalation of the conflict in the Middle East will send the euro tumbling.
- A deal between the US and Iran could trigger a rollercoaster ride for EURUSD.
The US dollar has stalled amid the increasingly complex situation in the Middle East. Donald Trump has stated that negotiations with Iran are going well, saying that the outcome will be either a major deal or no deal at all. Both sides appear keen to avoid a return to open conflict. However, the attack by US ships on mine-laying vessels in the Strait of Hormuz has led to mutual missile strikes between the opposing sides.
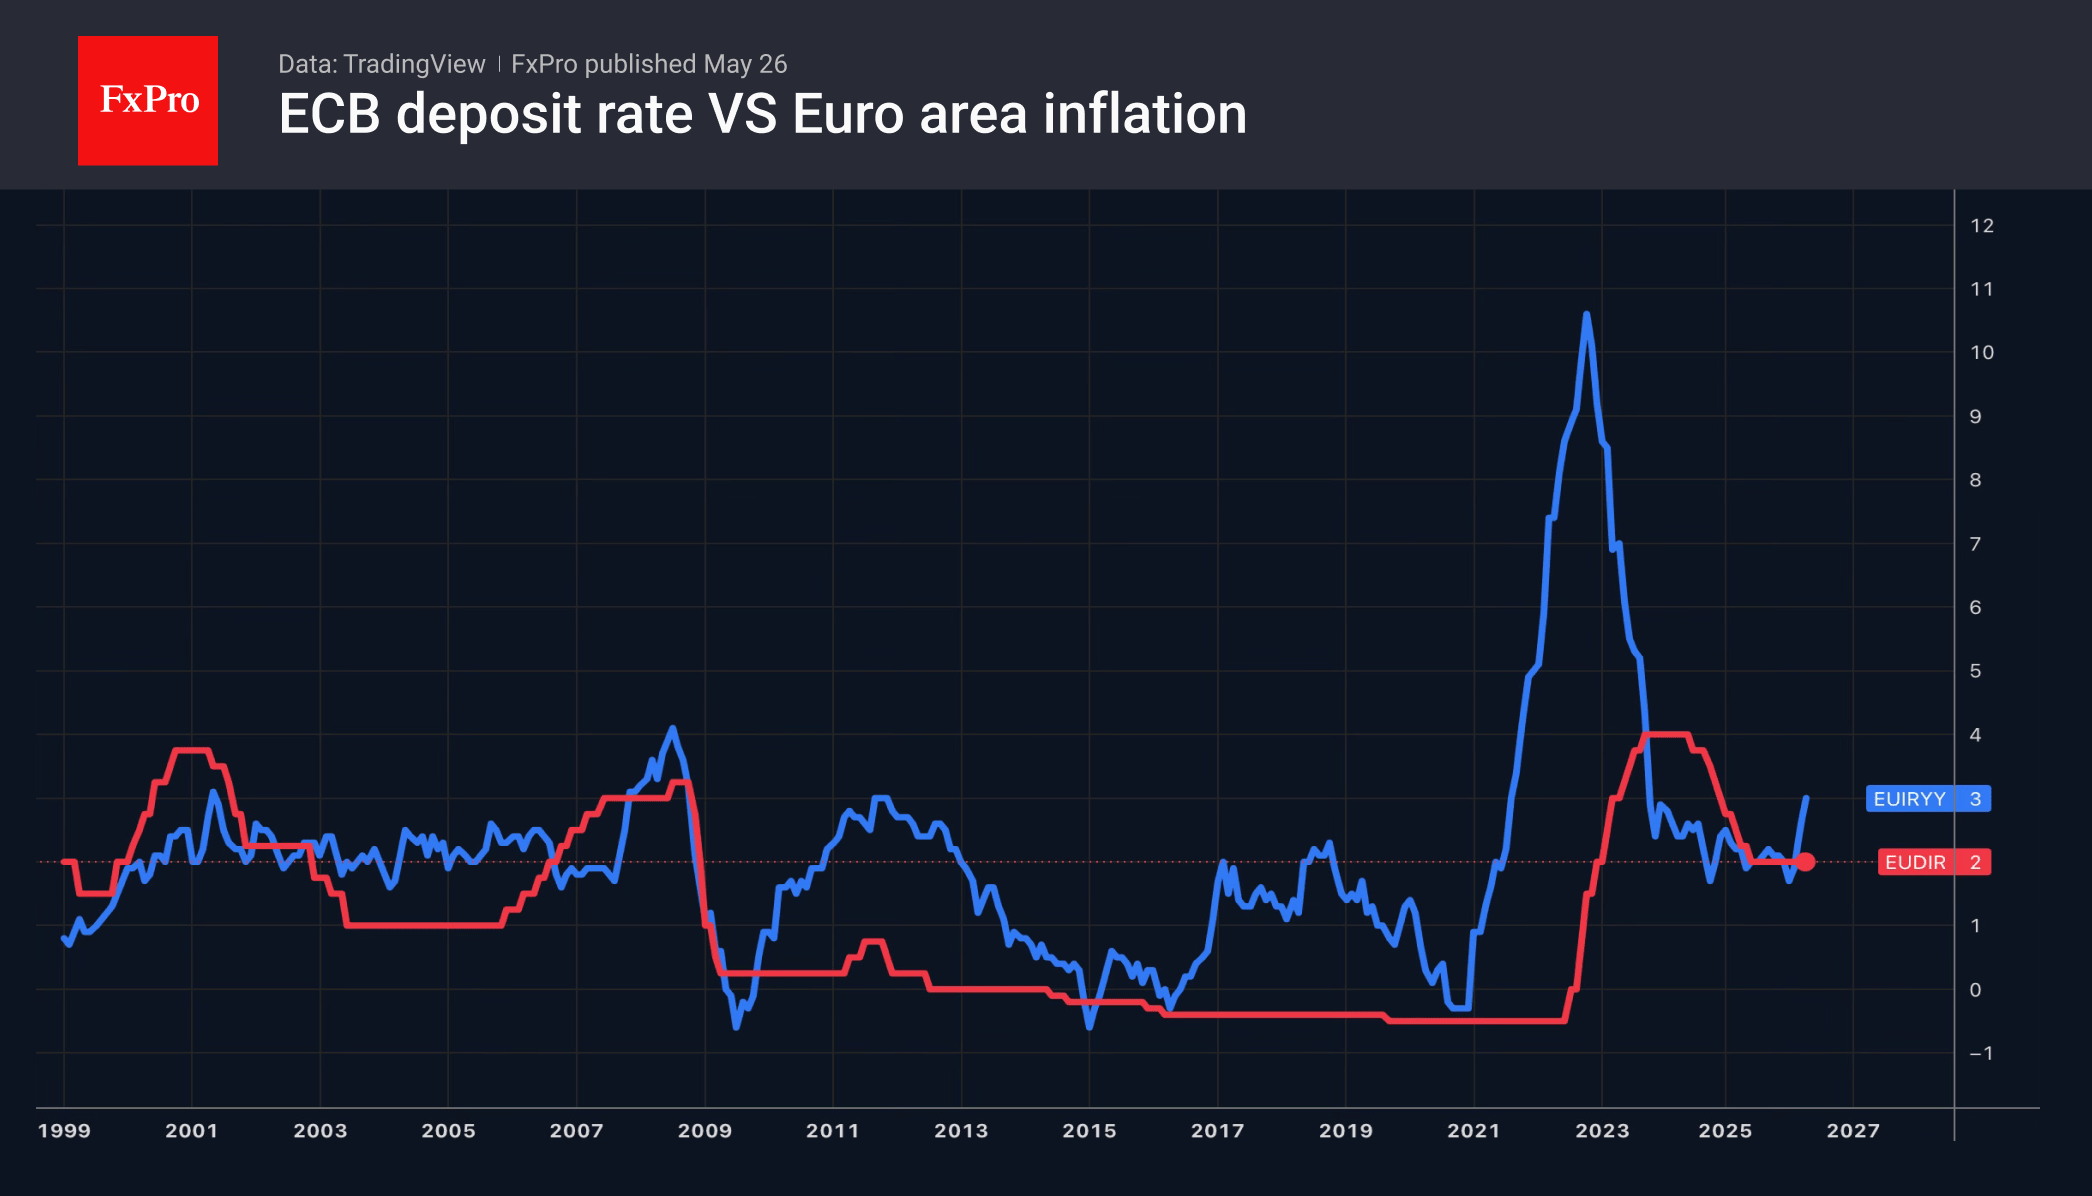
Without a significant de-escalation, the EUR risks continuing to decline. According to François Villeroy de Galhau, the ECB has not yet seen any signs of second-order effects on inflation. This means the deposit rate will rise by less than markets expect.
Meanwhile, signals from the Fed are becoming more hawkish, reinforcing the view that the federal funds rate will rise in 2026. Christopher Waller stated that, given the stabilising labour market and stubbornly high inflation, it would be madness to talk about cutting rates. It will not be easy for Kevin Warsh to convince the Committee of the need for monetary expansion if he intends to do so.
An agreement between the US and Iran could turn everything on its head. A fall in oil prices following the reopening of the Strait of Hormuz would reinforce the view that the inflation acceleration is temporary. The chances of the Fed tightening monetary policy under these conditions will fall rapidly from the current 55%, putting pressure on the dollar. The pace of growth in the EURUSD rate will depend on how quickly markets shift from the view that the Fed will keep rates steady to the view that it will cut them.
We should not rule out the possibility that the US-Iran deal will once again fall through due to differences in the parties’ positions. Any renewed escalation in the conflict would likely restore demand for the dollar as a safe-haven asset.
For now, the baseline scenario is one in which the US and Iran first reach an agreement to open the Strait of Hormuz before moving on to broader discussions surrounding the nuclear programme. A deadlock in negotiations risks leading to a new blockage of the world’s main oil artery. The risks are high, so tanker owners will be extremely cautious in moving their cargoes. Oil prices are unlikely to fall sharply, and inflation remaining at elevated levels will force the Fed to keep rate hikes on the cards. The result will be a rollercoaster ride for EURUSD.
USD/JPY Rising Again, Markets May Test Japan Before They Test Iran
The powerful “peace dividend” trade that swept through global markets earlier this week is beginning to lose momentum, and USD/JPY is quickly emerging as one of the clearest expressions of that shift. As optimism over a rapid US-Iran agreement fades slightly and the pair resumes its climb toward the politically sensitive 160 zone, markets may soon test Tokyo’s tolerance for Yen weakness before they fully test whether Tehran is actually ready to sign a final deal.
Fresh reports of U.S. military strikes on Iranian-linked targets near Bandar Abbas, combined with renewed caution from U.S. Secretary of State Marco Rubio, forced traders to reassess expectations for an imminent US-Iran agreement and reopening of the Strait of Hormuz.
The latest strikes, described by U.S. Central Command as “self-defense” actions against boats allegedly attempting to lay mines and active missile sites, served as a reminder that the seven-week ceasefire remains fragile. Rubio also cooled expectations by warning that negotiations could still “take a few days” to finalize. Those comments effectively interrupted the aggressive market repricing that had previously pushed oil sharply lower, weakened Dollar, and fueled a broad risk rally across global equities.
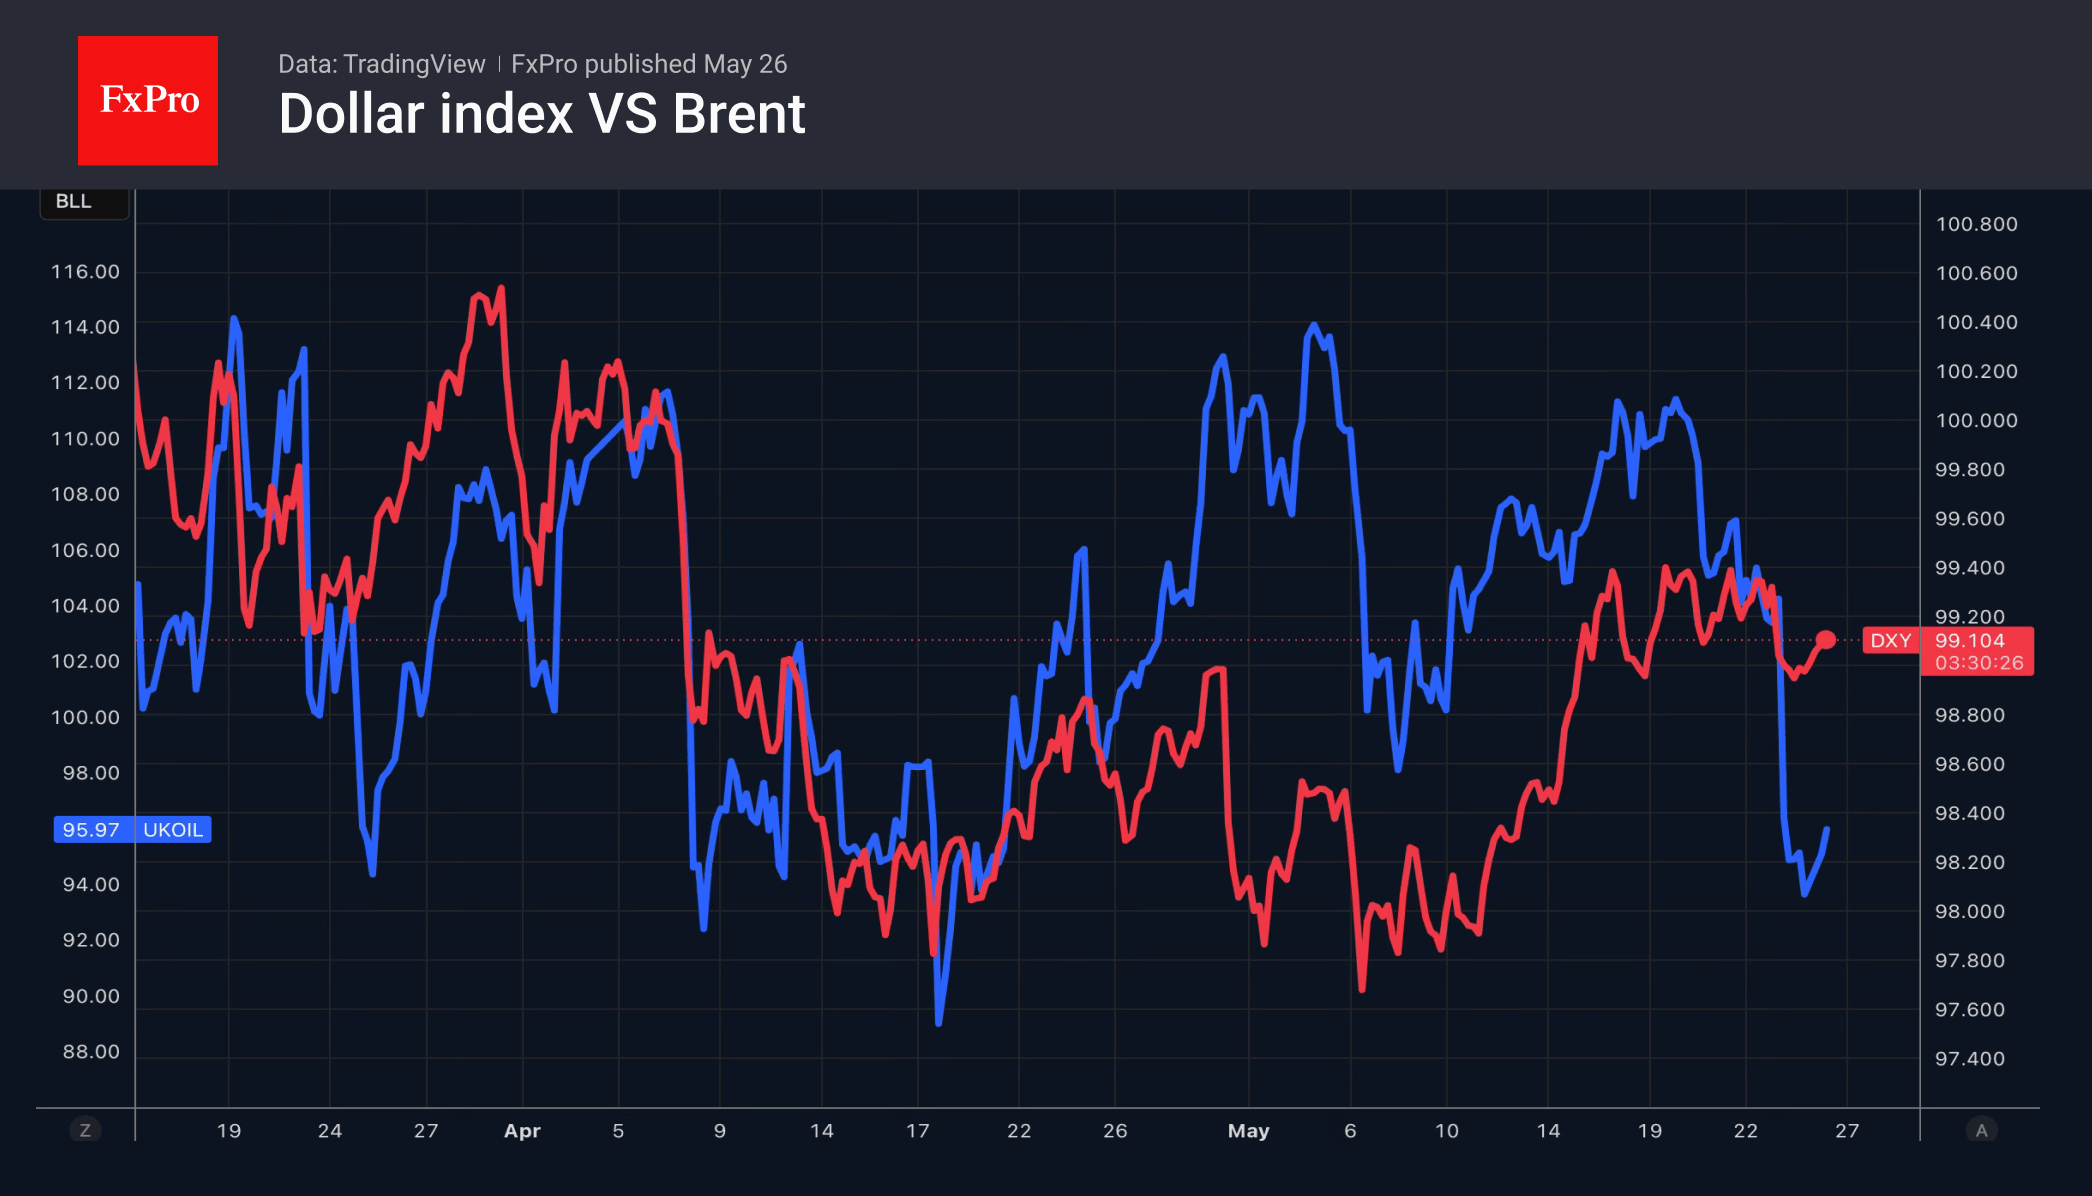
As optimism receded, Brent crude recovered modestly back above $96 level while Dollar stabilized broadly in currency markets. Yen underperformed again with the geopolitical headlines. The rebound in USD/JPY reflects the market’s realization that the disinflation trade linked to a rapid Hormuz reopening may have moved too quickly.
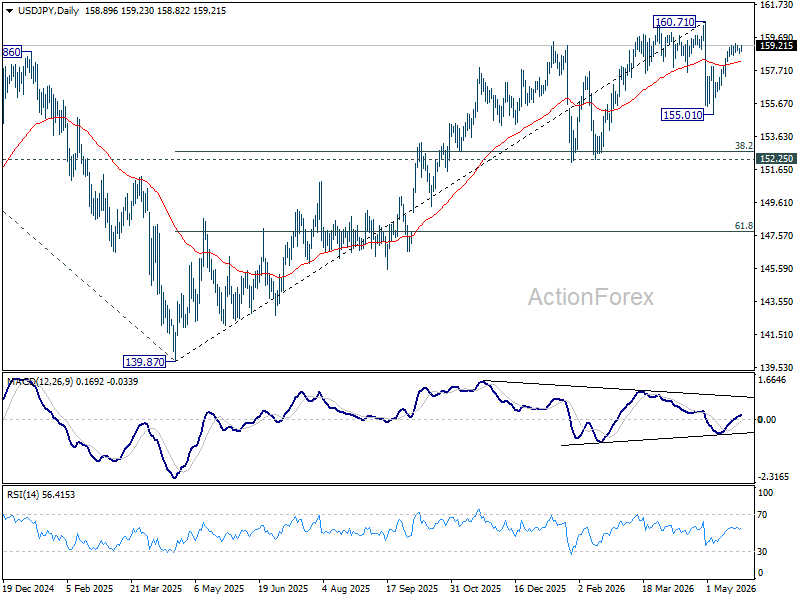
Technically, USD/JPY now appears capable of breaking above the 159.33 temporary high to extend the rebound from 155.01. However, the move is still viewed as the second leg of the broader corrective pattern from 160.71. Strong resistance is expected near that intervention-sensitive zone, particularly with 160 still widely viewed as Tokyo’s “line in the sand” for potential intervention.
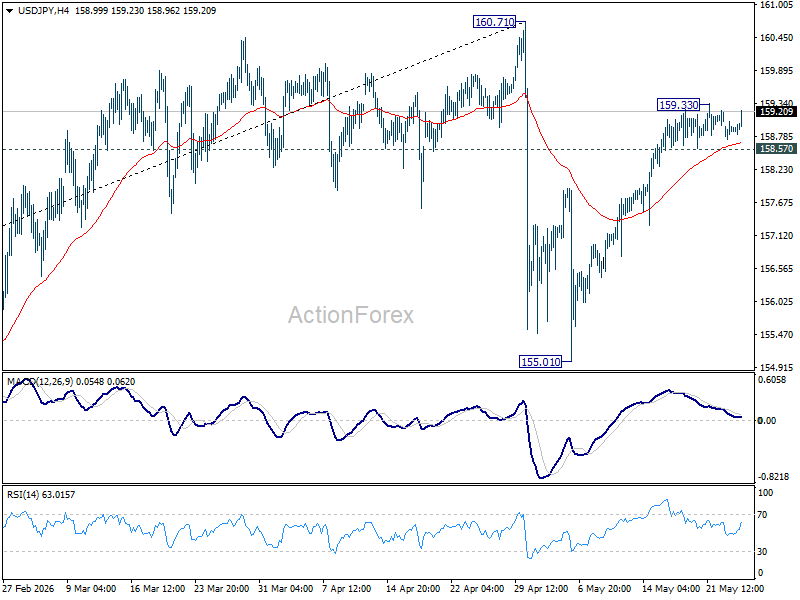 Meanwhile, break of 158.57 minor support will bring deeper fall back to 55 D EMA (now at 158.21). Sustained break there would argue that the third leg has already started and target 155.01 support next.
GBP/USD Bulls Get Rejected at 200-SMA
Overview: GBP/USD shifted into corrective mode after its upward trajectory off six-week lows was rejected near the 200-SMA, signaling fading bullish momentum and increasing downside risks in the coming sessions.
Momentum: The RSI and stochastic peaked in the overbought area and are now pushing lower. The MACD is drifting toward its red signal line, endorsing the softer price action.
Bearish scenario: A decisive break below the support trendline and the 1.3450 number could pave the way to 1.3400. Additional declines from there could extend to 1.3370.
Risk: A durable move above the 200-SMA and the 61.8% Fibonacci level of 1.3520 could revive upside pressure toward 1.3555. From there, the bulls may attempt to breach the 1.3580 mark with scope to reach May’s triple top around 1.3650.
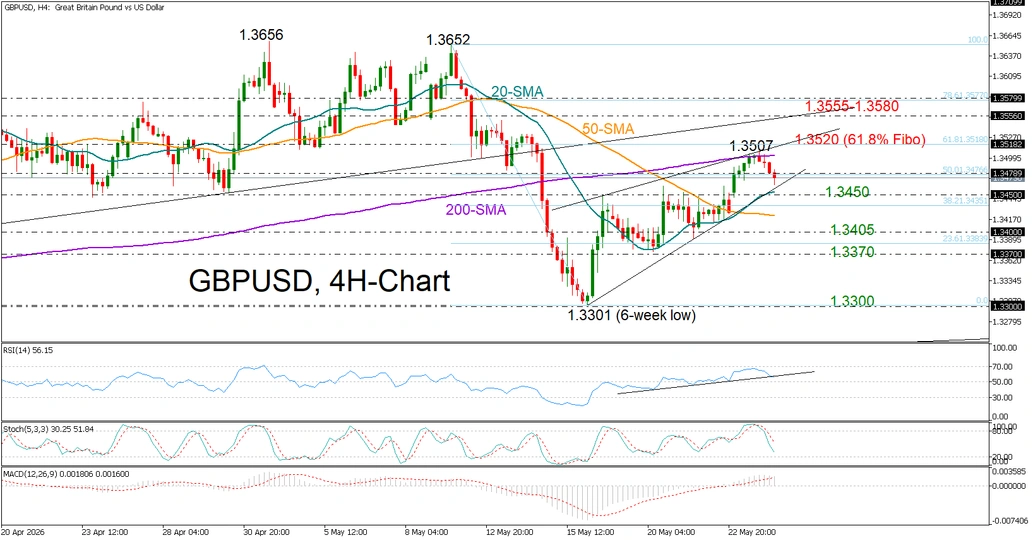
Chart Alert: AUD/NZD Rally Set to Continue After Hitting 13-Year High
Key Takeaways
- AUD/NZD remains in a firm medium-term uptrend after hitting a fresh 13-year high, supported by widening Australian-New Zealand bond yield spreads and stronger RBA hawkishness versus the RBNZ.
- Markets expect the RBNZ to deliver a “hawkish hold” at 2.25%, but investors continue to price in a relatively more aggressive tightening path from the RBA amid persistent inflation pressures.
- Technical indicators suggest bullish momentum remains intact above 1.2130 support, with AUD/NZD poised for a potential breakout above 1.2250 toward 1.2310 and 1.2380/2400.
New Zealand’s central bank, the RBNZ, is set to announce its monetary policy decision tomorrow, Wednesday, 27 May 2026, at 10:00 SGT, followed by Governor Breman’s press conference an hour later.
Market participants expect the RBNZ to hold its official cash rate at 2.25%. The RBNZ has maintained a “wait-and-see” approach since ending its rate-cut cycle in November 2025, citing stagflation risks arising from the US-Iran conflict during its April meeting.
The RBNZ will also publish its latest official cash rate forecast track in Wednesday’s monetary policy release, with money markets fully pricing in a 25-basis-point hike in September and additional expectations for two more 25-bps hikes in Q4 2026.
As a result, markets are anticipating a “hawkish hold” from the RBNZ tomorrow, especially as New Zealand’s Q1 2026 core inflation rate remained elevated at 3.2% y/y, above the RBNZ’s long-term 1%-3% inflation target range.
RBNZ Lags RBA in Hawkish Monetary Policy Stance
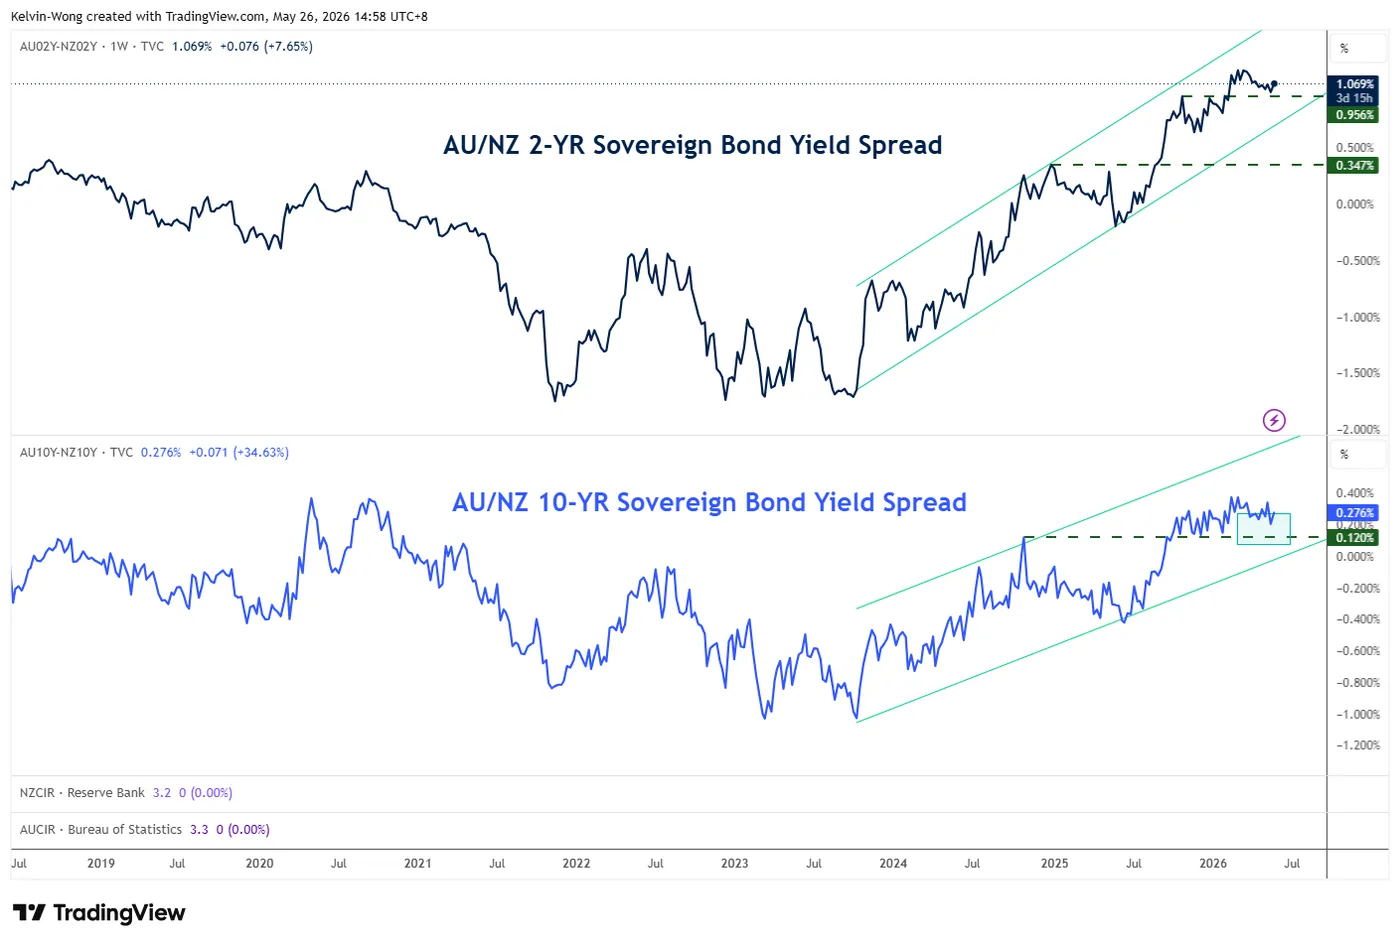
Fig. 1: Australia-New Zealand 2-year and 10-year sovereign bond yield trends as of 26 May 2026 (Source: TradingView).
Despite the RBNZ’s expected “hawkish hold” guidance, it continues to lag behind its antipodean counterpart, the RBA. So far in 2026, the RBA has raised rates three times for a cumulative 75 basis points.
Fixed-income markets continue to price in a more hawkish RBA relative to the RBNZ.
The 2-year bond yield spread, which is highly sensitive to shifts in monetary policy expectations, between Australian and New Zealand sovereign bonds has maintained a major uptrend since October 2023. Recent price action rebounded to 1.07% from 0.99% recorded during the week of 18 May 2026.
A similar trend is visible in the longer-term 10-year bond yield spread, which is more sensitive to inflation dynamics. The spread has remained resilient near 0.28%, trading close to a six-year high.
As a result, a further expansion in the yield premium of Australian sovereign bonds over New Zealand bonds is likely to generate additional upside pressure on the AUD/NZD cross.
Let’s now examine the medium-term, one-to-three-week trajectory for AUD/NZD from a technical analysis perspective.
AUD/NZD – Poised for a Bullish Breakout Above 1.2250
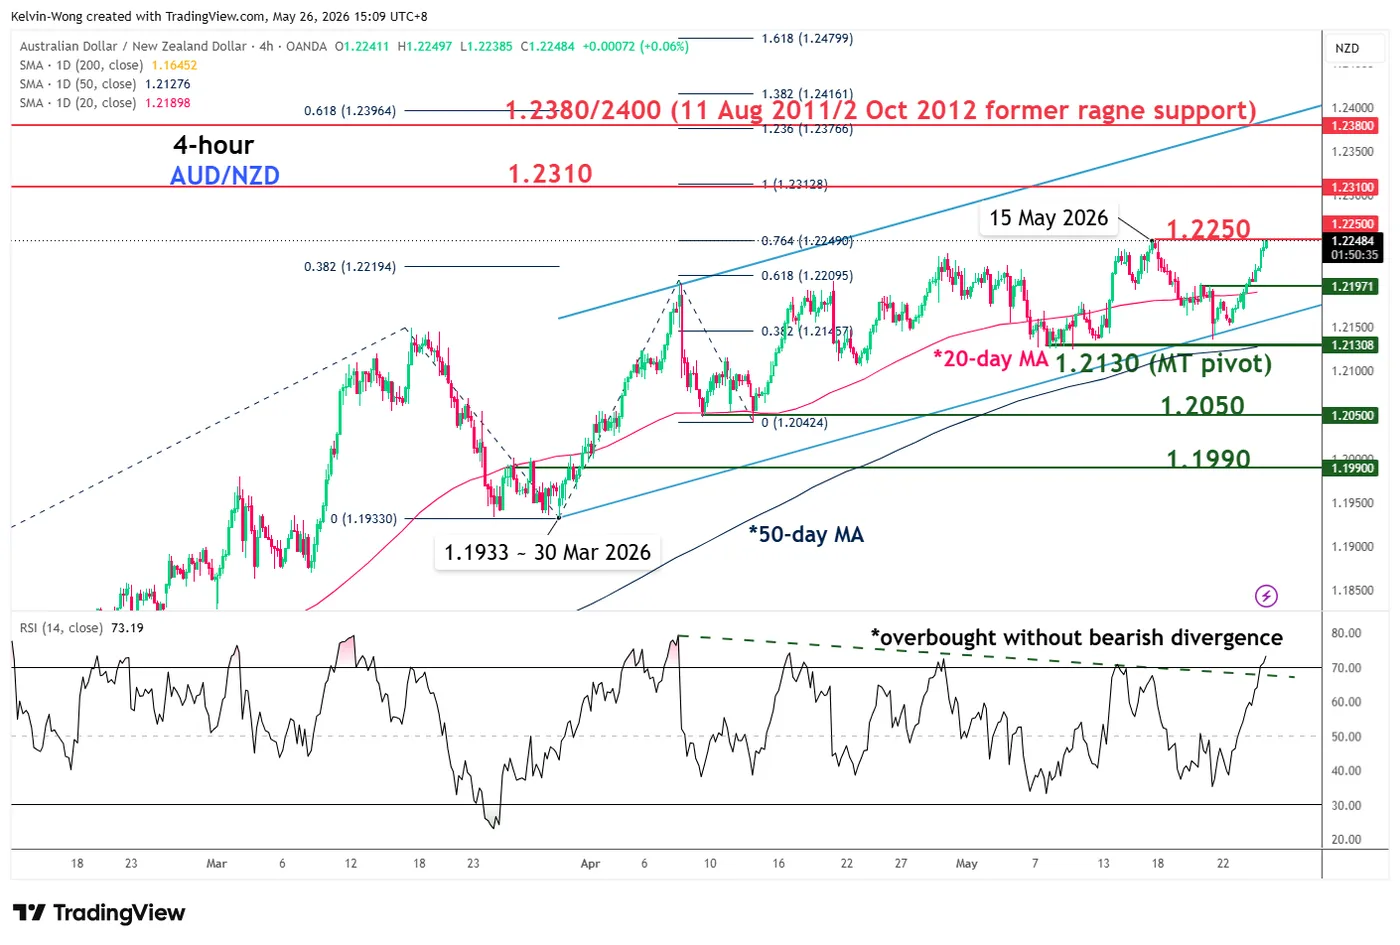
Fig. 2: AUD/NZD medium-term trend as of 26 May 2026 (Source: TradingView).
Trend bias: Bullish above the 1.2130 key medium-term pivotal support.
Resistances: 1.2250 (15 May 2026 minor swing high), 1.2310 (Fibonacci extension), and 1.2380/2400 (Fibonacci extension, ascending channel upper boundary, and former range support from August 2011 and October 2012).
Next supports: 1.2050 (9 April and 14 April 2026 swing lows), and 1.1990 (25 March and 31 March 2026 former minor range resistance).
Key Elements Supporting the Medium-Term Bullish Bias on AUD/NZD
- The price action of AUD/NZD has continued to trade above its 20-day and 50-day moving averages since 4 February 2026, suggesting that the medium-term uptrend remains intact.
- The 4-hour RSI momentum indicator has staged a bullish breakout above a key descending resistance and entered overbought territory above the 70 level without any bearish divergence signal. These observations suggest medium-term bullish momentum conditions remain intact.
The Crypto Market Juggling Altcoins
Market Overview
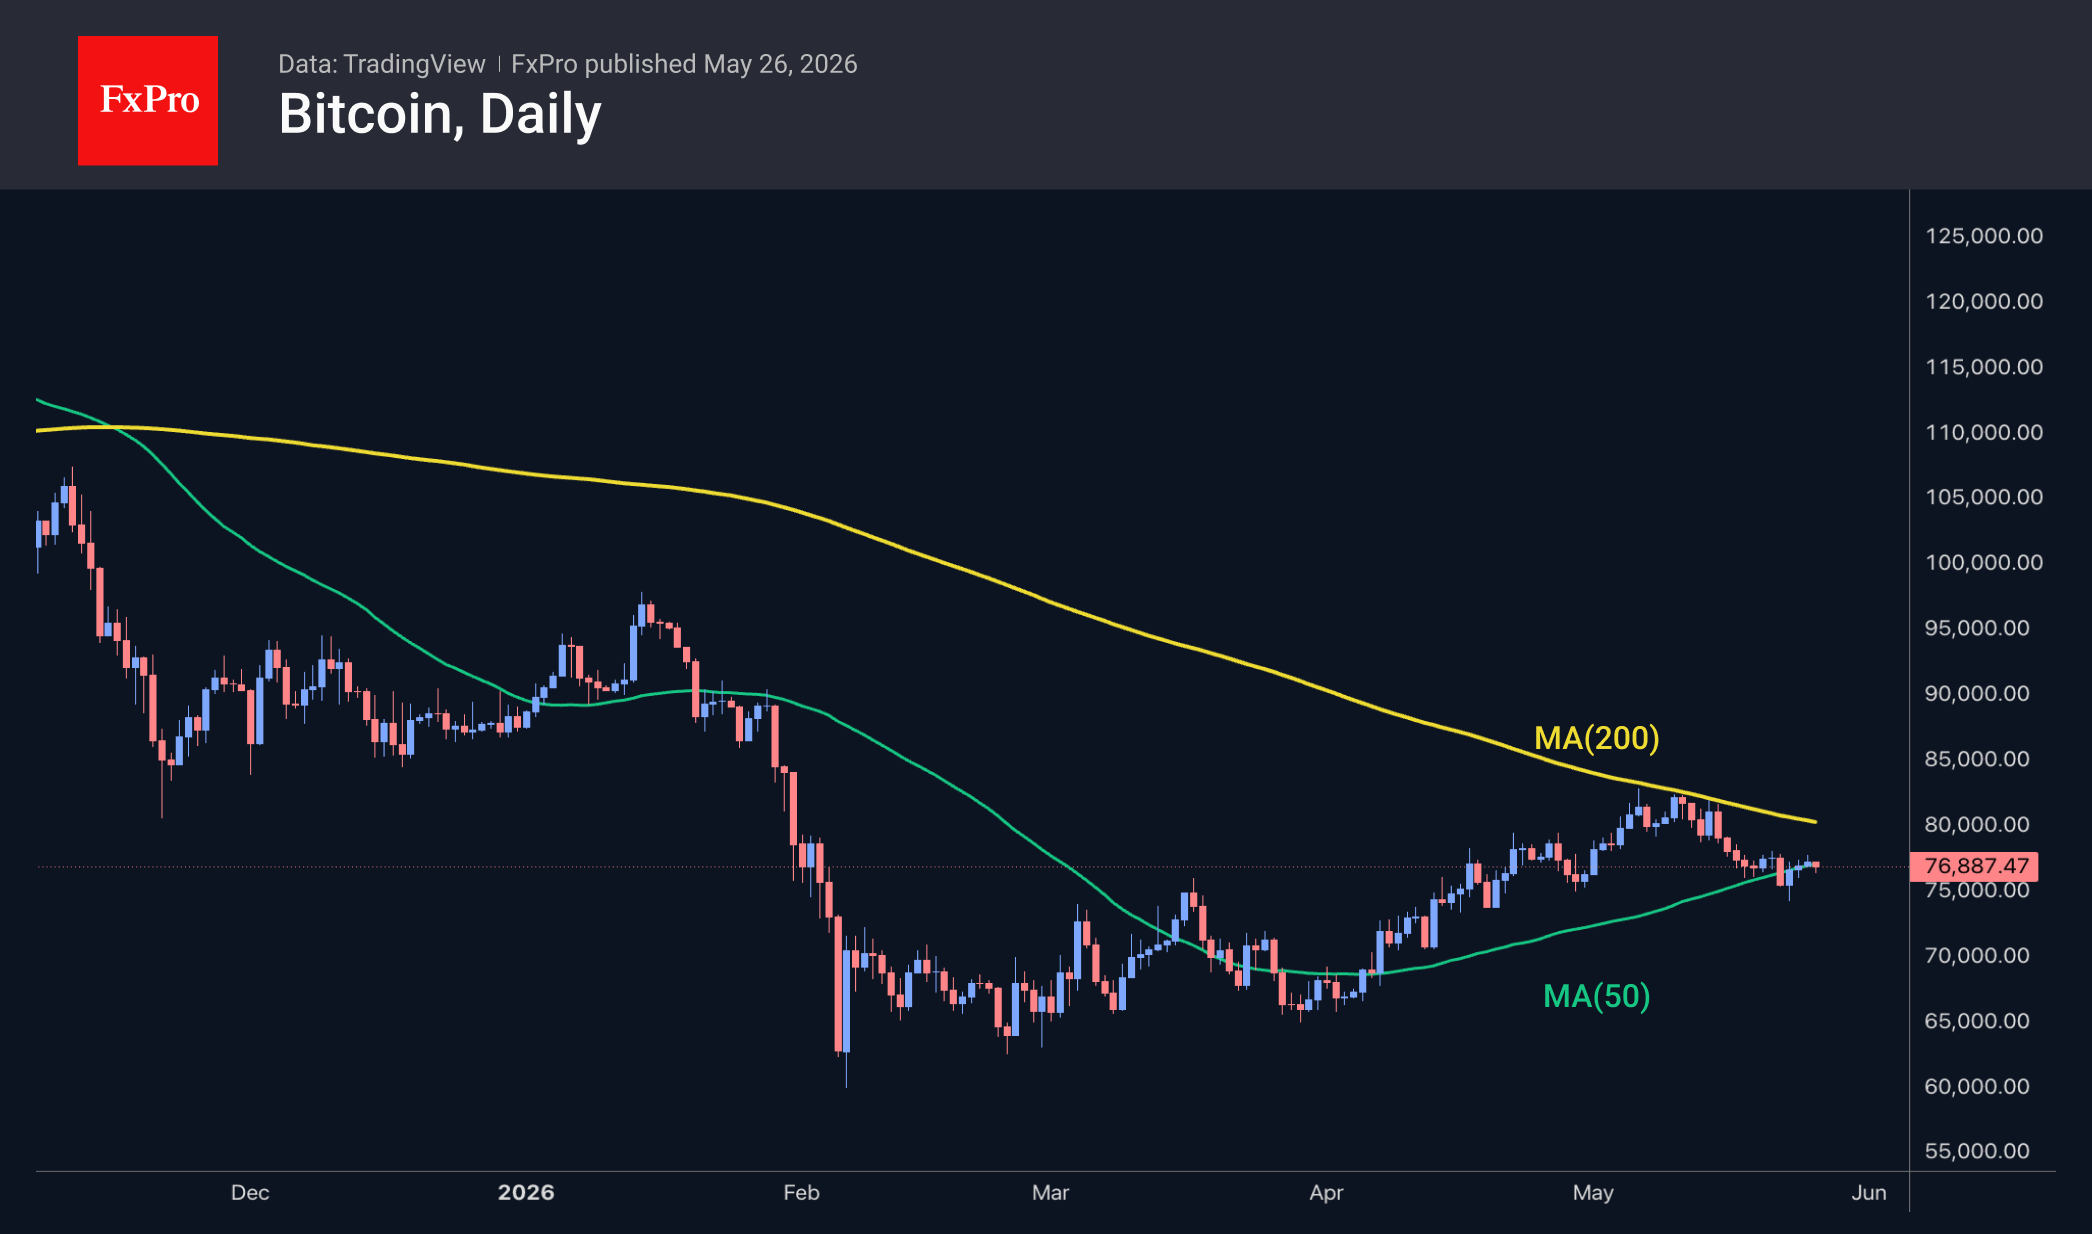
The crypto market remains stagnant, stuck at $2.57T and hovering around the 50-day moving average, awaiting further signals. The crypto market’s overall sideways movement looks like a juggling act for mid-tier altcoins: one after another takes the lead. Among the most popular coins over the last 24 hours are NEAR Protocol (+14%), The Graph (+5.6%) and Toncoin (+4.5%). The underperformers were Zcash (-5.9%), Dash (-4.1%) and Uniswap (-3.1%).
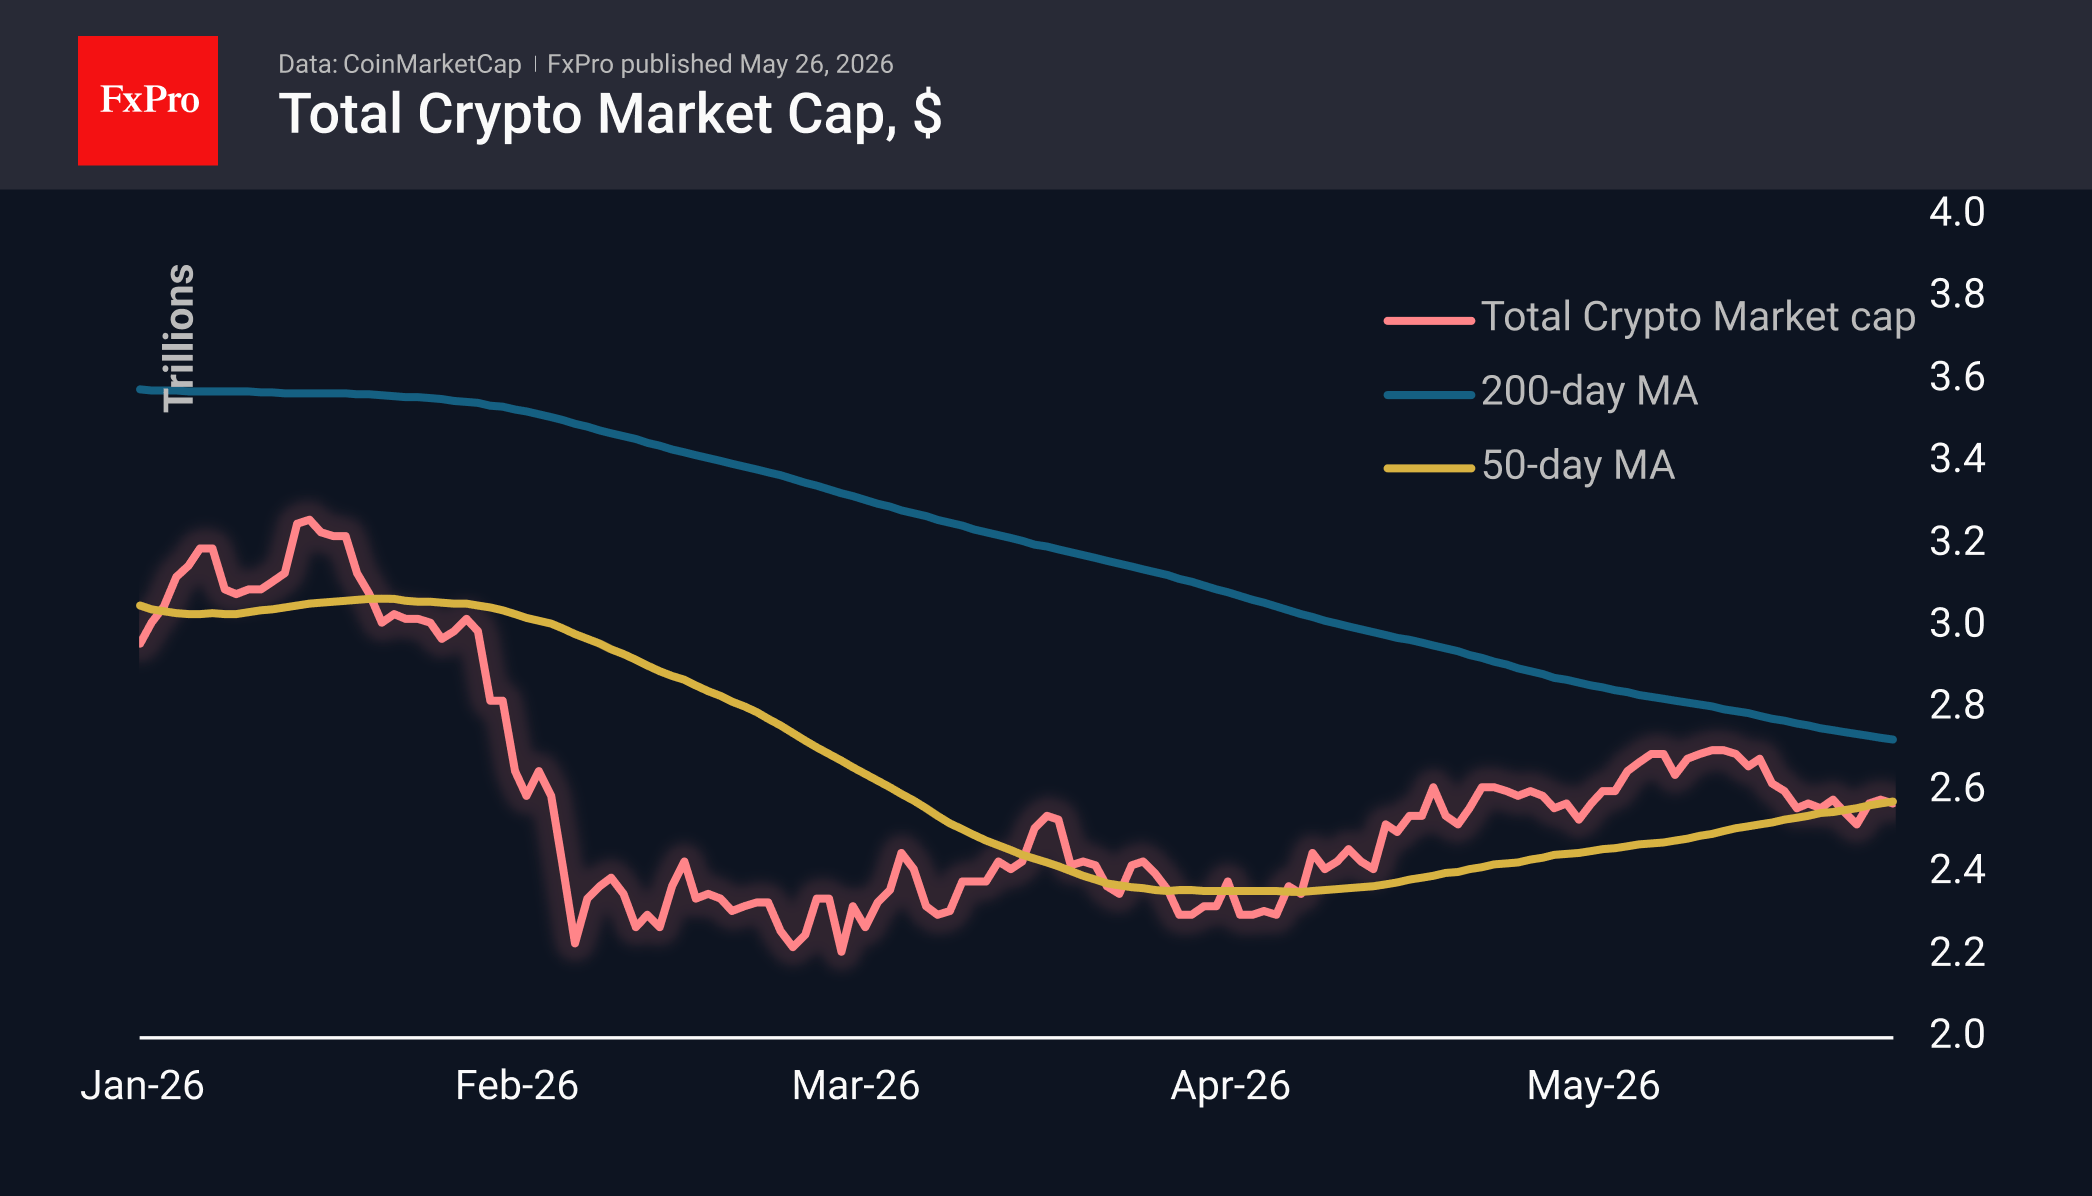
Bitcoin rose to $77.8K at the end of the day on Monday, but by the start of trading in Europe, it was trading $1,000 lower. The coin is finding support near the upward-sloping 50-day moving average. Earlier in May, the 200-day moving average briefly acted as strong resistance. If current trends continue, these lines will cross in just a couple of weeks, forming a golden cross, a strong bullish signal. But even before that, we may see a breakout of one of the key moving averages, the outcome of which will determine the trajectory of Bitcoin and the entire crypto market for the coming weeks.
News Background
Institutional investors have withdrawn $1.74 billion from Bitcoin ETFs over the past two weeks. Meanwhile, retail traders are increasing their leverage in anticipation of a reversal in the BTC price. In the past, such a combination has repeatedly resulted in severe waves of liquidations, according to a CryptoOnchain report.
Current Ethereum levels are suitable for building long-term positions, according to MN Trading founder Michael van de Poppe. In his view, the asset remains a crucial infrastructure element of the on-chain ecosystem, despite lagging the market in recent months due to macroeconomic factors.
The US Securities and Exchange Commission (SEC) has approved the listing of options on a Bitcoin index calculated based on BTC prices across multiple exchanges. This is the first such instrument on US stock exchanges currently; only options linked to the value of spot crypto ETF shares are traded there.
Strategy skipped its weekly Bitcoin purchase last week, instead buying back $1.5 billion of its own convertible bonds. The company’s founder, Michael Saylor, publicly revealed for the first time the tactic that Strategy has been using for five years.
GBP/USD Under Pressure Amid Growing Domestic Concerns
GBP/USD retreated slightly on Tuesday after a positive Monday, moving down to 1.3486. The market continues to assess the economic data released late last week. The US dollar has so far drawn support from lingering uncertainty in the Middle East, which has encouraged investor caution and supported demand for safe-haven assets.
April data showed UK retail sales fell 1.3% month-on-month, the sharpest decline in nearly a year and noticeably worse than market forecasts. Consumers are cutting back on spending amid high fuel prices, rising energy bills, and concerns around the Middle East conflict.
Earlier labour market data also signalled a weakening outlook. Unemployment continues to rise, while real wage growth remains weak amid accelerating inflation.
Additional pressure on British assets comes from deteriorating public finances. The UK budget deficit in April was the highest since the COVID-19 pandemic, with borrowing rising to £24.3 billion, the second-highest April figure on record.
Despite this, the pound has partially recovered from the political pressures of recent weeks. The market continues to monitor the situation surrounding Prime Minister Keir Starmer following the Labour Party's weak results in local elections.
Technical Analysis
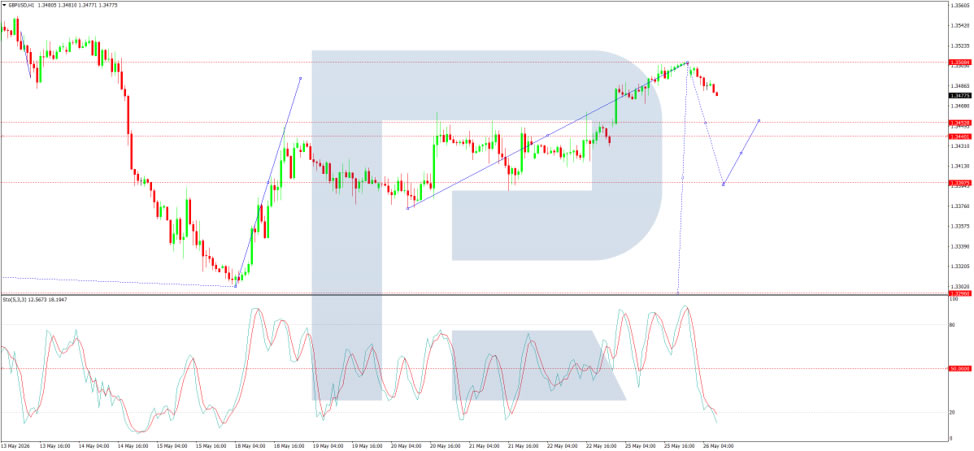
On the H4 chart, the GBP/USD pair has reached the 1.3500 level and is trading within a broad consolidation range above 1.3434. A move lower towards 1.3393 is likely in the near term. After this, the pair may consolidate, with potential for a move towards 1.3455 on the upside or a decline towards 1.3290 on the downside. The MACD indicator supports this scenario, with its signal line above zero and pointing firmly downwards, indicating weakening bullish momentum.

On the H1 chart, GBP/USD is trading within a compact consolidation range around 1.3494, currently extending up to 1.3500. A move lower towards 1.3393 is likely. The Stochastic oscillator confirms this scenario, with its signal line below 50 and pointing firmly downwards towards 20.
Conclusion
GBP/USD remains under pressure amid weak domestic data, deteriorating public finances, and political uncertainty, which continue to weigh on sterling. UK retail sales posted their sharpest decline in nearly a year, while the budget deficit rose to its highest post-pandemic level. Labour market conditions are also softening, with rising unemployment and weak wage growth despite accelerating inflation. Although the Middle East conflict continues to support safe-haven demand for the dollar, sterling has shown some resilience by recovering from recent political pressures. However, technical indicators point to further near-term downside towards 1.3393 and potentially 1.3290. The pound's trajectory will likely depend on whether domestic economic concerns intensify or geopolitical developments shift the broader risk environment.
EUR/JPY: Yen Recovers April Losses as the Market Searches for a New Equilibrium
Fundamental backdrop
In late April 2026, Japan’s Ministry of Finance moved from verbal warnings to direct action, carrying out a currency intervention worth roughly ¥5.5 trillion ($35 billion) — the first since July 2024. The move was triggered by the yen weakening beyond the psychologically significant level of 160 against the dollar.
Additional context comes from the divergence in monetary policy between the ECB and the Bank of Japan: the European regulator continues to leave the door open to tighter policy amid rising inflation expectations, while Tokyo maintains a cautious normalisation path without providing clear guidance on the timing of its next move.
Technical picture
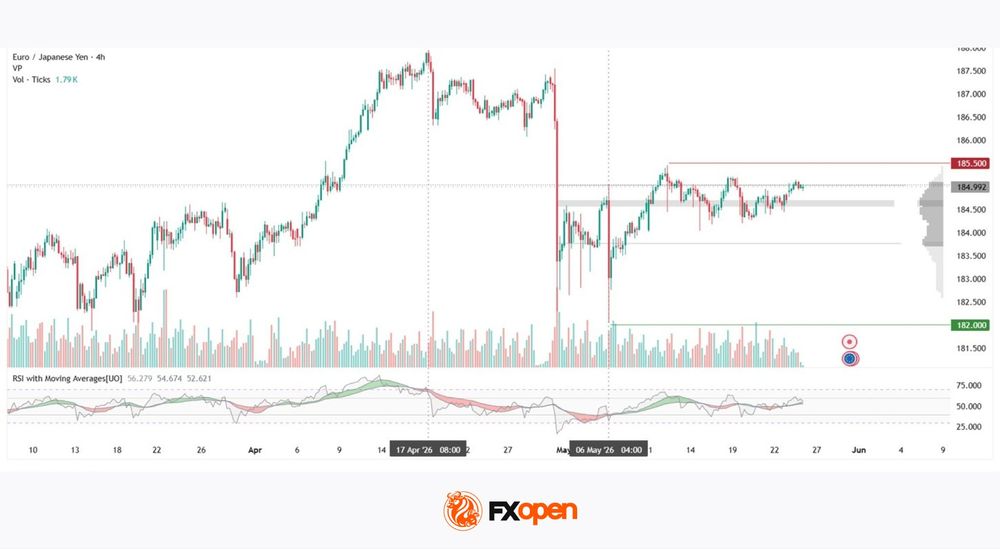
After reaching a local peak near 188 in mid-April, the EUR/JPY pair experienced two impulsive declines. The first occurred on 30 April, when the candlestick recorded an abnormal spike in vertical volume — a direct consequence of the Japanese Ministry of Finance intervention, which saw the yen strengthen by roughly 3% during the session. A second bout of sharp selling pressure followed in early May.
As a result, a horizontal profile formed with boundaries at 183.800–185.000, while the point of control is concentrated within the 184.50–184.70 range.
The price is now testing the upper boundary of the profile — an area where sellers have already shown activity on two separate occasions. The 182 region has held since February and could once again come into focus if pressure resumes: both May sell-offs reversed precisely from this zone, failing to break lower. Meanwhile, the 185.500 area could act as resistance should the current advance continue.
RSI + MA readings stand at 57 / 55 / 53 respectively — all three lines remain in neutral territory, with no clear signs of momentum.
Key takeaways
The current situation is shaped by the clash between interest-rate differentials and the willingness of the Japanese authorities to intervene again if necessary. For now, with RSI offering no directional impulse, the point of control and the profile boundaries remain the key reference levels for assessing the current trading range.
Trade over 50 forex markets 24 hours a day with FXOpen. Take advantage of low commissions, deep liquidity, and spreads from 0.0 pips (additional fees may apply). Open your FXOpen account now or learn more about trading forex with FXOpen.
This article represents the opinion of the Companies operating under the FXOpen brand only. It is not to be construed as an offer, solicitation, or recommendation with respect to products and services provided by the Companies operating under the FXOpen brand, nor is it to be considered financial advice.
Sunrise Market Commentary
Markets
Markets yesterday embraced weekend comments by US president Trump suggesting that the US and Iran were close to completing an agreement. They found more comfort in messages that Iran’s parliamentary speaker and foreign minister were travelling to Qatar yesterday to try to reach a deal which would extend the ceasefire by two months and reopen Hormuz. Brent crude prices dropped from closing levels last week around $104/b to opening levels of $98 on Monday. After that initial move, they stabilized. As we’ve seen more since the start of the war, the US media campaign didn’t resonate through official Iranian comments with the foreign ministry’s spokesperson warning that the signing of an agreement isn’t imminent despite recent progress. There are also new reported US attacks against Iranian missile launch sites and boats this morning which threaten to derail/delay negotiations.
Bond futures opened stronger and managed to add some momentum intraday. We wait to draw firm conclusions as trading was thinned by public holidays in the US (Memorial Day), the UK (Spring Bank Holiday) and several European countries (Whit Monday). US stock markets were closed, but the EuroStoxx50 rallied 2% to its highest level since the start of the war in the Middle East. EUR/USD started with a move from 1.16 to 1.1650 but treaded water afterwards.
Apart from Iran-related headlines, today’s eco calendar is thin with US consumer confidence and a $69bn 2-yr Note auction. Comments by central bankers remain interesting. ECB Schnabel told Reuters this morning that the ECB should hike its policy rate in June even if there’s a peace deal. She believes that looking through the supply shock is no longer an option, arguing that it is already beyond the central bank’s adverse scenario in terms of persistence. Increasing sings of spillovers leave the ECB no other option. She joins calls by colleagues Kazimir, Kocher, Wunsch and Muller who suggested that a June rate hike would be the default option. Over the weekend, ECB President Lagarde also suggested that March inflation projections were likely to be revised upward at the June 11 policy meeting. Later today, ECB Sleijpen is scheduled to speak. From the US Fed, we retain Friday evening’s comments by heavyweight Fed governor Waller. He supports removing the easing bias language in the policy statement to make it clear that a rate cut is no more likely in the future than a rate hike. Inflation is not headed in the right direction and Waller doesn’t want to rule out raising rates if price pressures doesn’t abate soon.
News & Views
Czech economic confidence declined further in May (101.3 to 99.7). Both business confidence (100.4 to 99) and consumer confidence (106 to 103.4) suffered a setback. The former only showed sentiment in the construction sector (+ 2.4 points) improving while decreasing in the industry (-2.6 points), trade (-2.2 points) and selected services (-0.5 points) sectors. Regarding consumer confidence, the proportion of respondents assessing their current financial situation as worse than in the previous twelve months increased, while the share of households expecting an improvement in their financial situation decreased slightly. Still the share of consumers expecting a deterioration in the overall economic situation in Czechia over the next twelve months remained almost unchanged. Separately from the data, Czech Prime Minister Babis called the Czech National Bank to lower its policy rate as he is of the view that there is no reason for Czech citizens to pay a higher interest rate than in the EMU. The CNB in May left its policy rate unchanged at 3.5% and Governor Mich indicated that a moderately restrictive policy is needed. He couldn’t rule out rate hikes if necessary to prevent a rise in (core) inflation.
Polish Finance Minister Domanski yesterday said that there is no political support in Poland to join the euro anytime soon. He assessed having an independent currency as still being beneficial to the Polish economy. The comments probably have to be put in the context of political developments in Hungary where the new government has engaged in a process that should enable the country to meet the requirements for joining the single currency as soon as possible.