Sample Category Title
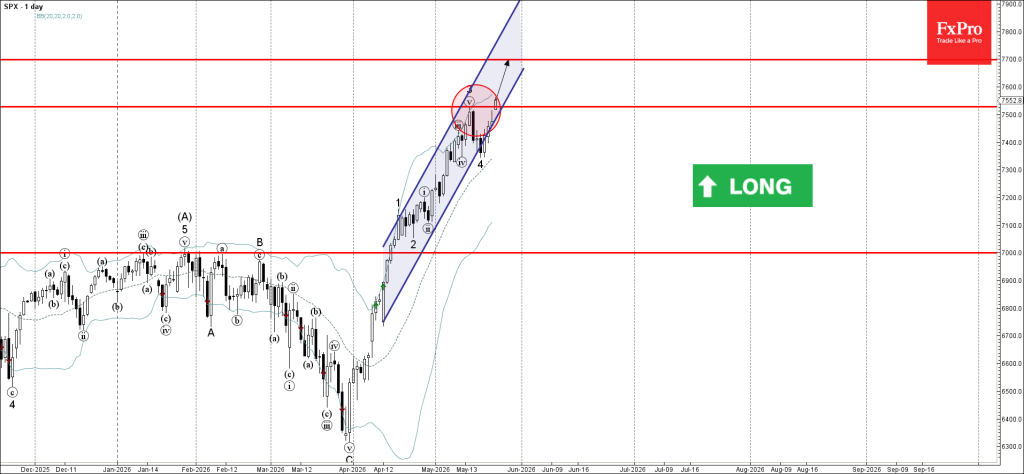
S&P 500 Wave Analysis
S&P 500: ⬆️ Buy
- S&P 500 index broke resistance level 7525.00
- Likely to rise to resistance level 7700.00
S&P 500 index opened today with the upward gap which broke above the earlier resistance level 7525.00 – which stopped the previous minor impulse wave 3.
The breakout of the resistance level 7525.00 should accelerate the active impulse wave 5 of the sharp impulse wave (C) from March.
Given the overriding daily uptrend, S&P 500 index can be expected to rise to the next resistance level 7700.00.
Bitcoin Shy to Move Up, But Refuses to Fall
Market Overview
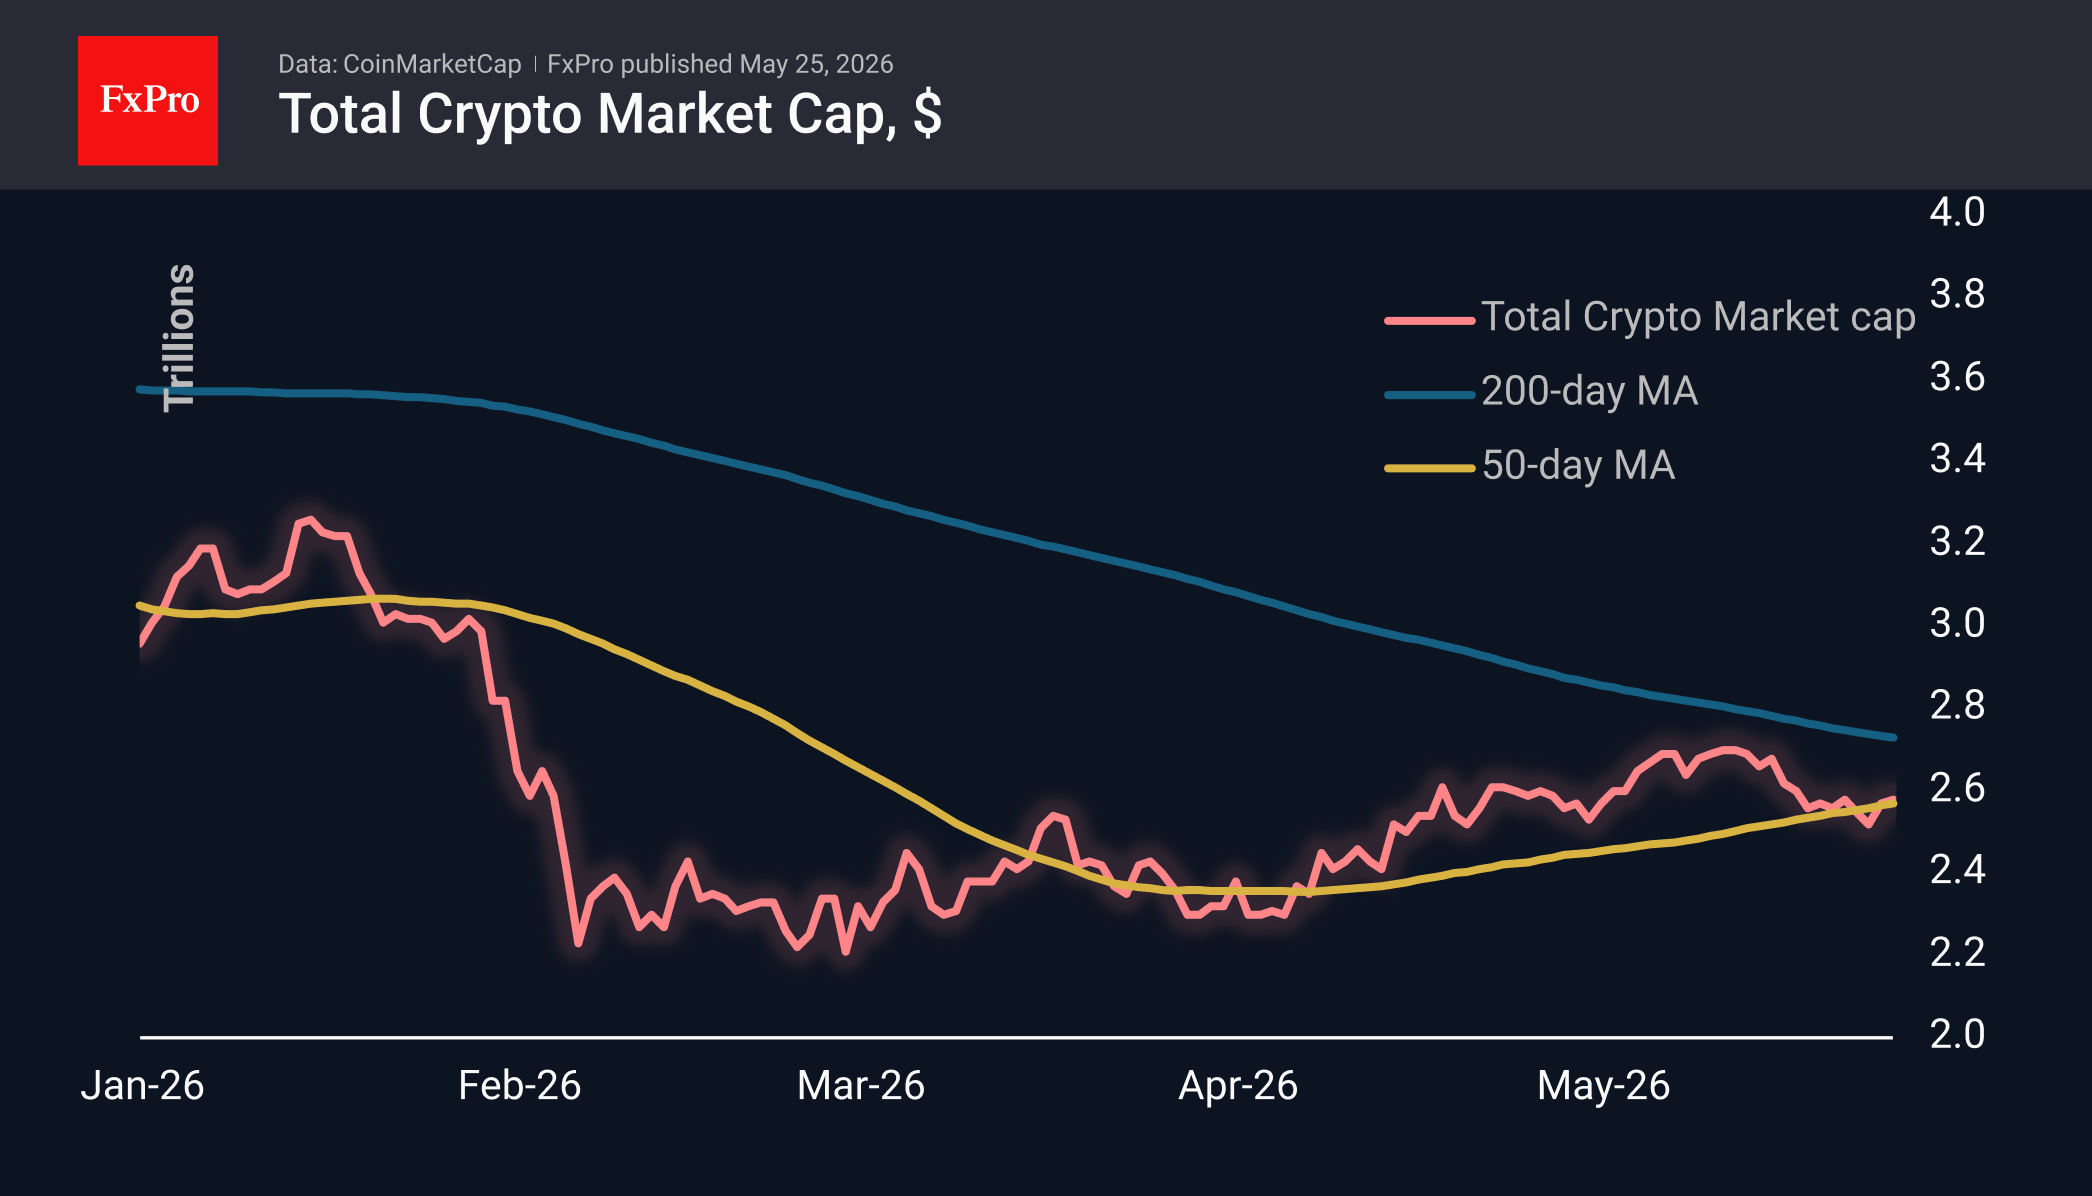
The crypto market continues to fluctuate, returning for the third time this week to market capitalisation levels around $2.57T, although at the end of last week it dipped to $2.5T following an earlier surge to $2.7T in May. Over the past 24 hours, the top-performing coins have been Near Protocol (+7.3%), Internet Computer (+4.1%) and Toncoin (+3.4%). Uniswap has seen the biggest decline, falling by 1.6%, whilst Bitcoin Cash and Litecoin have each lost 1%.
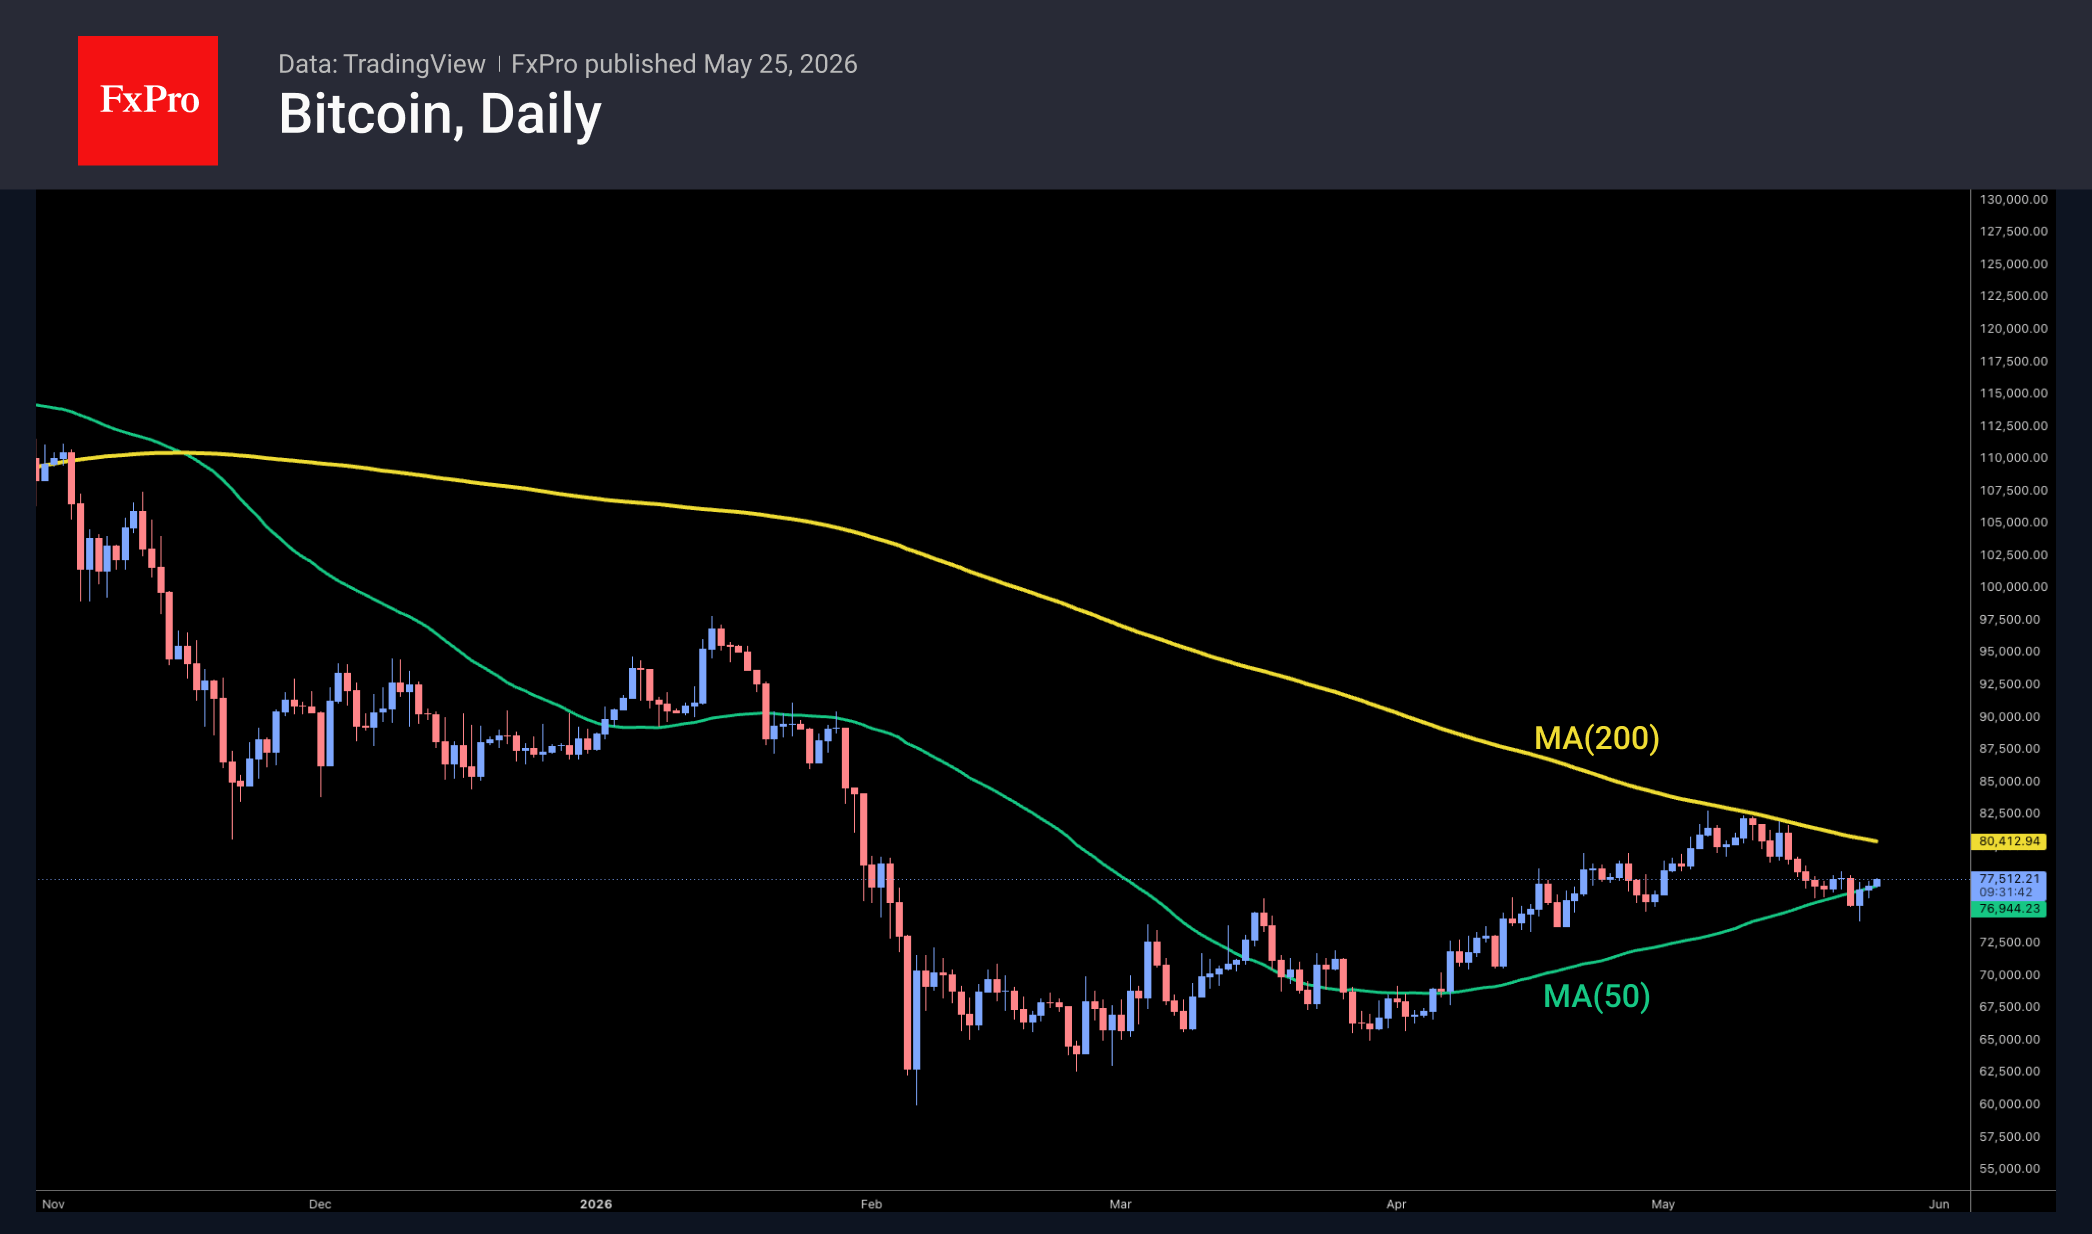
Bitcoin fell to $74.3K on Saturday but was trading just above $77K by Monday. Its price movements remain very subdued, with no sharp spikes, and it continues to lag behind stock indices, which are climbing towards all-time highs. On the other hand, the trend of buying on dips is also clearly continuing. The 50-day moving average remains a support level, but buyers are wary of accelerating their purchases. They are likely somewhat put off by the lack of a ‘final capitulation’ in the leading cryptocurrency, which could have brought the bear market to an end.
News Background
Outflows from US spot Bitcoin ETFs have continued for a second week, following six weeks of inflows. According to SoSoValue, net weekly outflows from spot BTC ETFs rose to $1.26 billion, hitting their highest level since late January. Total inflows since the approval of Bitcoin ETFs in January 2024 have fallen to $57.08 billion (-2.2% for the week).
Outflows from US spot Ethereum ETFs have also persisted for two consecutive weeks. Net weekly outflows from ETH ETFs fell by $216 million. Total net inflows since the ETF’s launch in July 2024 have fallen to $11.62 billion (-1.8% week-on-week).
Weakening retail demand and outflows from crypto ETFs could be a ‘contrarian indicator’ signalling a buy signal for Bitcoin, according to Santiment.
Bitcoin miners remain cautious and are not yet showing confidence that the bear market phase is over, CryptoQuant notes. Miners continue to reduce their reserves of the leading cryptocurrency, as they do not yet see sufficient grounds for active BTC purchases.
The media corporation Trump Media and Technology Group transferred 2,650 bitcoins from the project’s crypto wallet to the Crypto.com exchange. The transaction suggests a desire to sell BTC, Arkham Intelligence speculated. The deal will be a loss-maker, as the average purchase price of the coins exceeded $118K.
Billionaire Mark Cuban has sold 80% of his bitcoin holdings and stated that he has lost faith in bitcoin as a safe-haven asset. According to him, he continues to hold Ethereum, placing more trust in this altcoin than in BTC.
Eco Data 5/26/26
| GMT | Ccy | Events | Act | Cons | Prev | Rev |
|---|---|---|---|---|---|---|
| 13:00 | USD | S&P/Case-Shiller Home Price Indices Y/Y Mar | 0.80% | 1.00% | 0.90% | |
| 13:00 | USD | Housing Price Index M/M Mar | 0.10% | 0.10% | 0.00% | -0.10% |
| 14:00 | USD | Consumer Confidence May | 93.1 | 91.6 | 92.8 | 93.8 |
| 13:00 | USD |
| S&P/Case-Shiller Home Price Indices Y/Y Mar | |
| Actual | 0.80% |
| Consensus | 1.00% |
| Previous | 0.90% |
| 13:00 | USD |
| Housing Price Index M/M Mar | |
| Actual | 0.10% |
| Consensus | 0.10% |
| Previous | 0.00% |
| Revised | -0.10% |
| 14:00 | USD |
| Consumer Confidence May | |
| Actual | 93.1 |
| Consensus | 91.6 |
| Previous | 92.8 |
| Revised | 93.8 |
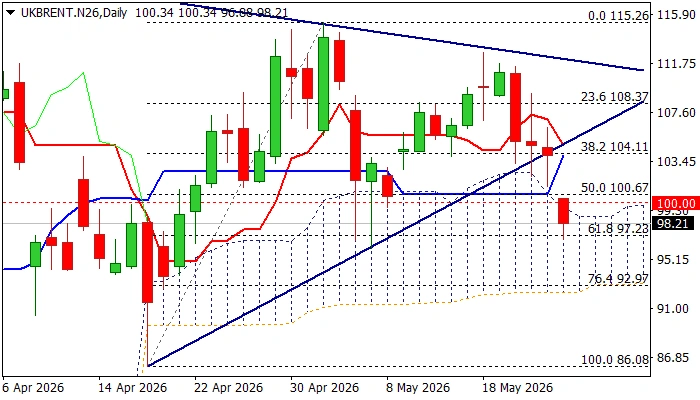
Brent Gaps Lower and Falls Below $100, on Growing Optimism over US-Iran Peace Talks
Brent oil opened with a gap-lower and hit the lowest in more than two weeks on Monday ($96.88), driven by fresh wave of optimism about potential US-Iran peace deal, although key points of negotiations are still to be discussed.
Fresh weakness broke through initial supports, provided by triangle support line / 55DMA ($103.99/$102.73 respectively), dipped below psychological $100 level and penetrated ascending daily cloud (top of the cloud lays at $99.56) also denting Fibo support at $97.23 (61.8% of $86.08/$115.26 upleg).
Technical picture on daily chart weakened as the action continues to gain negative momentum and 10DMA crossed below 20DMA that signals increasing pressure at the downside.
Daily close below $100 (will be the first one in over a month) is needed to confirm negative signal and keep bears for attempts through next pivotal support at $96.09 (May 7 higher low), violation of which to unmask targets at $92.97 (Fibo 76.4%) and $90 (round figure).
Meanwhile, the action may take a breather above cracked $97.23 support and $96.09, due to oversold conditions.
Upticks (in persistent favorable fundamentals) should be limited and mark positioning for fresh push lower, with broken $100 and $100.67 (broken 50% retracement) acting as solid barriers which should ideally cap.
Only stronger bounce that would fill today’s gap and return into triangle, would sideline bears.
Res: 100.00; 100.67; 103.01; 104.64.
Sup: 97.23; 96.09; 94.22; 92.97.
The Dollar Took a Step Back Amid Expectations of aDeal
- Rumours of a U.S.-Iran agreement weighed on the dollar.
- The Fed may resume its rate-cutting cycle.
The US dollar opened the week with a small downward gap and is currently down 0.2% on reports of progress in US-Iran negotiations and a potentially imminent deal. Donald Trump stated that the terms of a deal to resolve the conflict peacefully have largely been agreed upon. However, he then noted that he is in no rush and both sides must get everything right. If the Strait of Hormuz reopens soon, it will radically change the situation in the Forex market.
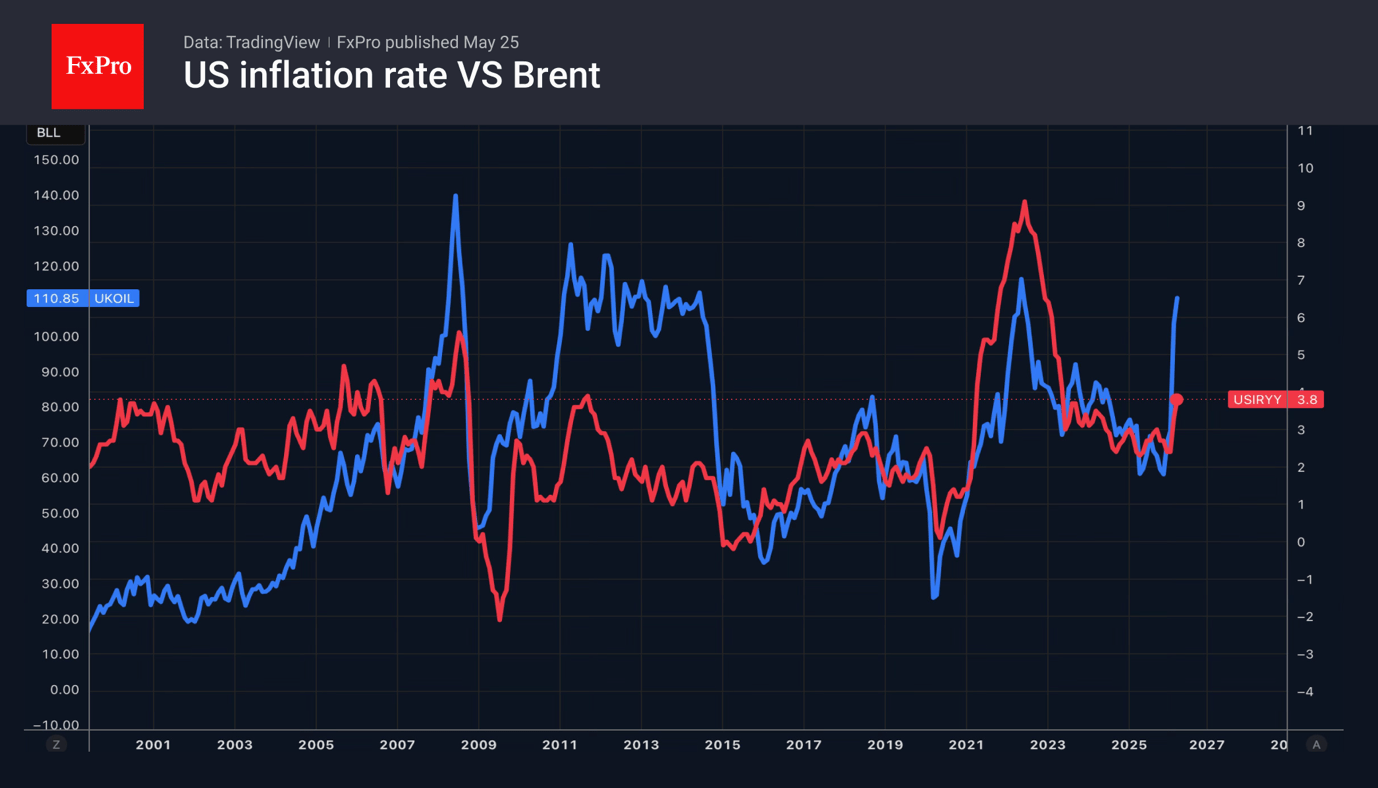
The US dollar has been strengthening for a long time as the likelihood of the Fed tightening monetary policy has increased. As early as the beginning of May, the futures market expected a rate hike in April of next year. Then expectations shifted to March, and then to the end of 2026. At one point, the odds of a monetary tightening cycle starting in December exceeded 60%. If oil prices fall, inflation will follow suit. This should return the Fed to the narrative from the start of the year, when a cut could follow a rate hold.

This is the scenario the White House is banking on. At Kevin Warsh’s swearing-in ceremony, Donald Trump emphasised that the Fed must remain independent. However, he devoted considerable attention to the transitory nature of inflation. The US will combat high prices, but it does not wish to compromise its own greatness. Cutting rates during a strong economy could trigger a real boom in GDP growth.
EURUSD jumped higher on hopes of a peaceful resolution to the conflict in the Middle East. However, previously, everything fell apart when it came to agreeing on the deal terms.
Mediators claim that the memorandum of understanding will extend the ceasefire for at least 60 days. According to them, Iran has demanded the unfreezing of $100 billion of its assets and the lifting of sanctions on oil sales.
An end to the conflict, or even a sharp de-escalation, would provide a tailwind for EURUSD. The eurozone economy has shown signs of a significant slowdown due to rising energy prices. As a result, the futures market has scaled back its expectations regarding the extent of the ECB’s monetary tightening. Earlier, amid rising odds of a federal funds rate hike, speculative net long positions in the dollar rose to their highest level in three weeks. This trend risks reversing
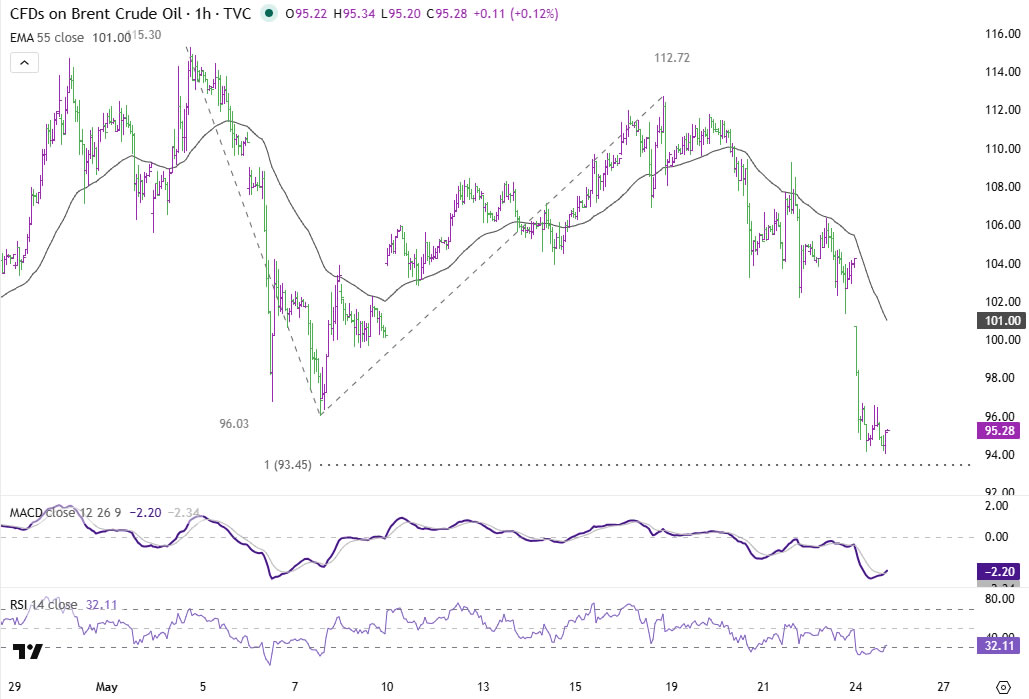
Markets Rally on Iran Deal Hopes as Oil Crashes to $95
Markets began the week trading as if the Strait of Hormuz is already reopening — even though the final agreement has not yet been signed. Investors rushed into a full-scale “peace dividend” trade after reports suggested the US and Iran are edging closer toward a framework agreement that could end the conflict, restore shipping through Hormuz, and dramatically reduce the risk of a prolonged global energy shock.
The reaction across markets was immediate and aggressive. Oil prices collapsed as traders rapidly unwound geopolitical supply premiums. Brent crude plunged more than -4.5%, crashing through the $100 threshold and sliding to $95 a barrel as fears of a catastrophic energy squeeze eased. The collapse in oil immediately fed through into lower inflation expectations, softer global yields, and a powerful risk-on rally across equities.
Asian markets led the celebration. Japan’s Nikkei 225 exploded 2.9% higher, blasting through 65,000 as energy-importing economies emerged as the biggest beneficiaries of the de-escalation trade. European stocks climbed to their highest levels in more than two months as investors priced a world with lower oil prices, reduced inflation pressure, and less need for central banks to keep policy aggressively tight.
The FX market told a similar story, though with more caution underneath the surface. Dollar weakened broadly as safe-haven demand eased, while Canadian Dollar sank alongside oil prices. Yen also underperformed as traders rotated back into risk assets. Aussie led gains, followed by Sterling and Kiwi, as lower energy costs improved the broader global growth outlook.
But beneath the relief rally, skepticism has not disappeared. Precious metals rose modestly only, suggesting investors are still unwilling to fully abandon geopolitical hedges.
And on the diplomatic side, negotiators continue sending mixed signals. US President Donald Trump warned that any agreement would either be “great and meaningful, or there will be no deal at all,” while Marco Rubio said Washington still has “alternatives” if talks fail.
Iran also poured some cold water on the optimism. Foreign ministry spokesperson Esmaeil Baghaei acknowledged that progress had been made on many issues, but stressed that this does not mean “we’re close to signing an agreement.”
In other words, markets are already trading the reopening of Hormuz before negotiators themselves are willing to declare victory.
That tension may define the next stage of the move. If the deal is finalized and oil continues collapsing, markets could push even deeper into the peace-dividend trade. But if negotiations break down at the final stage, the speed of the current repricing suggests volatility could return just as violently in the opposite direction.
Gold and Silver Bounce, but Traders Still Need Proof on Hormuz Normalization
Gold and Silver rebounded as oil prices fell on hopes that a US-Iran deal could eventually reopen the Strait of Hormuz. But traders are still demanding proof that global energy flows will genuinely normalize before aggressively unwinding geopolitical premiums. Read More.
Hawkish RBNZ, Fragile Aussie: Why AUD/NZD Could Break Hard This Week
AUD/NZD is approaching a critical inflection point as traders brace for a potentially hawkish RBNZ decision and Australian inflation data that could undermine expectations for another RBA hike. Technical momentum is already fading near major resistance levels. Read More.
RBNZ Shadow Board Backs Hold at 2.25%, Three Call for Immediate Hike
NZIER’s RBNZ Shadow Board backed holding the OCR at 2.25% this week, but a growing hawkish minority is pushing for immediate tightening as inflation pressures rise. Three members warned that “the real interest rate has remained low for a prolonged period,” while others argued weak growth and geopolitical uncertainty still justify caution. Read More.
GBP/USD Daily Outlook
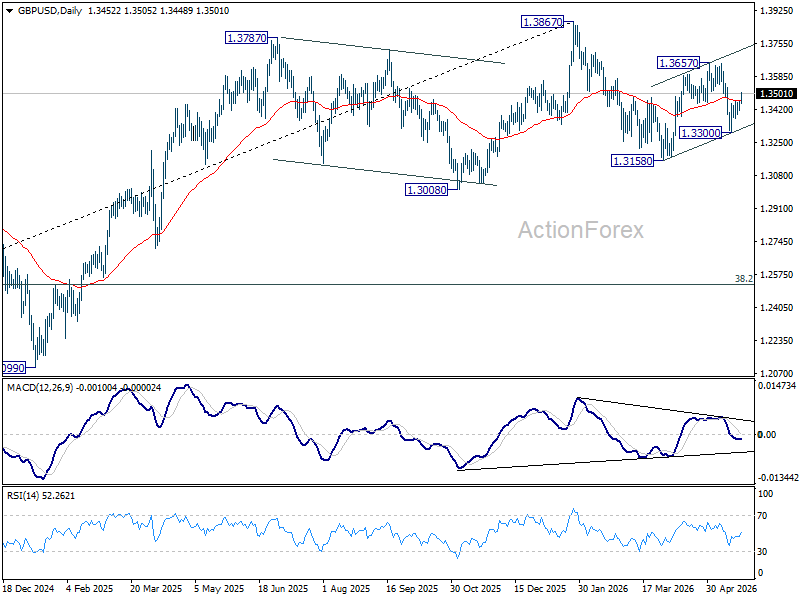
GBP/USD's extended rebound suggests that pullback from 1.3657 has completed at 1.3300. Intraday bias is back on the upside for 1.3657 first. Firm break there will resume the rally from 1.3158. On the downside, below 1.3412 minor support will turn intraday bias neutral again.
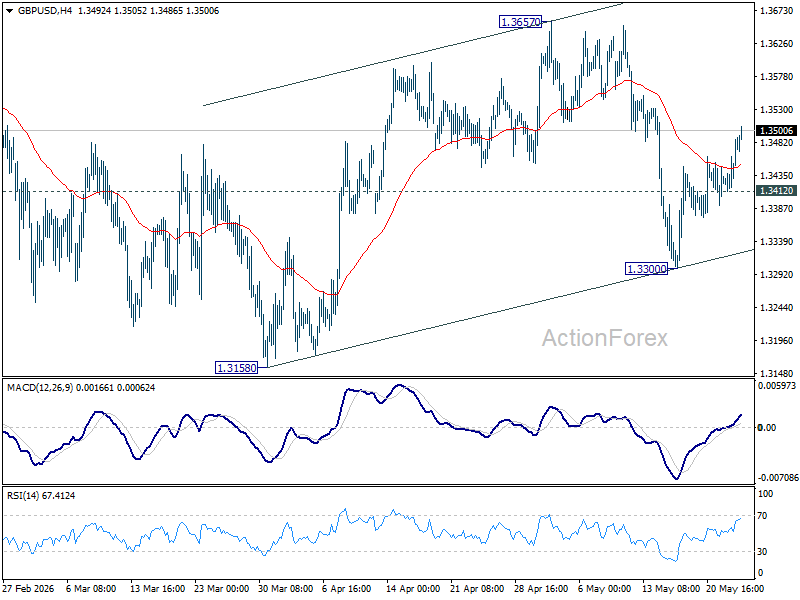
In the bigger picture, current development suggests that price actions from 1.3867 are merely a corrective pattern within the broader up trend from 1.0351 (2022 low). With 1.3008 support intact, medium term bullishness is maintained and break of 1.3867 is in favor for a later stage, towards 1.4248 key resistance (2021 high). However, firm break of 1.3008 will at least bring deeper fall to 38.2% retracement of 1.0351 to 1.3867 at 1.2524, with increased risk of bearish reversal.
EUR/USD Daily Outlook
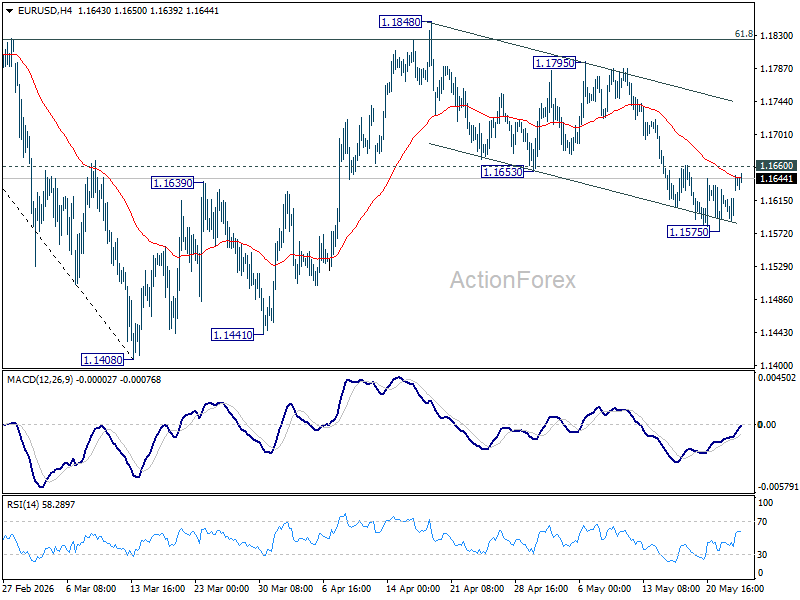
Intraday bias in EUR/USD remains neutral for the moment moment. On the upside, firm break of 1.1660 resistance will argue that fall from 1.1848 has completed as a correction at 1.1575. Intraday bias will be back on the upside for 1.1795 resistance first. On the downside, break of 1.1575 will solidify the case that rebound from 1.1408 has completed at 1.1848, and bring deeper fall back to retest 1.1408 low.
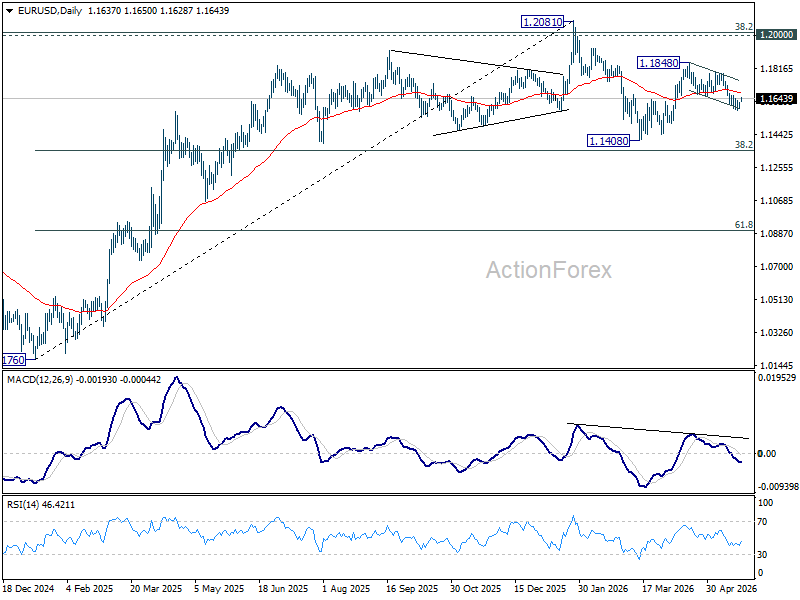
In the bigger picture, the strong support from 38.2% retracement of 1.0176 to 1.2081 at 1.1353 suggests that the pullback from 1.2081 is more likely a corrective move. Strong support was also found in 55 W EMA (now at 1.1544). Focus is back on 1.2 key cluster resistance level. Decisive break there will carry long term bullish implications. Nevertheless, break of 1.1408 support will revive the case of medium term bearish trend reversal.
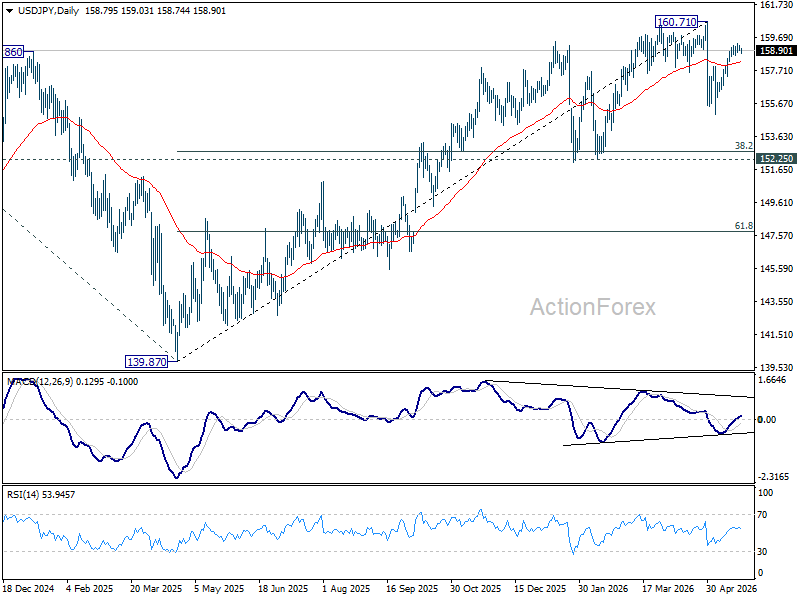
USD/JPY Daily Outlook
Intraday bias in USD/JPY remains neutral and some consolidations could be seen below 159.33 first. Above 159.24 will target 160.71 high. Strong resistance is expected from there to start the third leg of the near term corrective pattern. On the downside, break of 157.30 support will turn bias to the downside for retesting 155.01.
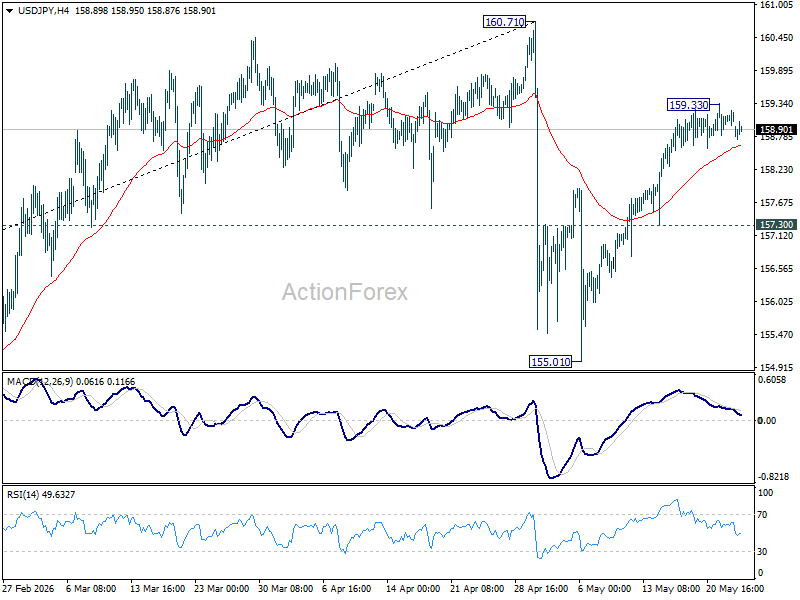
In the bigger picture, for now, corrective pattern from 161.94 (2024 high) is still seen as completed at 139.87. Rise from there is seen as resuming the long term up trend. So, break of 161.94 is expected at a later stage to resume the long term up trend. However, sustained break of 55 W EMA (now at 154.53) will dampen this view and bring deeper fall back towards 139.87 to extend the pattern from 161.94.
GBP/USD Daily Outlook
GBP/USD's extended rebound suggests that pullback from 1.3657 has completed at 1.3300. Intraday bias is back on the upside for 1.3657 first. Firm break there will resume the rally from 1.3158. On the downside, below 1.3412 minor support will turn intraday bias neutral again.
In the bigger picture, current development suggests that price actions from 1.3867 are merely a corrective pattern within the broader up trend from 1.0351 (2022 low). With 1.3008 support intact, medium term bullishness is maintained and break of 1.3867 is in favor for a later stage, towards 1.4248 key resistance (2021 high). However, firm break of 1.3008 will at least bring deeper fall to 38.2% retracement of 1.0351 to 1.3867 at 1.2524, with increased risk of bearish reversal.
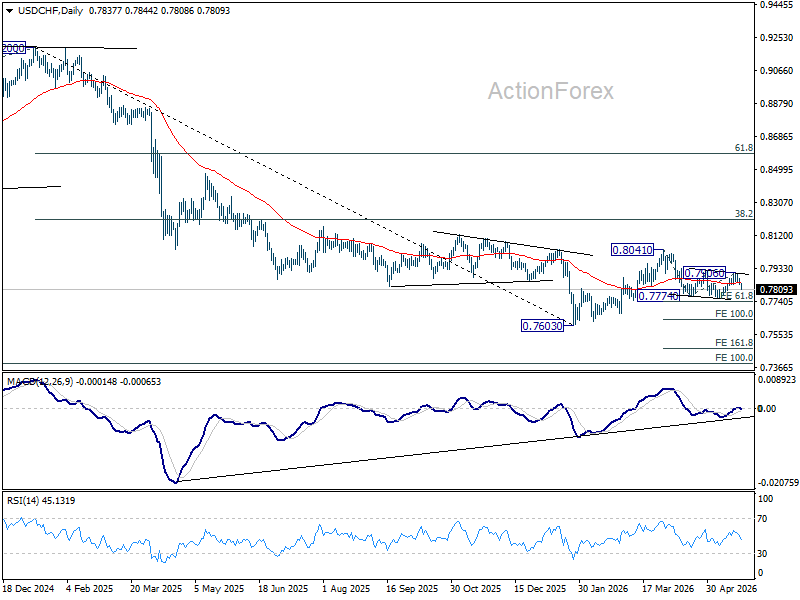
USD/CHF Daily Outlook
USD/CHF's extended decline today suggests that rebound form 0.7760 has completed at 0.7960. Fall from 0.8041 is still in progress. Intraday bias is back on the downside for retesting 0.7760 first. Firm break there will target 61.8% projection of 0.8041 to 0.7774 from 0.7906 at 0.7741. For now, risk will stay on the downside as long as 0.7906 holds, in case of recovery .
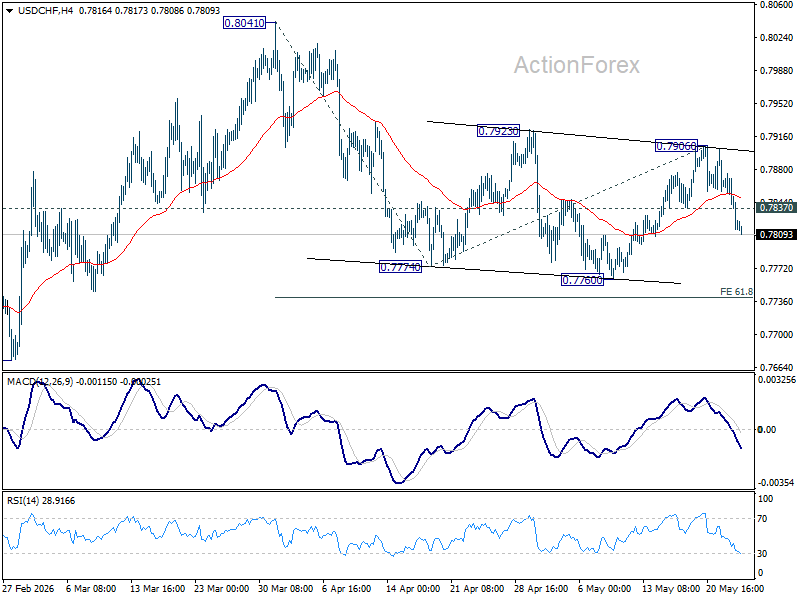
In the bigger picture, as long as 55 W EMA (now at 0.8028) holds, fall from 0.9200 is expected to continue, as part of the larger down trend. Firm break of 0.7603 will target 100% projection of 1.0146 (2022 high) to 0.8332 from 0.9200 at 0.7382.