Sample Category Title
ECB’s Schnabel Says Iran Peace Deal May Already Be Too Late to Avoid June Hike
Even a successful US-Iran peace agreement may no longer be enough to stop the European Central Bank from tightening policy next month. ECB Executive Board member Isabel Schnabel warned today that the energy shock unleashed by the conflict has already gone too far, arguing that inflation pressures are now spreading through the wider Eurozone economy.
“Given the size and the persistence of the current shock, looking through is no longer an option in my view,” Schnabel told Reuters. She added bluntly: “From today’s perspective, I think a rate hike in June will be needed.” Most importantly for markets, Schnabel said the ECB may already have passed the point where falling oil prices alone can reverse the inflation problem. “Even if the war ended today, a lot of damage has already been done to energy infrastructure and global supply chains,” she said.
Schnabel warned that “we are seeing increasing signs that the shock is spilling over to other parts of the consumption basket,” pointing to PMI surveys, consumer expectations data, and sentiment indicators as evidence that second-round effects may already be materializing.
At the same time, Schnabel acknowledged that the Eurozone economy itself is weakening. She warned that the hit to growth “will also be stronger,” while confidence indicators continue deteriorating.
That leaves the ECB facing an increasingly uncomfortable stagflationary setup: slowing growth alongside inflation that remains too high and potentially more persistent than policymakers initially expected.
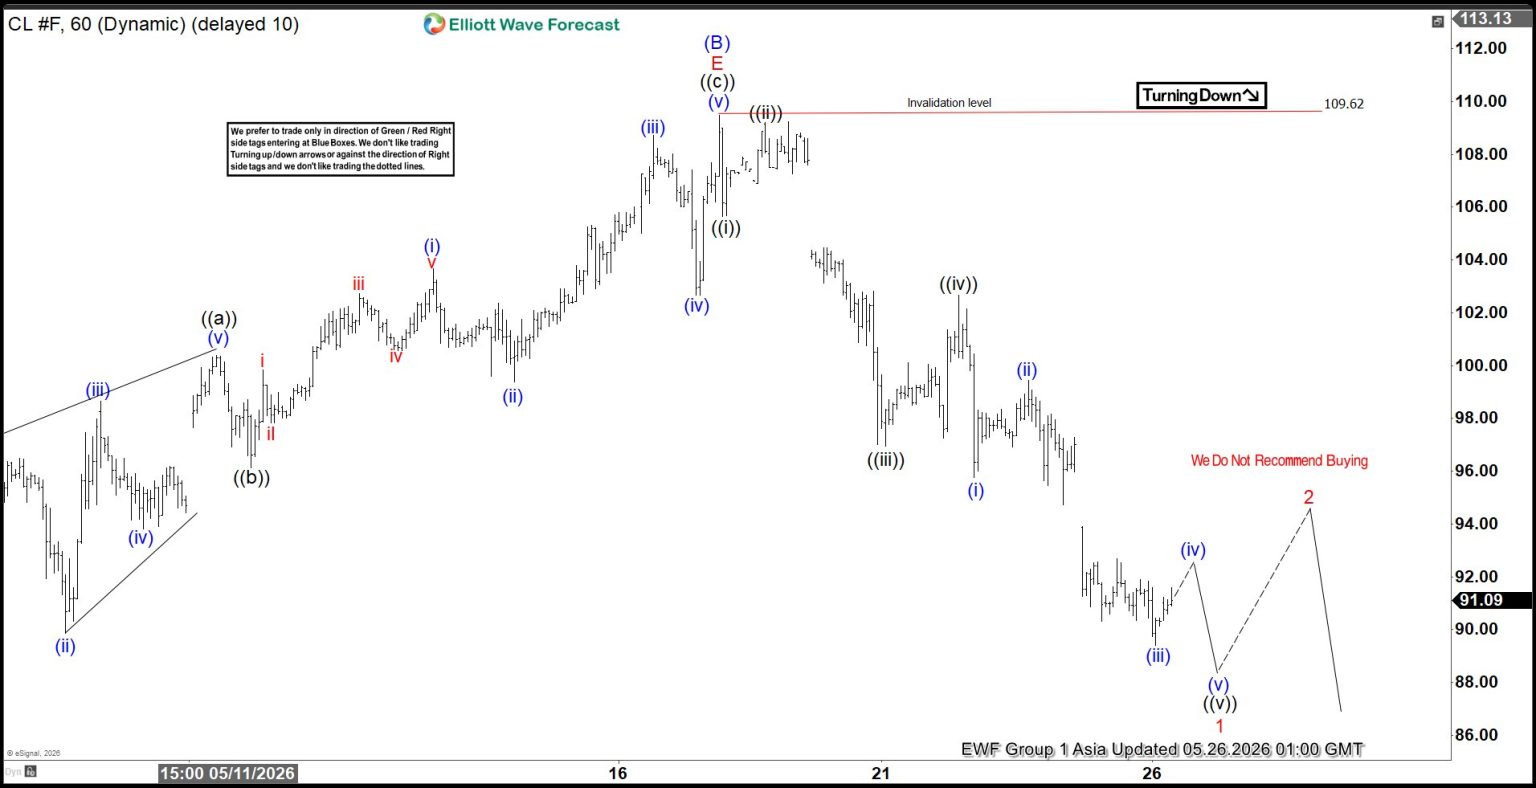
Oil ($CL_F) Impulsive Wave Structure Suggests Further Losses
The short‑term Elliott Wave view on Oil indicates that after spiking to $119.48 in response to the war with Iran, prices have moved sideways for several months. The initial decline from that peak to $76.73 on March 11, 2026 appeared impulsive and likely completed wave (A). Following that move, Oil consolidated in a triangle‑like structure until recently. Within this formation, wave (B) was identified at $109.62, as illustrated in the one‑hour chart.
From that level, Oil resumed lower in wave (C). However, a decisive break below the $76.73 low of wave (A) remains necessary to confirm this bearish view. Down from $109.62, wave ((i)) ended at $105.65, while the corrective rally in wave ((ii)) concluded at $109.2. Oil then extended lower in wave ((iii)) towards $96.94, followed by a bounce in wave ((iv)) that ended at $102.66. The market is now expected to push to a few more lows to complete wave ((v)), thereby finishing wave 1 of a higher degree.
Once wave 1 concludes, Oil should rally in wave 2 to correct the cycle from the May 19, 2026 high. This correction is anticipated to unfold in 3 or 7 swings before the broader downtrend resumes. As long as the pivot at $109.62 remains intact, rallies are expected to fail in 3, 7, or 11 swings, favoring further downside. The structure highlights a mature bearish cycle, with near‑term risks skewed toward continuation of weakness rather than sustained recovery.
Light Crude Oil (CL_F) 60-Minute Elliott Wave Chart
CL_F Elliott Wave Video:
https://www.youtube.com/watch?v=sRGW2RPhzjM
US Strikes Iran amid Potential Deal
In focus today
Today in Sweden, April PPI figures are released. Together with the NIER survey on Thursday, the print will be a key input in the Riksbank's assessment of whether firms have started to feel the impact of rising global price pressures. Recent months' have seen an uptick in the PPIs globally, as well as in Sweden, and we expect these tendencies to continue in today's print.
Additionally, the Riksdag Committee on Finance holds its annual open hearing with the full Riksbank executive board to evaluate the previous year's monetary policy, live streamed on the Riksdag website (in Swedish only).
In Hungary, the Central Bank of Hungary is expected to keep rates steady at 6.25% today.
Overnight, we receive New Zealand's cash rate decision, where we and markets expect them to stay on hold at 2.25%.
For the remainder of the week, the calendar is relatively light on the first days, with activity picking up towards the end of the week. On Thursday, the key releases are Norway's Q1 2026 GDP, the ECB minutes from the March meeting and the US PCE reading for April, followed on Friday by May flash inflation figures from Spain, Italy, Germany and France.
Economic and market news
What happened overnight
In the US-Iran war, the US conducted strikes on Iranian missile launch sites and mine-laying boats in southern Iran overnight, with Centcom citing self-defence. The attacks once again put the fragile ceasefire from April under pressure. This follows a weekend in which President Trump signalled the two sides were close to a deal, posting that talks were "proceeding nicely". The strikes have pushed Brent crude up to 98.1 USD/bbl, although this remains well below Friday's close of 103.5.
What happened over the weekend
In the US, Kevin Warsh was sworn in as new Fed chair on Friday, stepping into the four-year role and officially replacing Powell. Separately, Fed Governor Waller made a significant shift on the rates outlook in his first public remarks since April, arguing the Fed should drop its "easing bias" and open the door to a possible rate hike. Notably, Waller's views have often better reflected the consensus within the Fed than known hawks like Hammack and Logan, who have also advocated for removing the easing bias. US yields ticked higher on the remarks, and markets are now pricing in a full hike by December, in line with our Fed call.
Hopes of a US-Iran agreement grew over the weekend after President Trump stated that the "final aspects and details" were being discussed, with the proposed framework unfolding in three stages, according to Reuters: formally ending the war, reopening the Strait of Hormuz and opening an extendable 30-day window for broader negotiations on nuclear issues and sanctions relief. Efforts to finalise details continued into Monday, with Iran's foreign minister Araghchi travelling to Doha for talks with Qatar's prime minister. However, Secretary of State Rubio tempered expectations early on Tuesday, saying a deal could "take a few days", and warned that the Strait of Hormuz would be opened "one way or the other" following overnight US strikes on Iranian mine-laying boats and missile launch sites.
In the euro area, the ECB's negotiated wage indicator for Q1 2026 came in slightly below expectations, falling to 2.5% y/y from 2.9% y/y in Q4 2025. The indicator clearly shows that wage pressures are easing in the euro area economy, a finding supported by the ECB's separate wage tracker, which points to a continued easing in wage growth based on actual contracts for 2026. This should keep a disinflationary pressure on services inflation, partly countering higher transport services costs from the energy shock. We believe this supports a more muted reaction by the ECB than is currently priced by markets.
In Germany, the Ifo indicator for May improved slightly more than expected, following the large decline in April, offering a modestly more positive picture than Thursday's PMI suggested. Yet, the indicator remains well below pre-war levels. Business expectations have taken a large hit following the Iran war, while the assessment of the current business situation is only marginally down, likely as companies work through order backlogs which keeps activity up temporarily.
Equities were higher on Monday in thin trading, as US and many other markets were closed for holiday. European equities closed a full 1.1% higher. It was a risk-on session in every angle; cyclicals beat defensives. Small caps beat large caps. Growth beat value. Peace talks and oil prices were some of the catalysts. However, it those were not the only factors driving equities higher. It is also the reversal in long end yields that begun already last week. US futures indicate an opening around 0.7% and Asia is generally higher. Kospi is the standout, with SK Hynix and Samsung rebounding 7% and 3%, respectively following last week's brief pause to the semi trade.
FI and FX: US conducted strikes on Iranian vessels in the Strait of Hormuz and on launch sites in Iran overnight. The strikes are said to be defensive in nature, according to a US spokesperson, and the market seemingly agrees with Brent oil trading around USD 98/bbl, the same level at which it traded most of yesterday after the initial drop. US yields are trading lower overnight, catching up with the European moves yesterday. EUR/USD has stabilized around 1.1640, despite the sense of optimism in energy market. The SEK was supported yesterday by the positive risk sentiment, with EUR/SEK moving toward the 10.80 level, but over the past months the SEK gains in risk-on has been more contained than the losses in risk-off.
Trump-Iran Peace Optimism Sparks Equity Rally as Sticky U.S. Inflation Risks Loom Large
Key Takeaways
- Global equity markets rallied as optimism over a potential U.S.-Iran peace agreement boosted risk appetite, driving a sharp pullback in oil prices and renewed buying in Asian and U.S. equities.
- Despite improving geopolitical sentiment, financial markets continue to price in a “higher for longer” interest-rate environment as sticky U.S. inflation and elevated bond yields reinforce expectations that the Federal Reserve may still tighten policy later this year.
- Asia Pacific markets were led by Japan’s strong equity surge and Singapore’s stronger-than-expected Q1 GDP growth. At the same time, policymakers across the region remain highly sensitive to ongoing energy supply disruptions tied to the Strait of Hormuz blockade.
- Chart of the day: Hang Seng Index’s potential short-term rebound remains in focus above the 25,267 key short-term support, with 25,850 acting as the upside trigger level.
Top Macro Headlines
- Imminent U.S.-Iran peace deal speculation sparks market turnaround: Global risk appetite surged following a wave of optimistic messaging from U.S. President Donald Trump and Secretary of State Marco Rubio, suggesting that an imminent peace deal between the United States and Iran may be approaching. The sudden diplomatic optimism triggered a swift reversal in stagflation fears.
- Iran downplays imminent pact, citing Hormuz specifics: Countering the initial wave of Washington optimism, Tehran issued a cautious statement clarifying that a possible memorandum of understanding does not yet contain critical specifics regarding the Strait of Hormuz, warning market participants that a comprehensive deal is not immediate.
- Japan eased market concerns over government finances: Japanese Prime Minister Takaichi said the government will finance its extra budget without increasing bond issuance on a calendar basis. The supplementary budget will total just over 3 trillion yen and may be submitted to parliament as early as next week, with energy subsidies expected to play a key role.
- Bank of Japan Deputy Governor Himino reaffirmed the BoJ’s rate hike path: Himino highlighted the central bank’s commitment to raising interest rates while warning that the timing of future hikes will depend on Middle East developments affecting Japan’s growth and inflation outlook.
Key Macro Themes
- Geopolitical “whiplash” and energy fragility: Cross-asset markets remain caught in a tug-of-war between speculative peace breakthroughs and physical supply realities. While optimistic traders are driving short-covering rallies, independent energy researchers warn that global oil inventories may reach critical levels by June, potentially sending crude prices above $150/barrel if the Hormuz blockade is not structurally resolved.
- The repricing of “higher for longer” into active tightening: Before the escalation of the Iran conflict, macro participants expected two to three Fed rate cuts in 2026. Following persistent inflation pressures, including headline CPI at 3.8% and core PCE expected at 3.3%, Fed funds futures have erased easing expectations and shifted toward pricing a possible Fed rate hike by December 2026.
- The trillion-dollar primary market liquidity drain: The combination of SpaceX’s massive $75 billion capital raise and a confidential draft IPO filing from OpenAI signals a structural shift in equity markets. This tech-driven listing boom may become a major test of public liquidity and investor risk appetite.
Global Market Impact (Last 24 Hours)
Equities: U.S. stock index futures pointed higher, buoyed by optimism surrounding the Trump-Iran memorandum. This followed a quiet Memorial Day closure in the U.S. and UK, where equity sentiment remained constructive despite persistent concerns over bond yields.
Fixed Income: Developed bond markets continue to face multi-speed pressures despite softer oil prices tied to the prospect of a U.S.-Iran peace deal. U.S. Treasuries remain deeply unanchored, with long-dated yields hovering near 2007 highs as the 30-year yield continues to hold near the 5% psychological level.
FX: The U.S. Dollar Index (DXY) weakened marginally as capital rotated out of safe-haven cash positions and back into risk-sensitive currencies, providing temporary relief for G10 and emerging market FX. AUD rose 0.7%, GBP gained 0.6%, and EUR advanced 0.4% against the USD on Monday, 25 May.
Commodities: Crude oil plunged sharply, with Brent briefly slipping below the critical $100/barrel threshold to hit a fresh two-week low as geopolitical war premium faded. Meanwhile, spot gold rebounded 1.3% as a softer U.S. dollar triggered a technical bounce, closing Monday at $4,570/oz while remaining below the 20-day moving average resistance at $4,602/oz.
Asia Pacific Impact
- Japanese equities explode to all-time highs: Tokyo led global markets with a major breakout, as the Nikkei surged 3% to a record high on expectations of a rapid resolution to the Middle East supply crisis. In today’s Asia session, some profit-taking emerged, with the Nikkei 225 slipping 0.4%, while other regional indices traded positively, including the Hang Seng Index (+0.2%), China A50 (+0.2%), and KOSPI (+3.4%).
- Singapore Q1 GDP blows past estimates: Supported by the regional AI infrastructure boom, Singapore posted Q1 GDP growth of 6.0% y/y, comfortably beating expectations. However, policymakers continue to face mixed prospects tied to ongoing Middle East maritime disruptions.
- Regional currency stabilization: Alongside the softer U.S. dollar, broader Asia FX markets strengthened, easing immediate balance-of-payments and capital flight concerns for energy-importing economies.
Top 4 Events to Watch Today
- Japan Leading Economic Index Final (March) – 1:00 pm SGT
Impact: USD/JPY, JPY crosses, Nikkei 225 - Singapore Industrial Production (April) – 1:00 pm SGT
Consensus: 12% y/y, previous: 10.1%
Impact: USD/SGD, SGD crosses, STI - US Conference Board Consumer Confidence (May) – 10:00 pm SGT
Impact: USD, U.S. stock indices - US-Iran peace deal news flow
Impact: All asset classes
Chart of the Day – Short-Term Rebound in Hang Seng Index Above April Gap Support
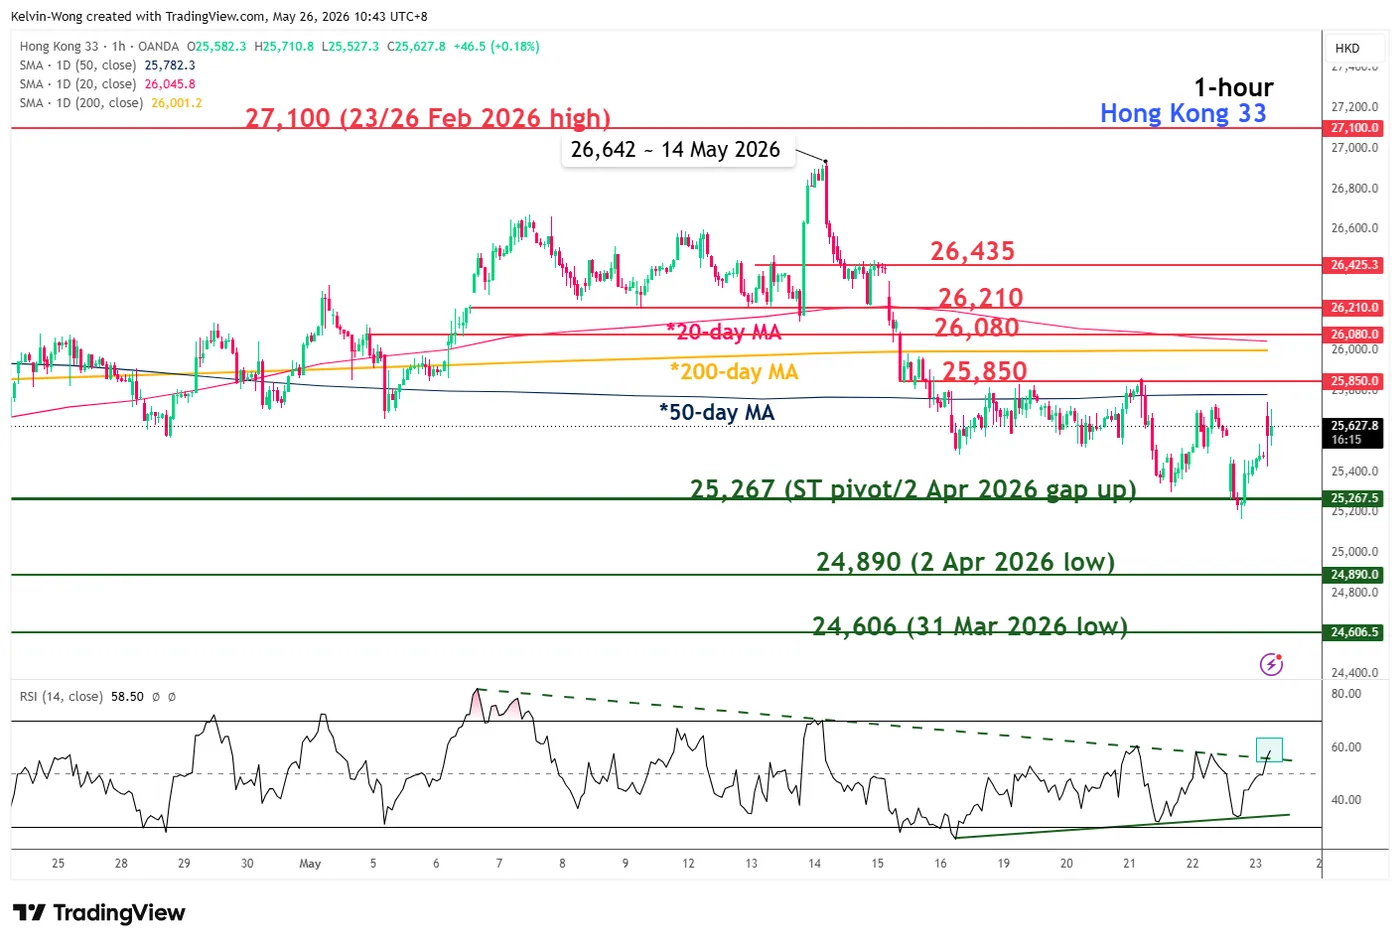
Fig. 1: Hong Kong 33 CFD minor trend as of 26 May 2026 (Source: TradingView).
The recent 6.6% decline in the Hong Kong 33 CFD, a proxy for Hang Seng Index futures, from its intraday high of 26,642 has found support at the early April 2026 gap support level of 25,267.
In addition, the hourly RSI momentum indicator continues to display short-term bullish momentum conditions following a prior bullish divergence signal that emerged in oversold territory on 22 May 2026.
Watch the 25,267 key short-term pivotal support for a potential rebound. A break above 25,850, acting as the upside trigger, could expose the next intermediate resistances at 26,080 and 26,210.
On the other hand, an hourly close below 25,267 would invalidate the bullish scenario and expose the next intermediate supports at 24,890 and 24,606.
GBP/USD Recovery Trend Strengthens, Traders Eye More Upside
Key Highlights
- GBP/USD started a recovery wave above the 1.3400 resistance.
- A rising channel is forming with support at 1.3440 on the 4-hour chart.
- EUR/USD is struggling to clear the 1.1675 resistance zone.
- WTI crude oil prices dipped below the $96.50 support.
GBP/USD Technical Analysis
The British Pound found support near 1.3300 against the US Dollar. GBP/USD formed a base and started a steady increase above the 1.3380 resistance.
Looking at the 4-hour chart, the pair traded above the 50% Fib retracement level of the downward move from the 1.3653 swing high to the 1.3302 low. There is also a rising channel forming with support at 1.3440.
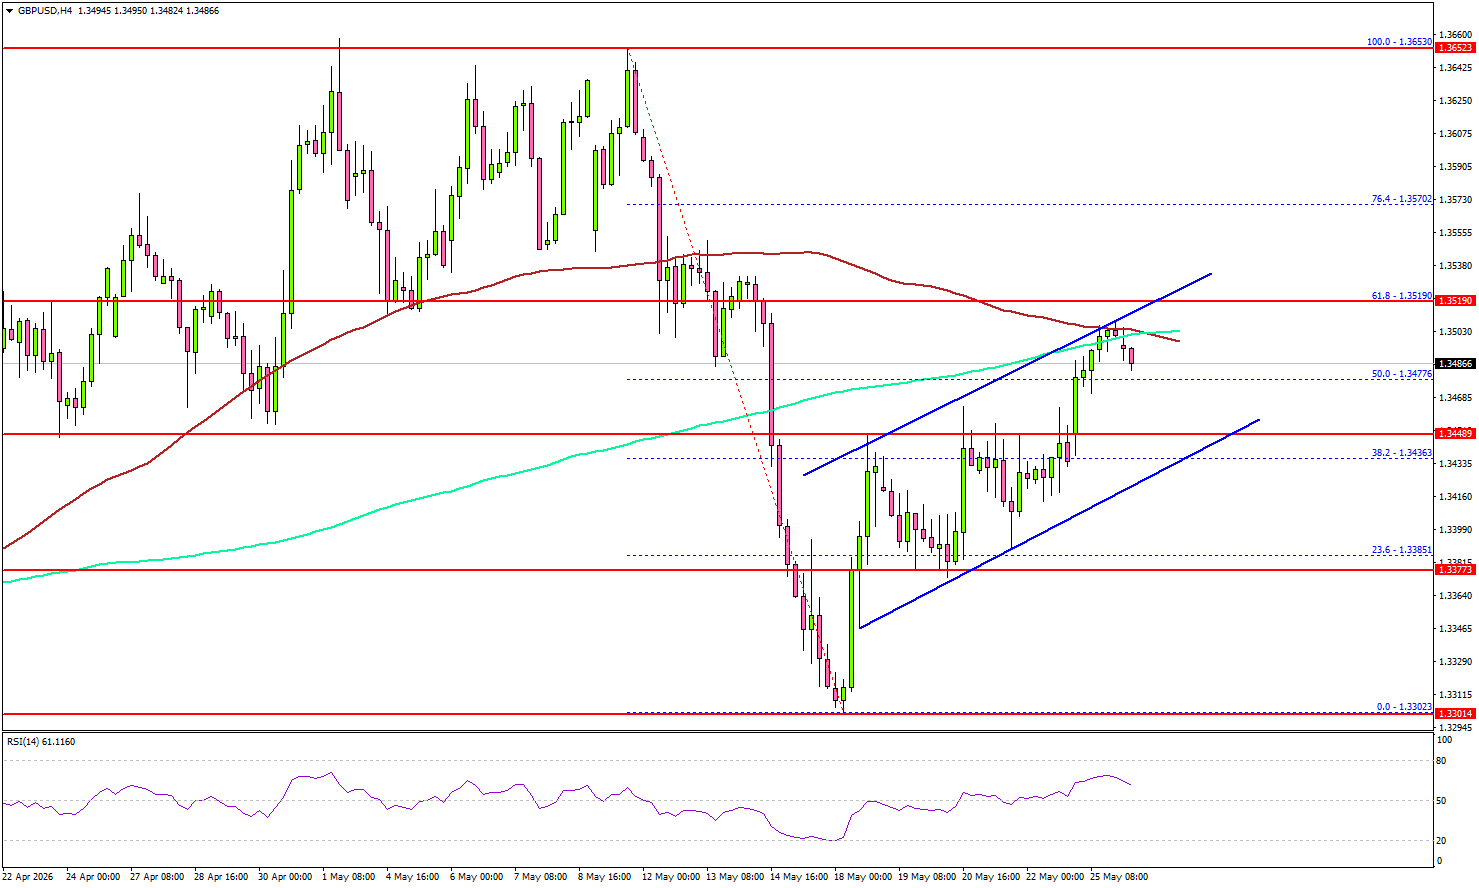
However, the pair is now facing hurdles near 1.3500, the 100 simple moving average (red, 4-hour), and the 200 simple moving average (green, 4-hour).
The next major resistance could be 1.3520 and the 61.8% Fib retracement level of the downward move from the 1.3653 swing high to the 1.3302 low. A close above 1.3520 could open doors for gains above 1.3550. In the stated case, the bulls could aim for a move to 1.3600.
If there is another decline, the pair could find bids near 1.3440. The first major support sits near the 1.3420 level. The next support could be 1.3400. A close below 1.3400 might initiate a drop to 1.3350. Any more losses might open the doors for a drop toward the 1.3300 zone.
Looking at EUR/USD, the pair is attempting to recover some losses but the bears are active below the 1.1675 resistance.
Upcoming Key Economic Events:
- US Housing Price Index for March 2026 (MoM) - Forecast +0.1%, versus 0% previous.
Euro Fights “Two-Front War” Against Sterling and Swiss Franc
At first glance, Euro looks healthy this week. Dollar is falling, oil prices are collapsing, and risk appetite is roaring back as markets price the possibility of a US-Iran breakthrough and reopening of the Strait of Hormuz. But underneath the broad Dollar selloff, Euro is quietly losing two very important battles — one against Sterling, and another against Swiss Franc.
The fight against Sterling is fundamentally about growth credibility. Europe’s slowdown is looking uglier than Britain’s. Eurozone PMI Composite crashed to 47.5 in May, the weakest level in 31 months, with Services collapsing to 46.4 and Manufacturing momentum fading rapidly. The UK was weak too, with Composite slipping to 48.5, but the details matter enormously. British Manufacturing held at 53.7, the strongest reading in four years, while factory output improved to 52.4. In other words, Britain still looks like an economy slowing into a soft landing. The Eurozone increasingly looks like one drifting toward stagnation with inflation problems still unresolved.
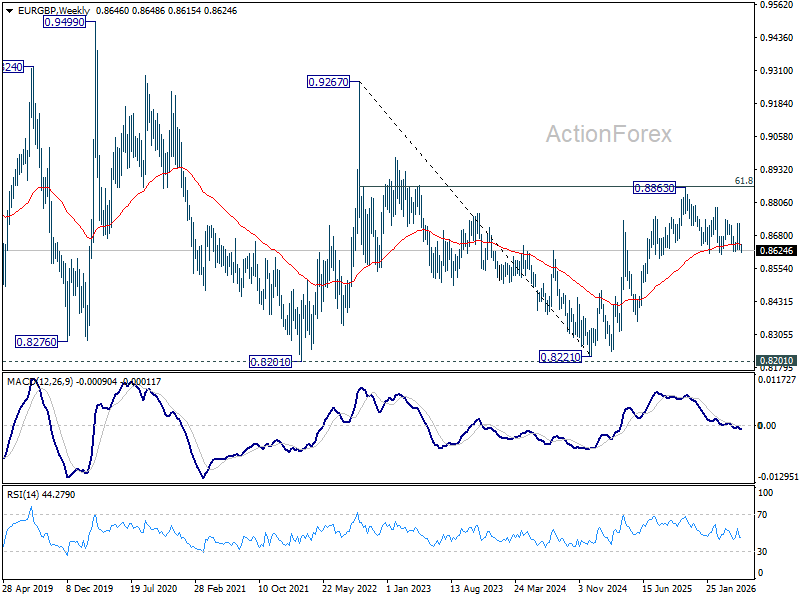
Markets are beginning to reflect that divergence more aggressively in EUR/GBP. The cross is now back pressing the critical 0.8618 Fibonacci support zone, 38.2% retracement of 0.8821 (2024 low) to 0.8863 (2025 high).
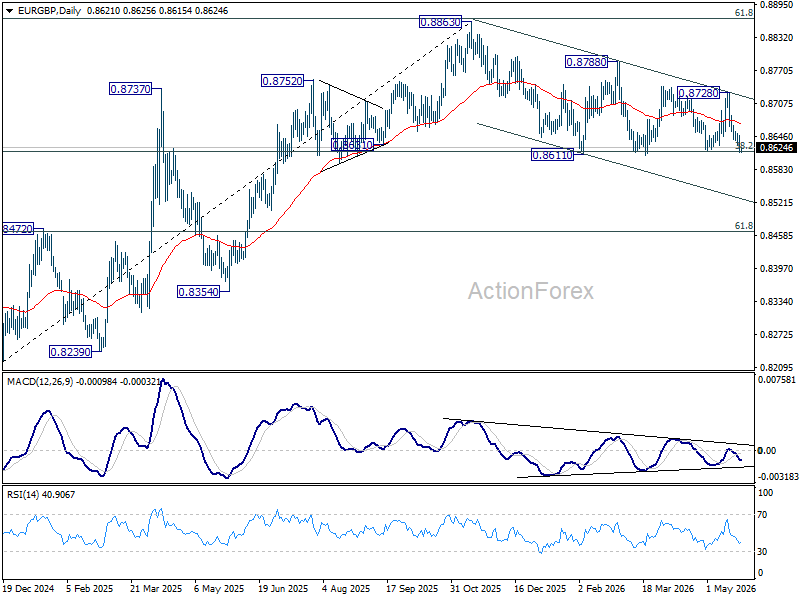
A decisive break there would also push the cross firmly below 55 W EMA {now at 0.8649). That would strengthen the case that the entire rise from 0.8821 already topped at 0.8863 after rejection near the major 61.8% retracement of 0.9267 (2022 high) to 0.8821 at 0.8867. In that scenario, deeper losses toward 61.8% retracement of 0.8821 to 0.8863 at 0.8466 should follow.
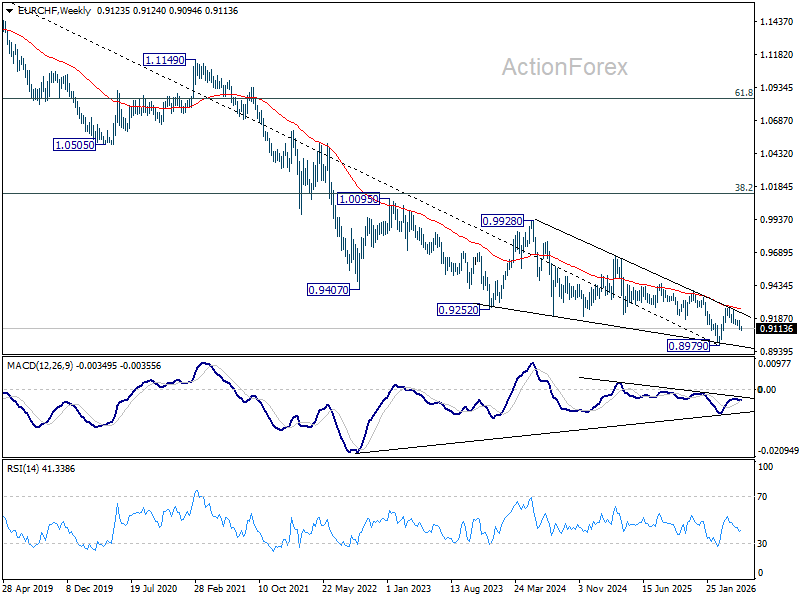
The battle against Swiss Franc is completely different. Here, the problem is not growth — it is yields and oil. As markets increasingly price a de-escalation in the Middle East, oil prices are falling sharply and global bond yields are retreating. Ironically, the same “peace dividend” helping global equities is also strengthening CHF because lower yields reduce the carry advantage that had supported EUR/CHF.
Technically, EUR/CHF’s rejection at 55 D EMA (now at 0.9164) reinforces the near term bearish outlook. The rebound from 0.8979 should be complete at 0.9264, while the broader downtrend remains intact below the falling 55 W EMA and medium-term trendline resistance.
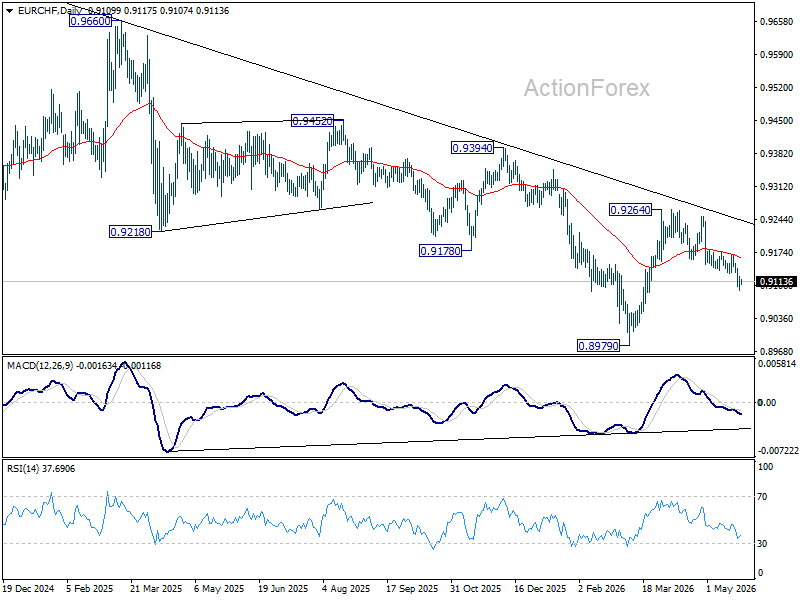
Retest of 0.8979 is likely next, and a firm break there would resume the broader decline from 0.9928, extending the long-term downtrend that began from the 2018 high at 1.2004.
BoJ’s Himino Keeps Hawkish Tone but Signals Caution on Middle East Shock
Bank of Japan Deputy Governor Shinichi Himino delivered another reminder today that the central bank is still moving toward tighter policy, even as the Middle East crisis complicates the outlook for inflation, bond markets, and Japan’s economy. Himino acknowledged that global bond yields are rising because of “global concerns about inflation,” but stressed the BoJ will continue adjusting policy to achieve its inflation target “stably, sustainably.”
The most important signal for markets was that the BoJ has not abandoned its tightening bias despite the recent geopolitical turmoil. Himino said the central bank “will continue to raise policy rate” and adjust monetary accommodation according to economic and price conditions. However, he also made clear that policymakers are becoming increasingly sensitive to how oil prices and regional instability could affect Japan’s fragile recovery.
That caution was especially visible in his comments on future tightening pace and bond tapering plans. Himino said the BoJ would “consider timing and pace of adjustment while monitoring how Middle East developments affect Japan economy.” He also emphasized that policymakers are carefully reviewing bond market functionality while listening to market participants.
The Memorial Day Session Brought Some Great News
The Memorial Day session delivered a lot of positive news, creating a strong bullish outlook for the coming trading week.
The recent US-Iran draft agreement gave the broader market a major boost, and institutional investors are now expecting a formal deal to be reached during this final ceasefire extension.
A key outcome from these diplomatic talks is the growing expectation that the Strait of Hormuz will reopen within 30 days. This breakthrough triggered a sharp correction in energy markets, with WTI Crude Oil dropping 7% during the holiday session.
The US Dollar also fell alongside crude, as the war-related inflation premium and safe-haven demand quickly faded from the broader economic picture.
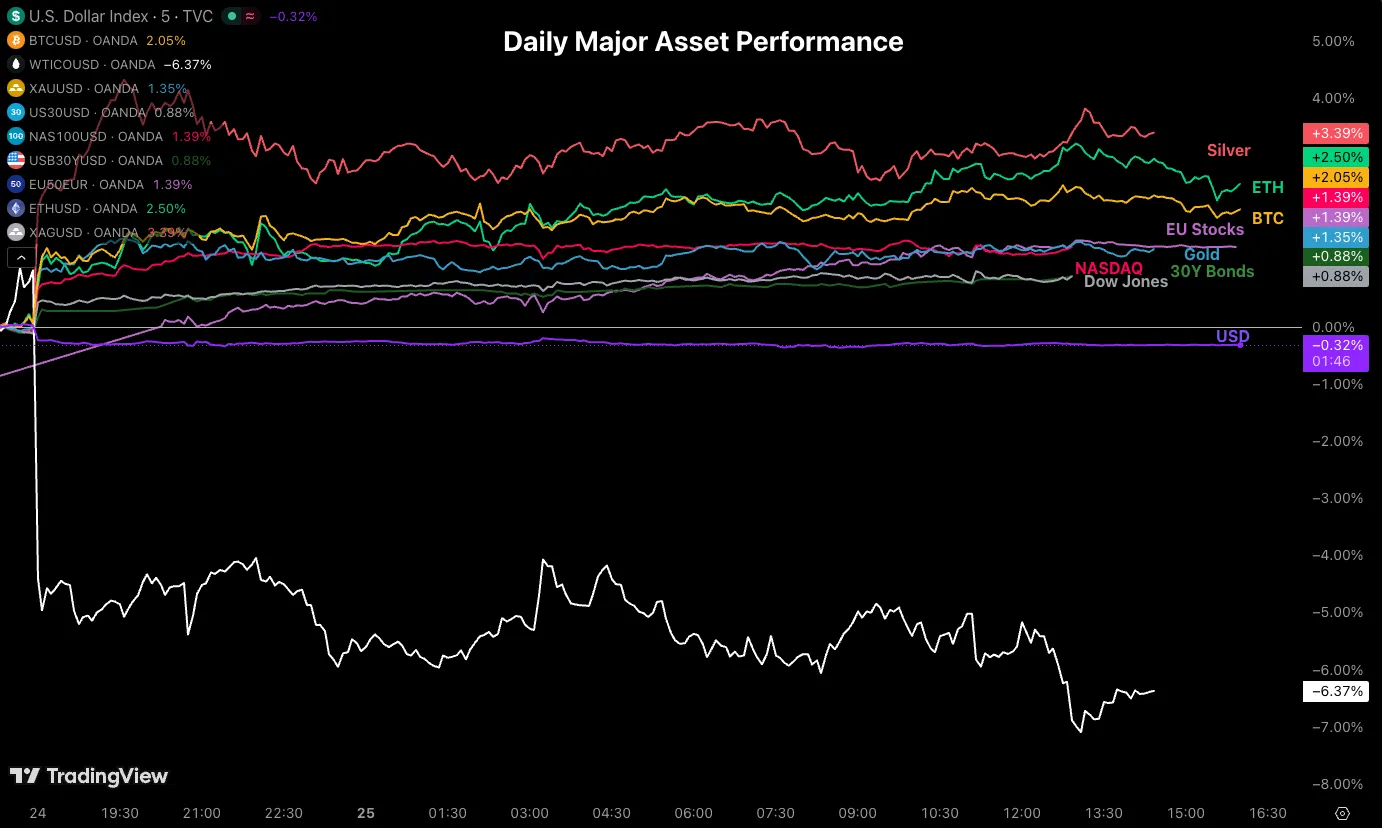
Cross-Asset Daily Performance, May 25, 2026 – Source: TradingView.
Although today’s price movements were dramatic, trading activity was lighter than usual because of global holiday closures.
Tomorrow, as traders return from the long weekend, expect much higher trading volumes and more decisive market moves as markets respond to this important geopolitical development.
Safe trades and keep your eyes on the news!
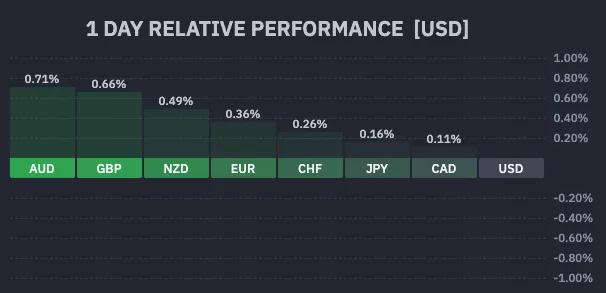
Daily FX Performance (16:14), May 25, 2026 – Courtesy of Finviz.
The Strait of Hormuz Is to Be Opened in 30 Days, Oil Down 7% – WTI Technical Analysis
- WTI Oil is back to early May levels, when initial peace processes were announced, as Trump foreshadowed a reopening of the Strait of Hormuz in 30 days.
- Crude tumbles 7% in this low-volume session, with traders looking for confirmation from price and volume, but the narrative is positive for markets to start the week.
- Exploring an in-depth technical analysis of crude oil.
WTI Crude Oil is experiencing a concrete free-fall today, tumbling 7% and crashing right back down to early May levels.
The huge catalyst driving this violent downside action is President Trump’s blockbuster announcement foreshadowing a complete reopening of the critical Strait of Hormuz within the next 30 days.
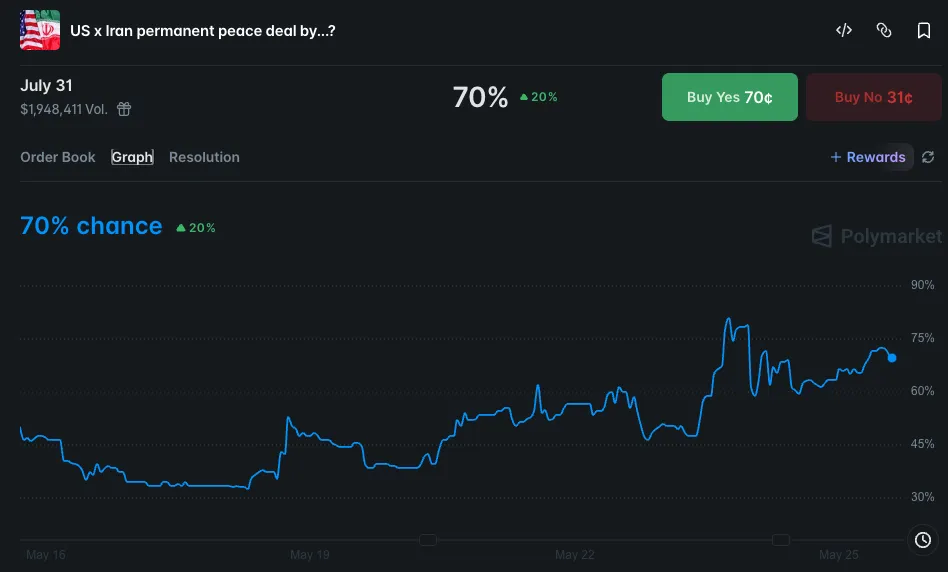
Peace Deal odds for July 31 – Source: Polymarket. May 25, 2026.
Although this severe collapse is unfolding during a notably low-volume holiday trading session, traders are still looking to confirm the price action and volume.
Regardless, the overarching narrative provides an incredibly positive fundamental tailwind for broader financial markets to kick off the trading week.
While the headline alone is enough to severely drain the geopolitical risk premium from the energy sector, traders remain acutely aware of the complex physical realities on the ground.
Crude oil may only experience its true structural correction once the strait actually resumes normal maritime operations, and even then, existing supply droughts will inevitably create lagging effects before physical prices can fully normalize lower.
Nevertheless, this massive diplomatic breakthrough represents the most concrete, actionable news the market has received in over two months.
Looking at the explosive reactions across global assets as futures markets finally open to start the shortened week, traders active during this holiday session are treating this breakthrough as a profoundly pivotal turning point for the entire energy complex.
Now, let’s take a closer look at the technical analysis for WTI Crude to see if prices can continue to correct.
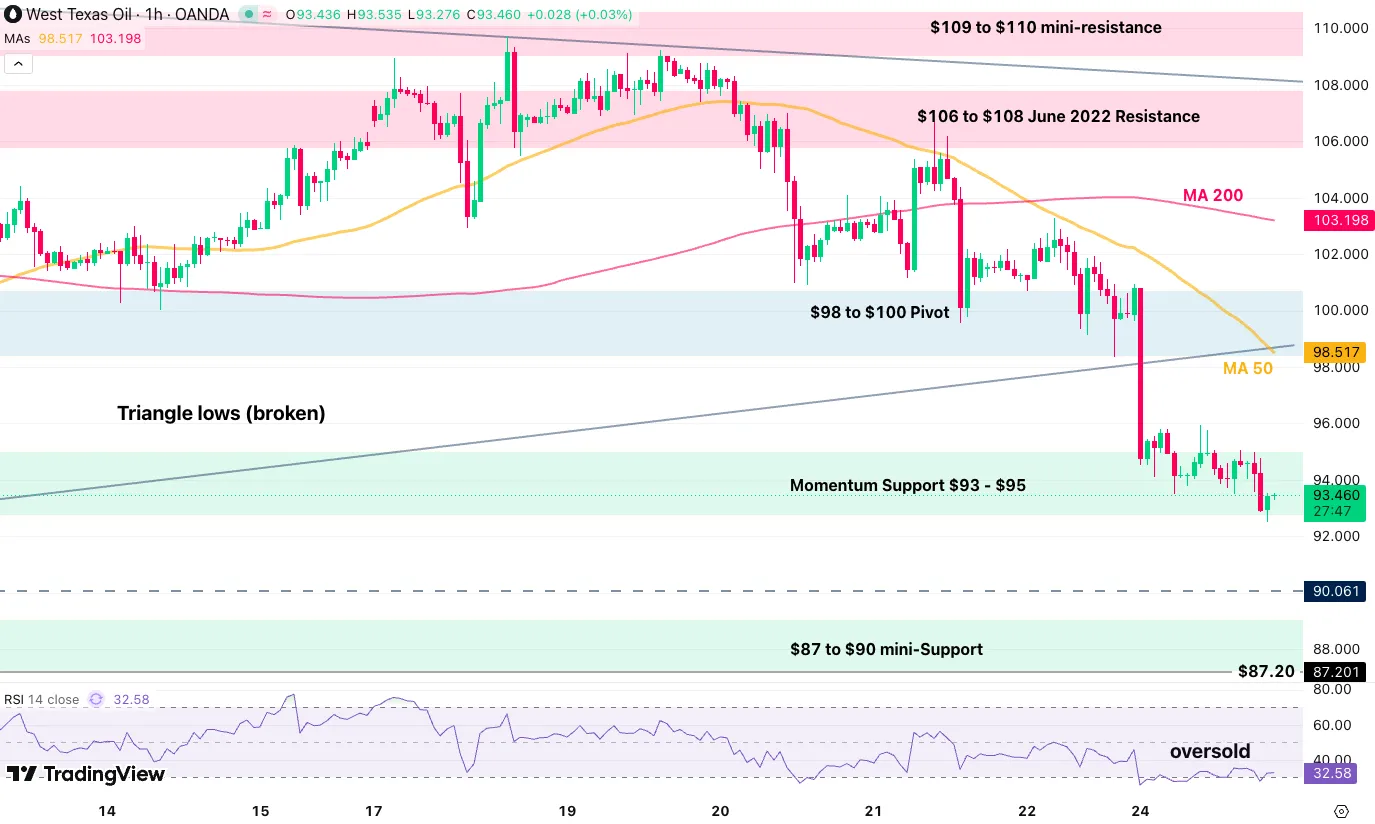
US Oil Intraday Timeframe Analysis
WTI 4H Chart and Technical Levels
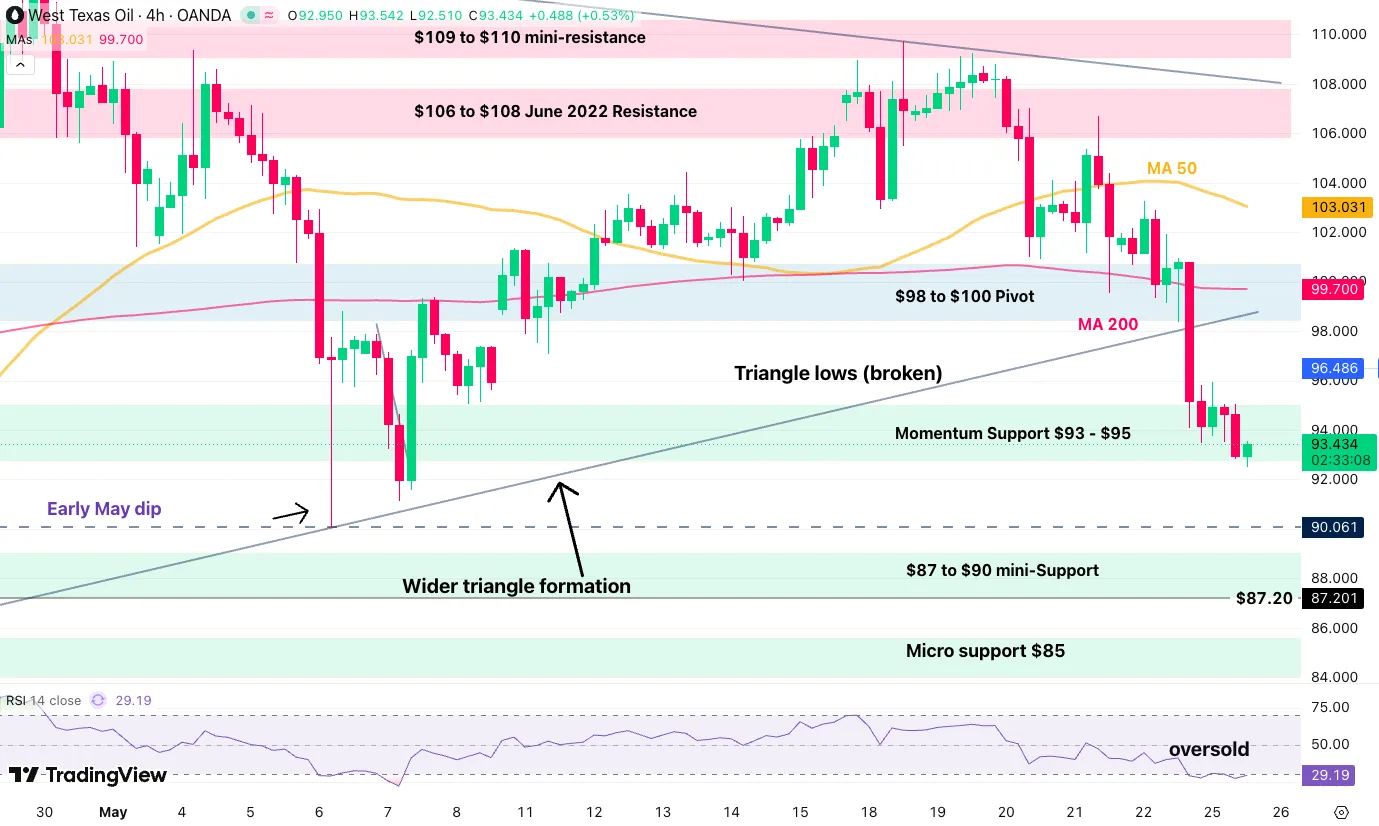
WTI Oil 4H Chart – May 25, 2026. Source: TradingView.
WTI Crude has just broken its large triangle formation, which had held since early April and now points to more downside ahead.
The headlines just landed and traders will have to be critical of how serious the idea of a Hormuz reopening really is, but what is clear is that the dynamic in oil has changed.
Reaching a key support, long-term bearish momentum will be more probable if the action fails to rebound above the $96 level, the top of the momentum support.
WTI Technical Levels:
Resistance Levels
- $98 to $100 pivot — 4H 200-period MA, short-term bearish below
- $103.03 — 4H 50-period MA
- $106 to $108 — June 2022 resistance
- $109 — Triangle resistance
- 2022 and Monday highs: $117 to $120 — larger channel top
Support Levels
- Momentum support: $93 to $95 — testing, fully bearish below
- $90 — Psychological level
- $87 to $90 — Mini-support
- $85 — Micro support
- $82 — Friday 17 lows
- $78 to $80 — 2025 highs key support
1H Chart and Action Levels
WTI Oil 1H Chart – May 25, 2026. Source: TradingView.
A good sign for bears is that despite the oversold conditions, bulls have not surged back in to buy the dip for the first time, indicating a change in momentum.
With the 50-hour MA crossing below the 200-MA, expect more selling on pops rather than buying on dips.
This would be confirmed further if bulls fail to close tomorrow’s session above the $96 highs.
Breaching below $90 reopens the way toward $80 and lower.
Safe trades and keep your eyes on the news!
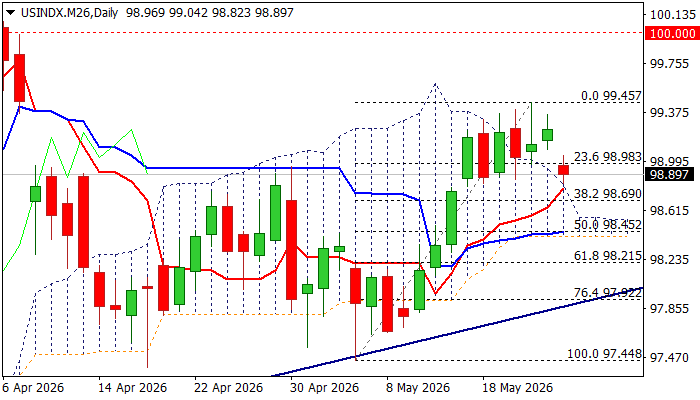
USD Index: Fresh Risk Appetite on US-Iran Talks Optimism Deflates Dollar
The dollar fell across the board at the start of the week, pressured by renewed risk sentiment on growing hopes of a deal between the US and Iran to reopen Hormuz strait and prevent deeper crisis on prolonged supply shortage.
Although the dollar opened with gap lower and dipped to 10-day low, the price remains within the near-term congestion ($98.79/$99.45), with top of thinning daily cloud, reinforced by daily Tenkan-sen ($98.80) providing so far sufficient headwinds to limit fresh bears.
Daily studies remain bullish overall, with south-heading indicators still in positive territory that signals potential scenario of consolidation / limited correction before broader bulls regain traction.
The notion is supported by quick changes of narrative about peace talks by President Trump, suggesting that optimism might be short lived and failure to reach a peace deal again would boost persisting uncertainty and provide fresh boost to safe-haven dollar.
On the other hand, lower liquidity on closure of US markets for holiday, contributes to slower and narrower moves on Monday that partially offsets negative impact on the US currency.
In anticipated negative scenario, dollar needs to clearly break below the floor of the recent range ($98.82) to generate initial bearish signal, which will need an extension below pivotal $98.50 zone (daily Kijun-sen / 50% retracement of $97.44/$99.48 upleg / daily cloud base) for confirmation.
Res: 99.04; 99.45; 99.75; 100.00; 100.26
Sup: 98.80; 98.50; 98.21; 97.92