
Sample Category Title
AUD/USD Daily Report
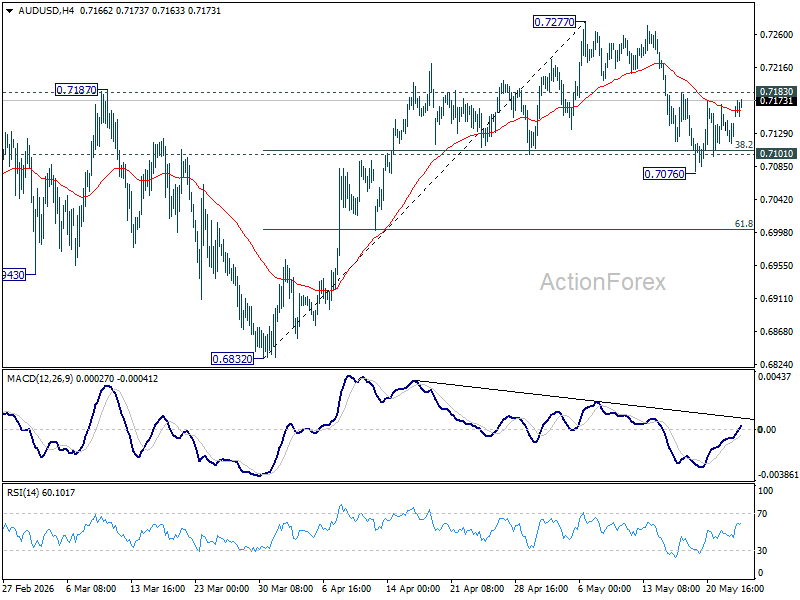
Intraday bias in AUD/USD remains neutral at this point. On the upside, firm break of 0.7183 resistance will suggest that pullback from 0.7277 has completed. Stronger rally should then be seen to retest 0.7277 high. However, decisive break of 0.7076 will indicate that larger scale correction is underway and target 0.6832 support instead.
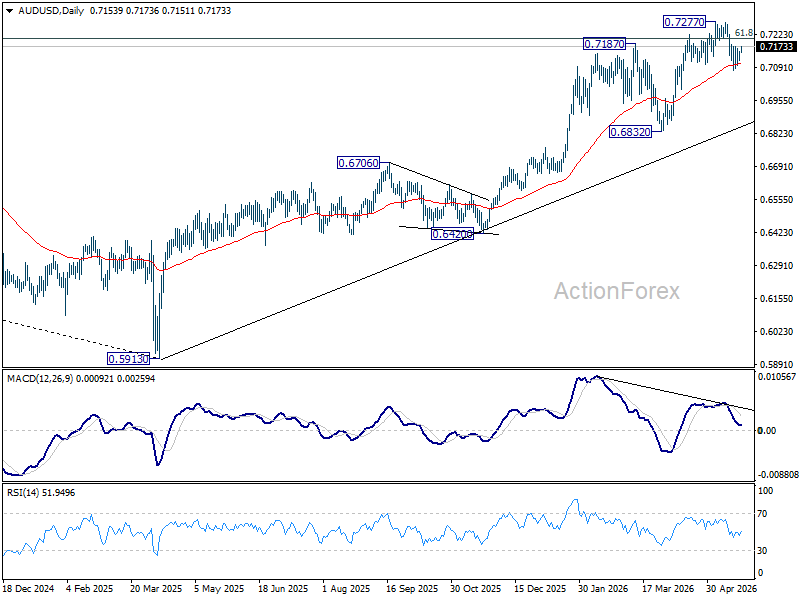
In the bigger picture, rise from 0.5913 (2024 low) is still in progress. Decisive break of 61.8% retracement of 0.8006 to 0.5913 at 0.7206 will solidify the case that it's already reversing the down trend from 0.8006 (2021 high). Further rally should then be seen to retest 0.8006. For now, outlook will remain bullish as long as 0.6832 support holds, in case of pullback.
USD/CAD Daily Outlook
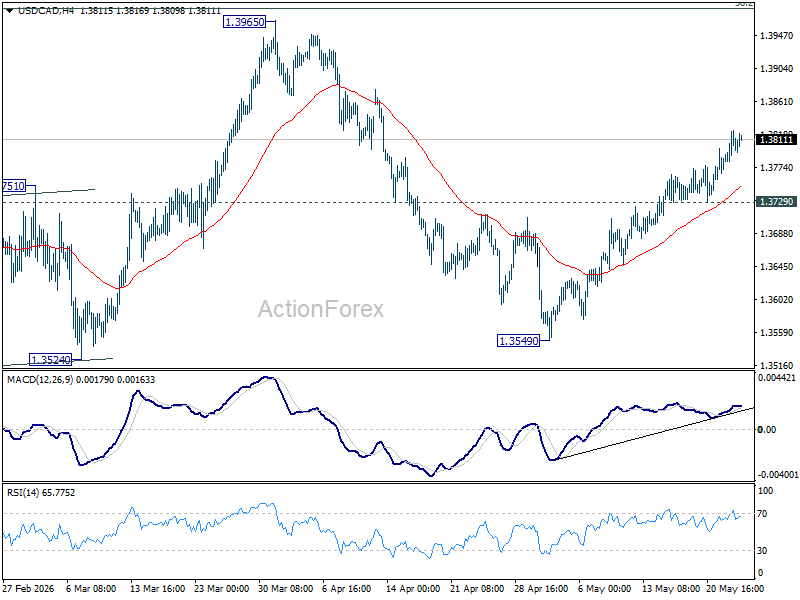
Intraday bias in USD/CAD remains on the upside at this point. Rise from 1.3549 is in progress and it's seen as the third leg of the pattern from 1.3480. Further rally should be seen to 1.3965 resistance. On the downside, below 1.3729 support will turn intraday bias neutral again.
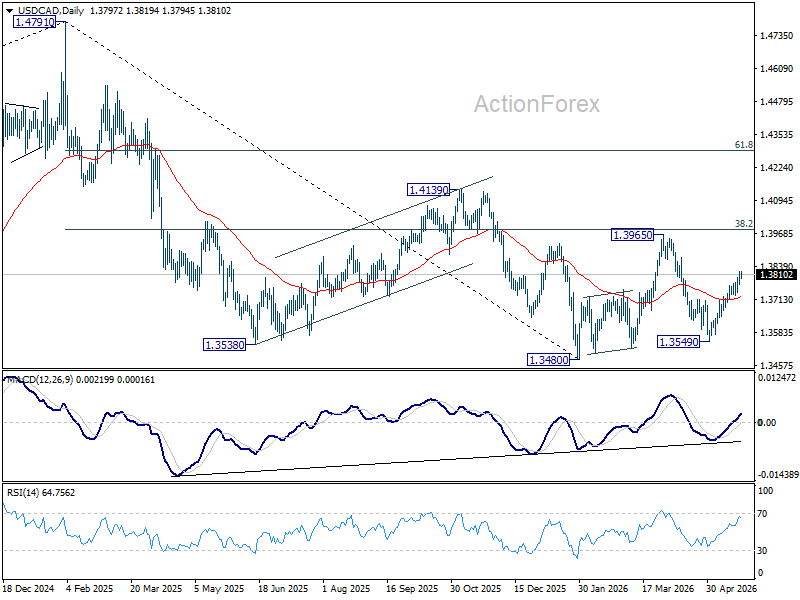
In the bigger picture, price actions from 1.4791 are seen as a corrective pattern to the whole up trend from 1.2005 (2021 low). Deeper fall could be seen, as the pattern extends, to 61.8% retracement of 1.2005 to 1.4791 at 1.3069. However, decisive break of 38.2% retracement of 1.4791 to 1.3480 at 1.3981 will argue that the correction has completed with three waves down to 1.3480 already.
GBP/JPY Daily Outlook
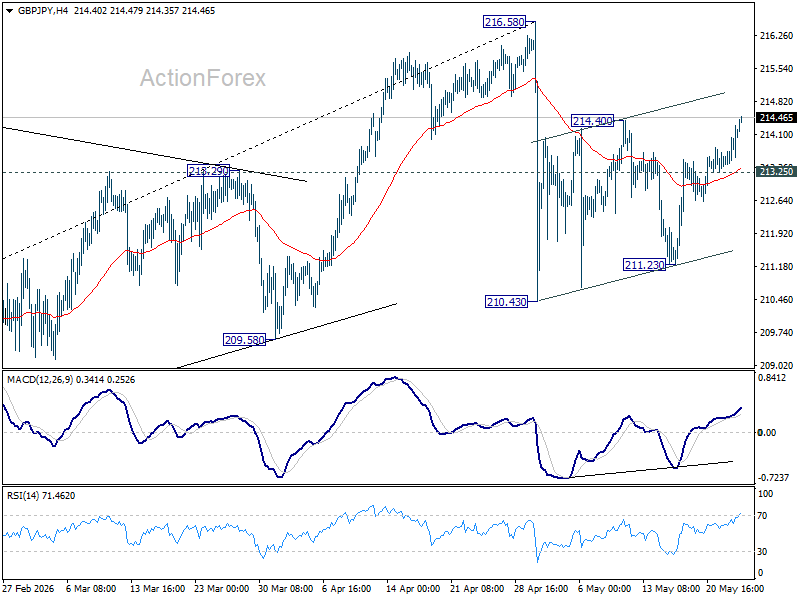
Break of 214.40 resistance suggests that GBP/JPY's rebound from 210.43 is resuming. Intraday bias is back on the upside for retesting 216.58 high. Strong resistance should be seen there to cap upside, at least on first attempt. On the downside, below 213.25 minor support will turn intraday bias neutral again first.
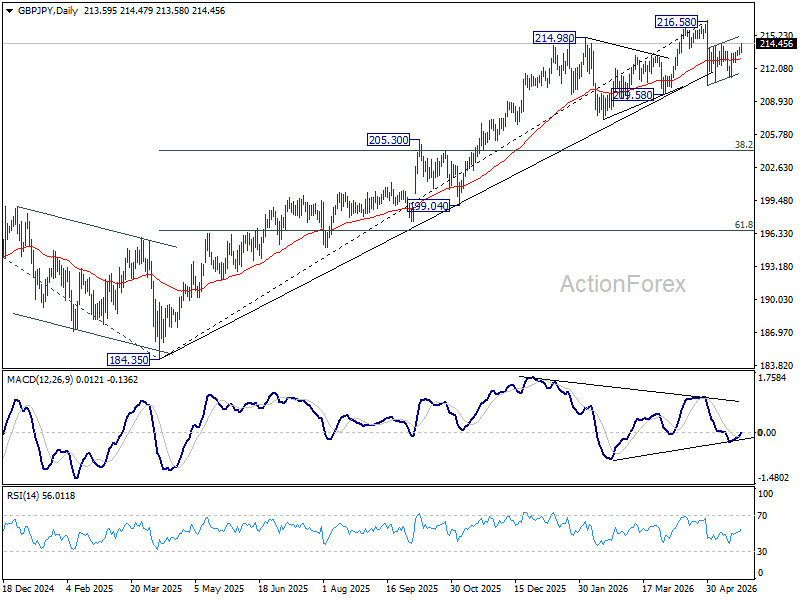
In the bigger picture, while the fall from 216.58 is steep, there is no clear sign of trend reversal yet. The long term up trend could still extend to 61.8% projection of 148.93 (2022 low) to 208.09 (2024 high) from 184.35 at 220.90 on resumption. However, sustained break of 55 W EMA (now at 206.27) will argue that it's already in medium term down trend for 184.35 support.
EUR/GBP Daily Outlook
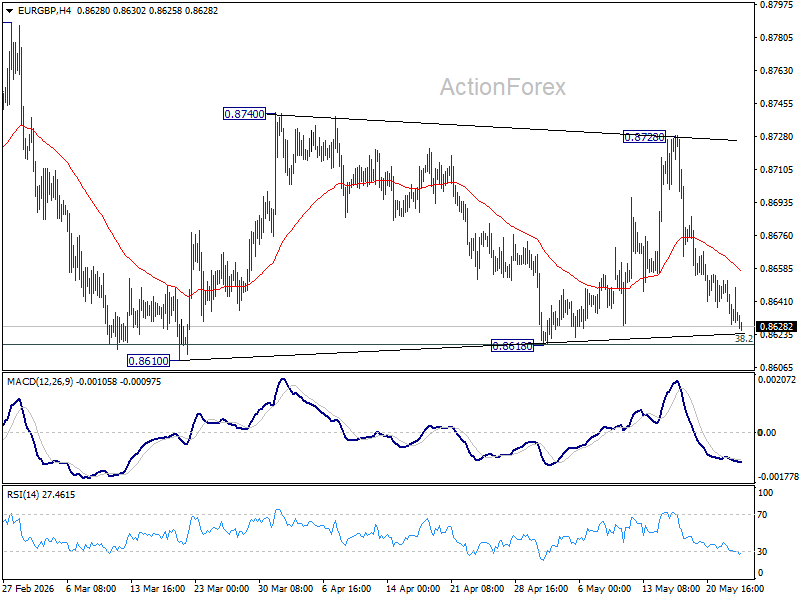
Intraday bias in EUR/GBP remains neutral as range trading continues. On the downside, decisive break of 0.8610 support will revive the case of bearish trend reversal. On the upside, break of 0.8728 resistance will bring stronger rally back towards 0.8740 resistance.
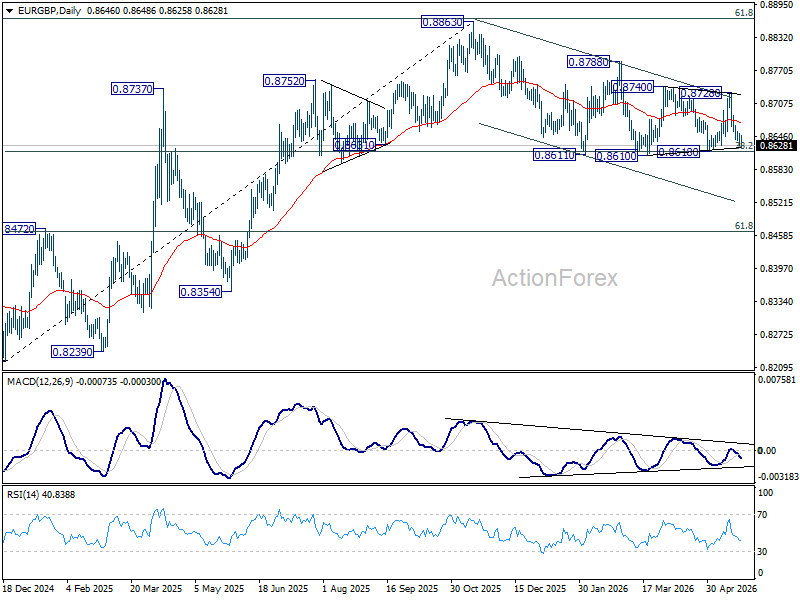
In the bigger picture, focus is staying on 38.2% retracement of 0.8821 to 0.8863 at 0.8618. Strong rebound from there will retain medium term bullishness. Rise from 0.8221 should resume through 0.8863 at a later stage. Nevertheless, sustained break of 0.8618 will confirm that whole rise from 0.8221 has completed at 0.8863. Deeper decline should then be seen to 61.8% retracement at 0.8466 at least.
EUR/AUD Daily Outlook
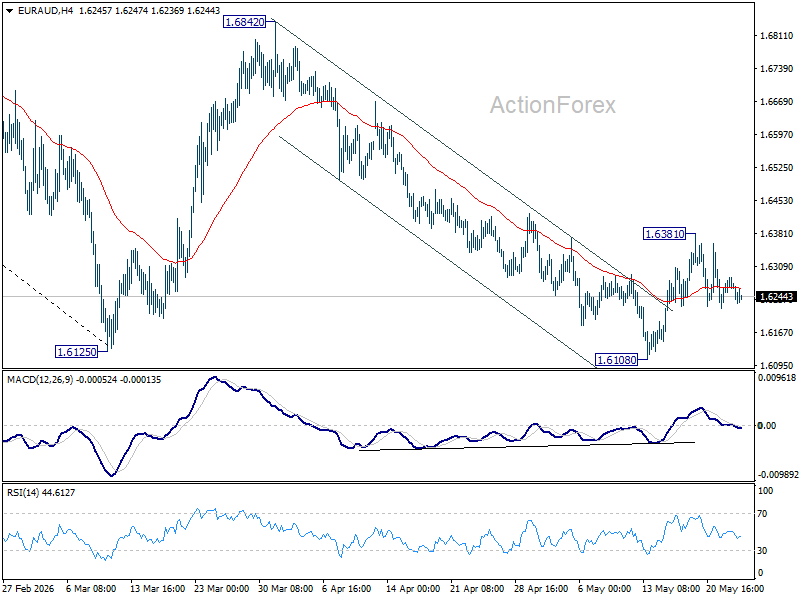
Intraday bias in EUR/AUD remains neutral for the moment. Rise from 1.6108 is tentatively seen as the third leg of the pattern from 1.6125. Above 0.6831 will target 55 D EMA (now at 1.6437) and above. Nevertheless, firm break of 1.6108 will resume the larger down trend from 1.8554.
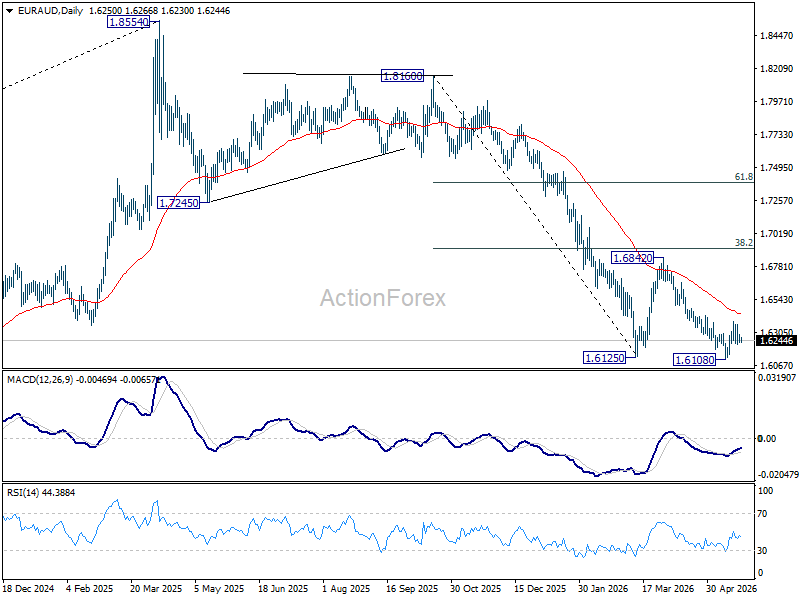
In the bigger picture, fall from 1.8554 (2025 high) is in progress and deeper decline should be seen to 61.8% retracement of 1.4281 to 1.8554 at 1.5913, which is slightly below 1.5963 structural support. Decisive break there will pave the way back to 1.4281 (2022 low). For now, risk will stay on the downside as long as 55 W EMA (now at 1.6984) holds, even in case of strong rebound.
EUR/CHF Daily Outlook
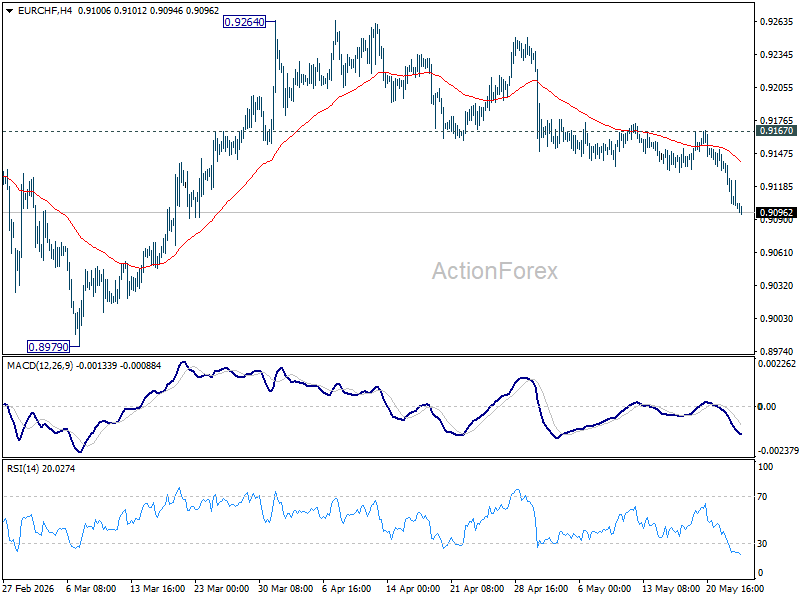
EUR/CHF's fall from 0.9264 continues today and intraday bias remains on the downside. Rebound from 0.8979 should have completed at 0.9264. Deeper fall would be seen back to retest 0.8979 low first. For now, risk will stay on the downside as long as 0.9167 resistance holds, in case of recovery.
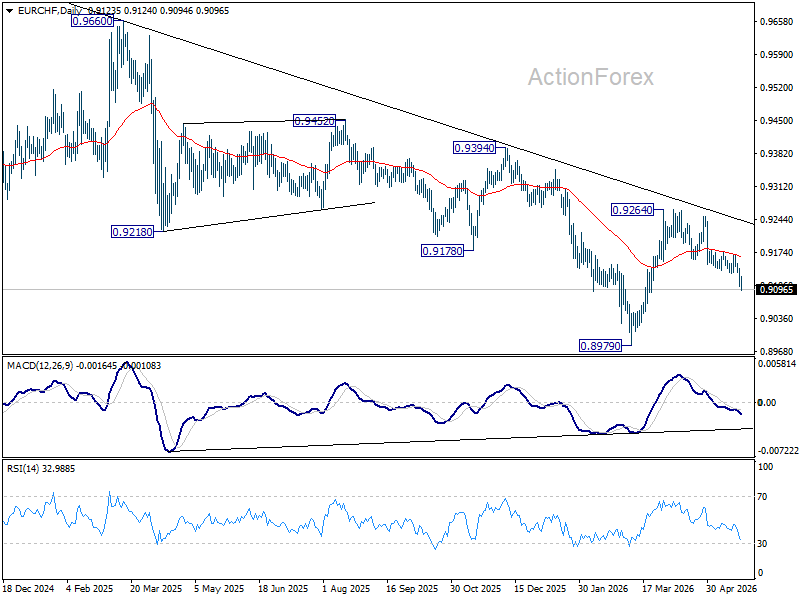
In the bigger picture, the rejection by 55 W EMA (now at 0.9252) suggests that the down trend from 0.9928 (2024 high) is still in progress. Firm break of 0.8979 will confirm down trend resumption. Outlook will stay bearish as long as 0.9394 resistance holds, in case of another rebound.
EUR/USD Starts the Week Quietly
EUR/USD began the week around 1.1600. The main currency pair closed last week virtually unchanged. Markets continue to closely monitor the situation in the Middle East. Despite ongoing uncertainty, a series of conflicting signals from the US and Iran has bolstered investor hopes for a possible diplomatic agreement.
At the same time, oil prices remain approximately 50% higher than pre-conflict levels. This dynamic continues to sustain inflationary pressure, forcing major central banks to maintain a cautious approach to monetary policy.
Minutes from the last FOMC meeting revealed that most Fed officials still allow for the possibility of additional rate hikes, particularly if inflation remains stubbornly above the 2% target.
Meanwhile, markets are increasingly pricing in a 25-basis-point Fed rate hike by the end of the year.
US markets will be closed on Monday, so volatility in EUR/USD is expected to be minimal.
Technical Analysis
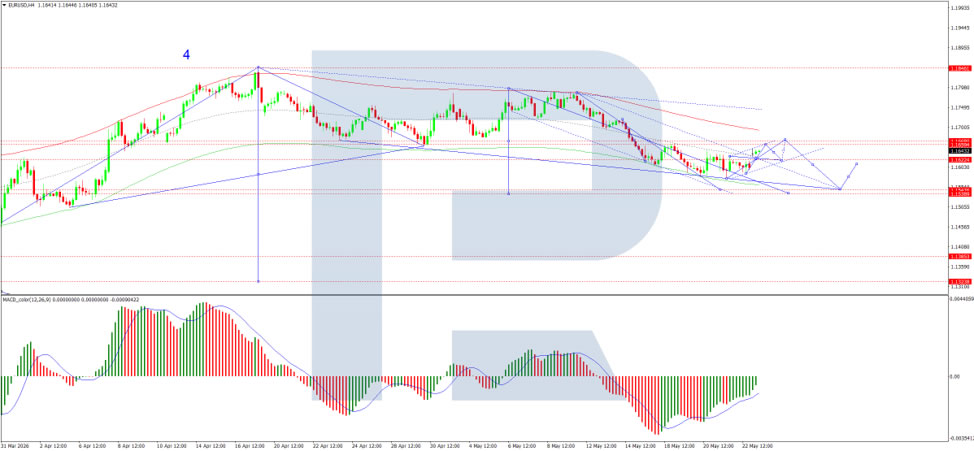
On the H4 chart of EUR/USD, the pair is trading within a consolidation range around 1.1616, currently extending up to 1.1640. A move lower to 1.1600 (testing from above) is likely, followed by a rise towards 1.1660. Technically, this scenario is confirmed by the MACD indicator, with its signal line above zero and pointing firmly upwards, indicating continued bullish momentum.
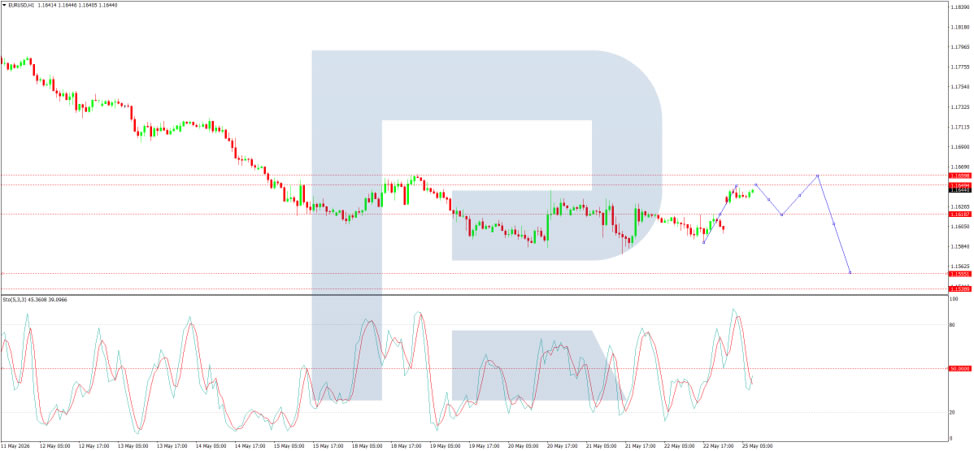
On the H1 chart, the market has completed the structure of the next growth wave to the 1.1640 level. A decline to 1.1600 is likely, followed by a rise to 1.1660, and another decline to 1.1555. Technically, this scenario is confirmed by the Stochastic oscillator. Its signal line is below 50 and pointing firmly downwards to 20.
Conclusion
EUR/USD is trading quietly at the start of the week, with markets caught between geopolitical hopes and persistent inflationary pressures. While conflicting signals from the US and Iran have raised expectations of a potential diplomatic breakthrough, oil prices remain sharply elevated, around 50% above pre-conflict levels, keeping central banks on alert. FOMC minutes revealed that most Fed officials still see the possibility of additional rate hikes if inflation stays above target, and markets are now pricing in a 25-basis-point hike by year-end. With US markets closed for a holiday, volatility is expected to remain subdued. Technically, near-term downside towards 1.1600 and potentially 1.1555 appears likely before any potential bounce.
Gold and Silver Bounce, but Traders Still Need Proof on Hormuz Normalization
Gold and Silver rebounded notably today as oil prices extended their sharp decline and markets cautiously increased bets that at least a US-Iran ceasefire expansion/extension may be approaching.
US Secretary of State Marco Rubio acknowledged as much in New Delhi, saying there was a “pretty solid thing on the table” involving reopening the strait and entering “a very real, significant, time-limited negotiation on the nuclear matter.” Meanwhile, Donald Trump described during the weekend that the arrangement as a “Memorandum of Understanding pertaining to PEACE” that had been “largely negotiated.”
Meanwhile, it's also reported that Iran had agreed “in principle” to reopen the Strait of Hormuz in exchange for the U.S. lifting its naval blockade and Tehran disposing of its highly enriched uranium. But the phrase “in principle” is doing enormous work right now. There is still no confirmation on what the actual agreement looks like, who controls transit through Hormuz, or whether enriched uranium disposal terms can realistically be finalized.
That combination of cautious optimism and lingering skepticism explains why precious metals are rebounding without fully breaking out. Markets are not yet pricing genuine normalization of global energy flows. Oil may be falling, but traders still want proof that Hormuz will truly reopen before aggressively unwinding geopolitical premiums across markets.
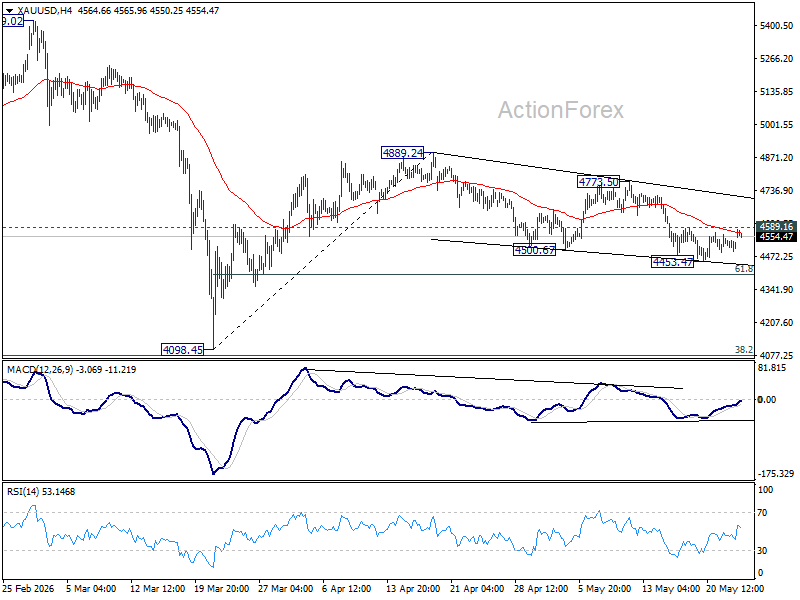
Technically, Gold's fall from 4889.24 are seen as a corrective three-wave move. Firm break of 4589.16 resistance will argue that it has already completed at 4453.47. In this case, further rise should be seen to 4773.50 resistance to confirm this bullish case.
In case of another decline, strong support should be seen from 61.8% retracement of 4098.45 to 4889.24 at 4400.53 to contain downside.
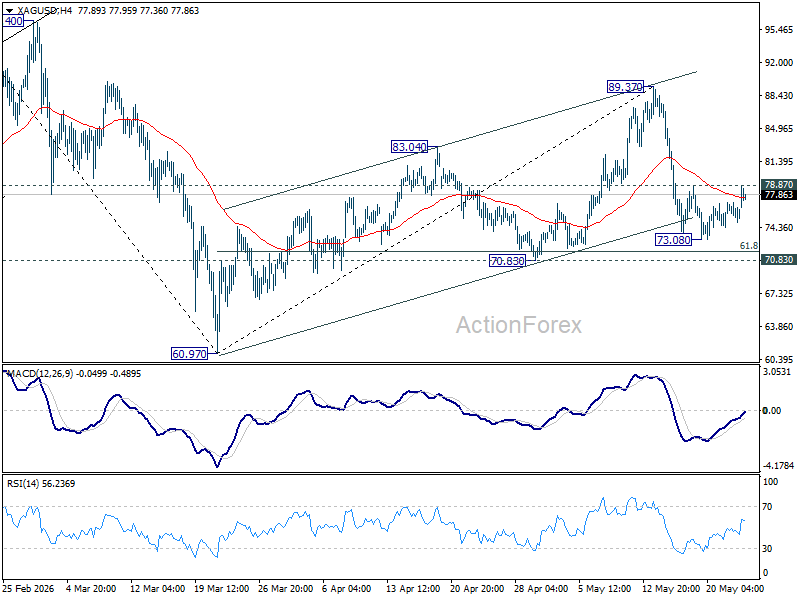
For Silver, break of 78.87 resistance will suggest that fall from 89.37 has completed at 73.08, ahead of 70.83 cluster support (61.8% retracement of 60.97 to 89.37 at 71.81). Rise from 73.08 would then be seen as the second leg of the sideway pattern from 89.37, and should target this resistance first.
Rejection of 78.87 might bring another fall, but mentioned 70.83/71.81 should hold to bring rebound.
EUR/USD Reclaims 1.1600, But Can Bulls Extend Gains?
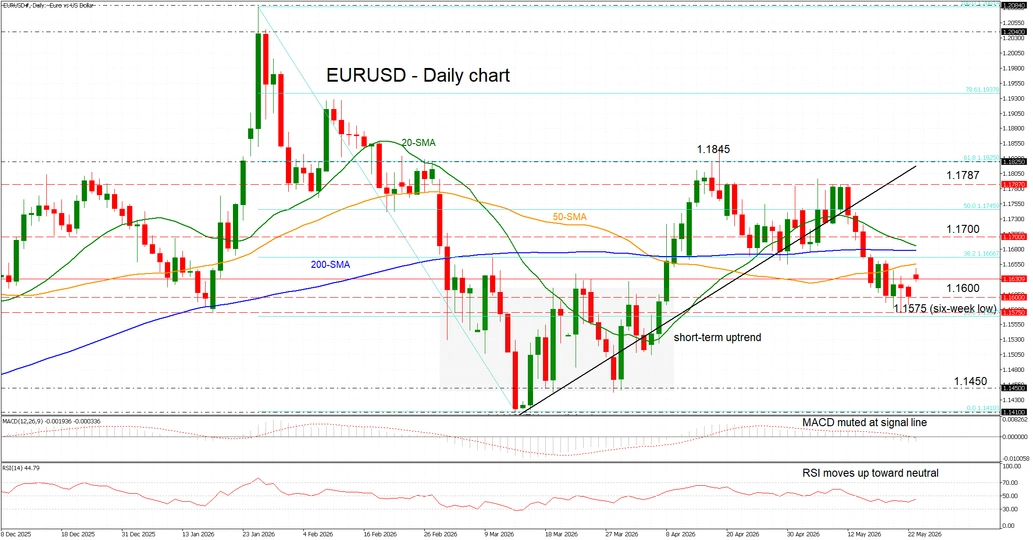
Overview: EURUSD opened with a bullish gap, reclaiming 1.1600, yet caution remains warranted as the pair trades below a dense SMA cluster and the uptrend line, keeping the near-term bias neutral despite the rebound from last week’s 1.1575 low.
Momentum: Momentum is still subdued, with the RSI and MACD in negative territory, though the RSI is edging higher, suggesting early signs of stabilization.
Bullish scenario: A decisive break above the 20-day SMA just below 1.1700 - around 1.1685, could pave the way for a retest of monthly highs near 1.1787, and potentially the April 17 peak at 1.1845.
Risk: A break below 1.1600 may reinforce the neutral outlook in the near term, while a breach of 1.1575 could trigger renewed downside pressure.
GBP/USD Turns Bullish Again While EUR/GBP Drops More
GBP/USD is showing positive signs above 1.3440 and 1.3460. EUR/GBP declined and is now consolidating losses below 0.8680.
Important Takeaways for GBP/USD and EUR/GBP Analysis Today
The British Pound started a fresh increase above 1.3420 to enter a positive zone.
There is a bullish trend line forming with support at 1.3450 on the hourly chart of GBP/USD at FXOpen.
EUR/GBP is trading in a bearish zone below the 0.8660 pivot level.
There is a connecting bearish trend line forming with resistance near 0.8650 on the hourly chart at FXOpen.
GBP/USD Technical Analysis
On the hourly chart of GBP/USD at FXOpen, the pair remained well-bid above 1.3350. The British Pound started a decent increase above 1.3400 against the US Dollar.
The bulls were able to push the pair above the 50-hour simple moving average and 1.3440. The pair even climbed above 1.3480. A high was formed at 1.3490, and the pair is now consolidating gains above the 23.6% Fib retracement level of the upward move from the 1.3395 swing low to the 1.3490 high.
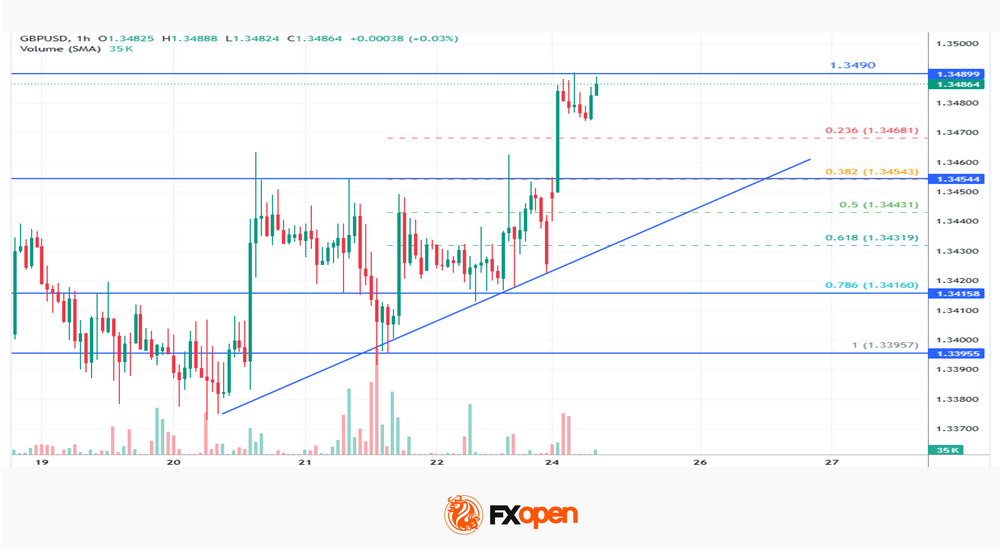
On the upside, the GBP/USD chart indicates that the pair is facing resistance near 1.3490. The next hurdle for the bulls could be 1.3500. A close above 1.3500 could open the doors for a move toward 1.3550. Any more gains might send GBP/USD toward 1.3600.
On the downside, the bulls might remain active near 1.3450. There is also a bullish trend line forming with support at 1.3450. If there is a downside break below 1.3450, the pair could accelerate lower.
The first major support could be at 1.3430 and the 61.8% Fib retracement, below which the pair could test 1.3470. The next key area for the bulls could be 1.3415, below which the pair could test 1.3395. Any more losses could lead the pair toward 1.3350.
EUR/GBP Technical Analysis
On the hourly chart of EUR/GBP at FXOpen, the pair started a steady decline from well above 0.8700. The Euro traded below 0.8680 against the British Pound.
The EUR/GBP chart suggests that the pair even declined below 0.8660 and the 50-hour simple moving average. A low was formed at 0.8630, and the pair is now consolidating losses below the 23.6% Fib retracement level of the downward move from the 0.8730 swing high to the 0.8630 low.
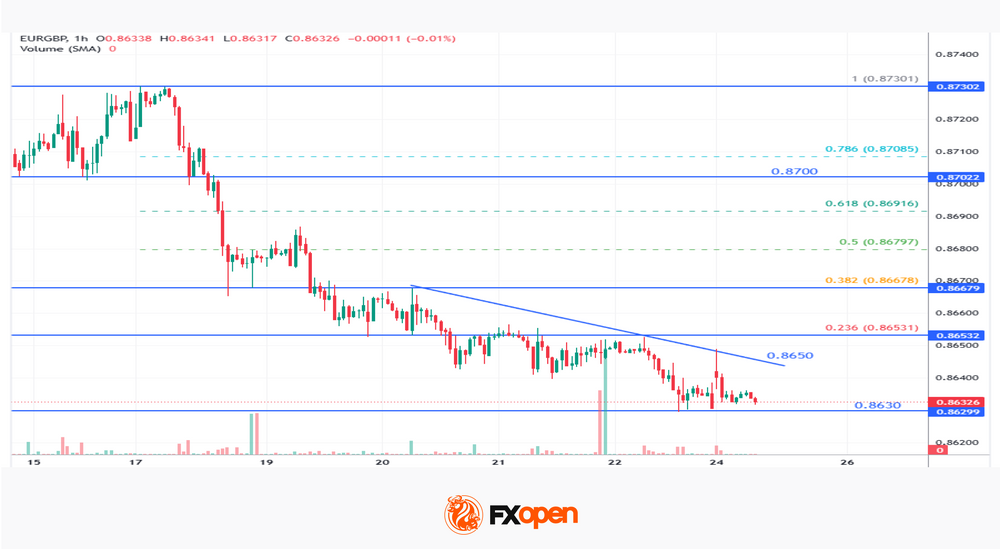
The pair is now facing resistance near a connecting bearish trend line at 0.8650. The next major barrier for the bulls could be 0.8665 and the 38.2% Fib retracement.
A close above 0.8665 might accelerate gains. In the stated case, the bulls may perhaps aim for a test of 0.8670. Any more gains might send the pair toward the 0.8730 pivot. The main hurdle for the bulls might be at 0.8780.
Immediate support could sit near 0.8630. The first key zone migbt be at 0.8600. A downside break below 0.8600 might call for more downsides. In the stated case, the pair could drop toward 0.8565.
Trade over 50 forex markets 24 hours a day with FXOpen. Take advantage of low commissions, deep liquidity, and spreads from 0.0 pips (additional fees may apply). Open your FXOpen account now or learn more about trading forex with FXOpen.
This article represents the opinion of the Companies operating under the FXOpen brand only. It is not to be construed as an offer, solicitation, or recommendation with respect to products and services provided by the Companies operating under the FXOpen brand, nor is it to be considered financial advice.