Sample Category Title
Investors In Wait-And-See Mode Ahead Of BoC And Draghi
Risk-off sentiment persists, Aussie growth disappoints
Stock market
Global equities tumbled on Wednesday as the uncertainties stemming from the North Korean situation returns. The Japanese Nikkei was down 0.14%, while the broader Topix edged up 0.08%. In offshore China, Hong Kong’s hang Seng was down 0.60% while in Taiwan the Taiex slid 0.66%. The picture is not much brighter in Europe: the Euro Stoxx 50 was down 0.30%, the DAX fell 0.20% and the CAC 40 slip 0.27%.
In spite of this small equity sell-off, demand for safe-haven assets remained subdued. The yellow metal was even edging lower, down 0.20% to $1,337 an ounce. In the FX market, the Swiss franc and Japanese yen were trading sideways. It seems that investors do not where to stands and are becoming increasingly impatient to get out this rollercoaster. Draghi will - mostly likely - unveil the ECB monetary policy plan tomorrow. This should at least reduce uncertainty partially. They will have to wait until September 20 for Yellen.
AUD
The Australian dollar took a hit overnight amid disappointing growth figures. The GDP grew 1.8%y/y, slightly below the 1.9% expected by most economists. On a quarter-over-quarter basis the economy grew 0.8% compared to 0.9% medina forecast. Nevertheless, the jump in growth compared to previous quarter data is quite substantial as the expansion was limited to 0.3%q/q. The only blot in this otherwise encouraging landscape is the drop in household saving ratio from 5.3% in the March quarter to 4.6% in the June quarter, while at the same time household spending increased 0.7%q/q. This raise the question whether the pace of growth is sustainable in the medium to long-term and if not when it will kick back economy growth as Australian start to save money again.
AUD/USD eased as low as $0.7974 this morning before stabilising slightly below $0.80. On the medium-term, the pair is still trading within its multi-month channel (0.7787-0.8066). it should remain so ahead of Draghi and most importantly Yellen in two weeks.
BoC to hike
Watch CAD on BoC meeting today
At today’s Bank of Canada monetary policy meeting we now expected a 25bp hike. The Canadian economy has accelerated for multiple quarters and expectations for rapid rise in inflation will persuade the bank to act now. However, there is a high probability the bank opts to hold to due to high level of household indebtedness and interest to monitor developments at the Fed. Either way we suspect that long CAD short USD would be a solid way to play the current environment. As strong worded comment that indicates further tightening (October if not today) will likely catch the markets behind the curve with only 65bp of hikes priced in until the end of 2018. USDCAD downtrend still in play with break of 1.2414 signaling a bearish extension targeting 1.2128.
Singapore a proxy for solid global growth
Singapore provides a solid barometer for the health of the global economy. In the Monetary Authority of Singapore (MAS) quarterly near-term outlook, called “Recent Economic Developments in Singapore” there is a clear expression of optimism in the outlook for the global and domestic economy. In particularly the bank highlighted sustained momentum in electronic industry. The MAS stated, “firm external demand conditions, coupled with the upturn in the global IT cycle, will continue to impart positive spillovers.” The MAS report revised higher G3 growth projections for both 2017 and 2018 to 1.9% from 1.8% in June. Despite negative geopolitical headlines clouding the markets outlook (North Korea a primary disturbance to investors risk appetite), according to the MAS conditions remain positive. Slow and steady global growth continues to support demand for EM currencies in the near term.
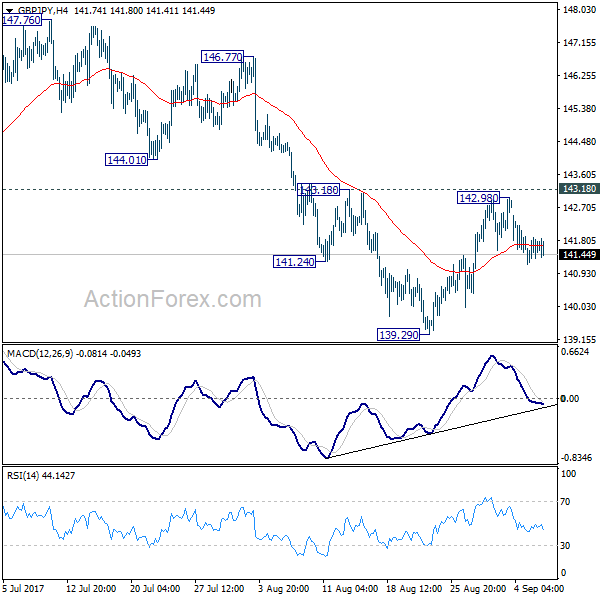
GBP/JPY Daily Outlook
Daily Pivots: (S1) 141.38; (P) 141.93; (R1) 142.38; More
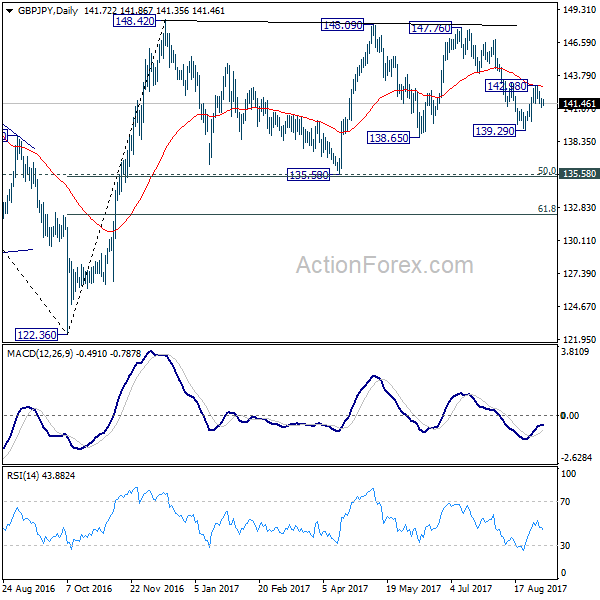
Intraday bias in GBP/JPY remains mildly on the downside for 139.29 support. Break will extend the fall from 147.76 and target 135.58 key support level. At this point, price actions from 148.42 are seen as a sideway consolidation pattern. Hence, we'll expect strong support from 135.58 to contain downside and bring rebound. Meanwhile, break of 143.18 will indicate short term reversal and turn bias back to the upside.
In the bigger picture, the sideway pattern from 148.42 is still unfolding. In case of deeper fall, we'd expect strong support from 135.58 and 50% retracement of 122.36 to 148.42 at 135.39 to contain downside. Medium term rise from 122.36 is expected to resume later. And break of 38.2% retracement of 196.85 to 122.36 at 150.43 will carry long term bullish implications. However, firm break of 135.58/39 will dampen the bullish view and turn focus back to 122.36 low.
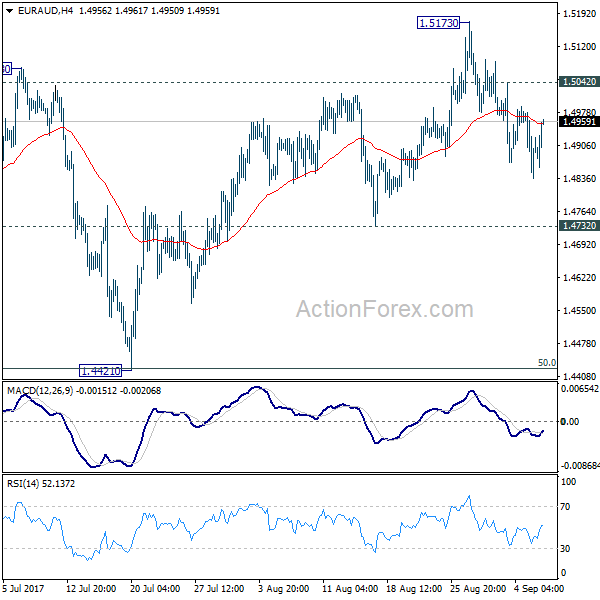
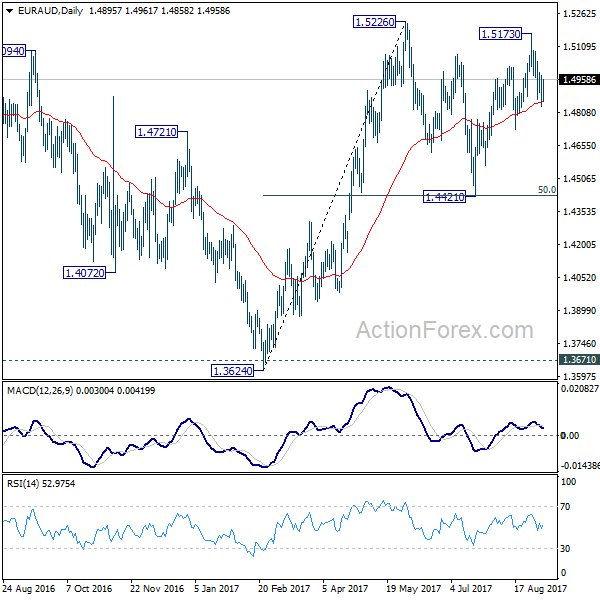
EUR/AUD Daily Outlook
Daily Pivots: (S1) 1.4827; (P) 1.4903; (R1) 1.4971; More....
At this point, deeper decline is mildly in favor in EUR/AUD for 1.4732 support. Break there will confirm that fall from 1.5173 is the third leg of consolidation pattern from 1.5226. In that case, further fall should be seen to 1.4421 again. But we'd expect strong support from there to contain downside and bring rebound. On the upside, above 1.5042 minor resistance will turn bias back to the upside for 1.5173 resistance instead.
In the bigger picture, we're holding on to the view that corrective decline from 1.6587 medium term has completed at 1.3624. Rise from 1.3624 is expected to extend to retest 1.6587. The corrective structure of the price actions from 1.5226 is affirming this view. Above 1.5226 will target a test on 1.6587 key resistance. However, break of 1.4421 will dampen our view and would drag EUR/AUD lower to retest key support zone around 1.3624.
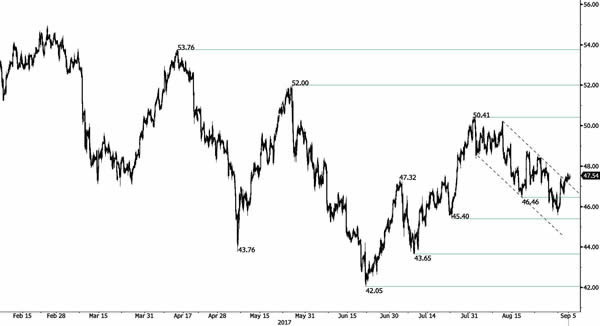
CRUDE OIL Drifting Higher
Crude Oil is drifting after break declining trendline. Strong resistance can be found at 50.41 (31/07/2017). Hourly support is given at 45.40 (17/08/2017 high). Expected to show continued short-term bearish move.
In the long-term, crude oil has recovered after its sharp decline last year. However, we consider that further weakness are very likely. Strong support lies at 35.24 (05/04/2016) while resistance can now be found at 55.24 (03/01/2017 high).
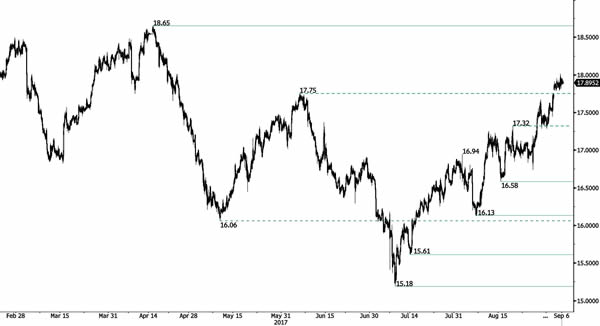
SILVER Bullish Pause
Silver has broken its key resistance at 17.75 opening the way for a test of the strong resistance at 18.65 (17/04/2017 high) while support can be found at 16.58 (15/08/2017 high). The commodity lies in an uptrend channel. Expected to show another leg higher.
In the long-term, the trend is rater negative. Further downsides are very likely. Resistance is located at 25.11 (28/08/2013 high). Strong support can be found at 11.75 (20/04/2009).
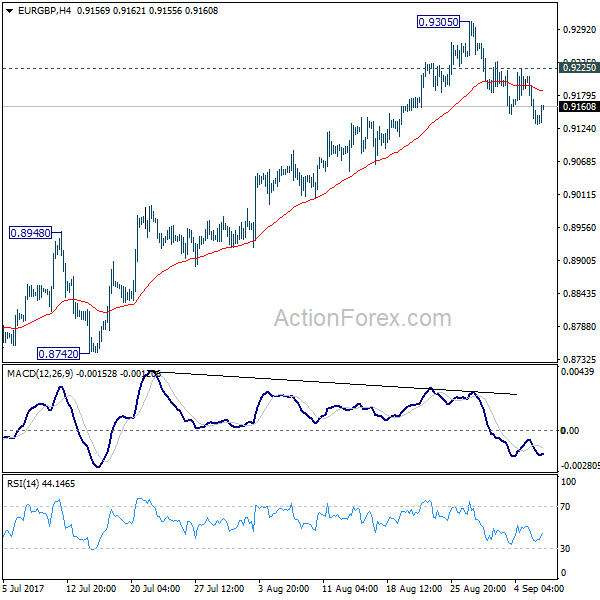
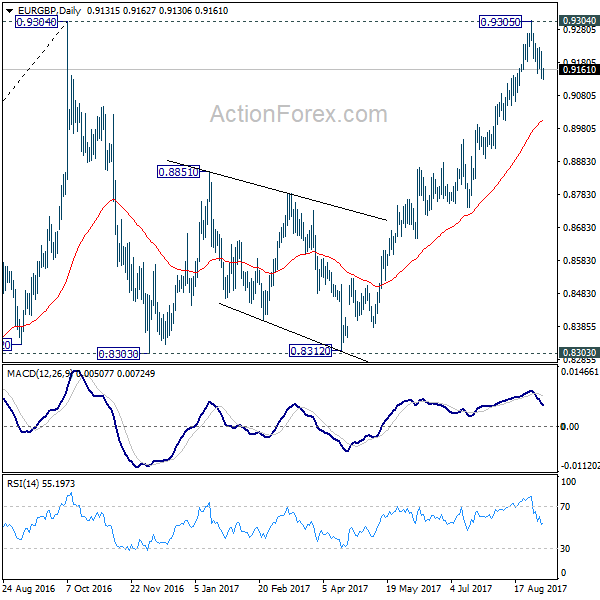
EUR/GBP Daily Outlook
Daily Pivots: (S1) 0.9111; (P) 0.9161; (R1) 0.9191; More
EUR/GBP's decline from 0.9305 is still in progress and deeper fall should be seen to 55 day EMA (now at 0.9009). Sustained trading below there will likely start the third leg of the consolidation from 0.9304 and target 0.8303 key support again. On the upside, above 0.9236 minor resistance will turn bias back to the upside for 0.9225 minor resistance instead.
In the bigger picture, price actions from 0.9304 are viewed as a medium term corrective pattern. It's uncertain whether it is finished yet. But in case of another fall, we'd expect strong support from 0.8116 cluster support (50% retracement of 0.6935 to 0.9304 at 0.8120) to contain downside and bring rebound. Whole up trend from 0.6935 is expected to resume after consolidation from 0.9304 completes. Firm break of 0.9799 high will target 61.8% projection of 0.5680 to 0.9799 from 0.6935 at 1.1054.
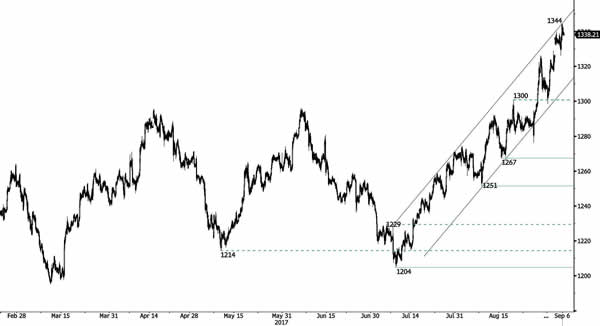
GOLD Challenging Key Rising Trendline
Gold is preparing to challenge strong resistance at 1340 which would open the way for further medium term strength.. Hourly support is given at a distance 1326 (gap low). Stronger support lies at 1204 (10/07/2017 high). Expected to show continued increase.
In the long-term, the technical structure suggests that there is a growing upside momentum. A break of 1392 (17/03/2014) is necessary ton confirm it, A major support can be found at 1045 (05/02/2010 low)
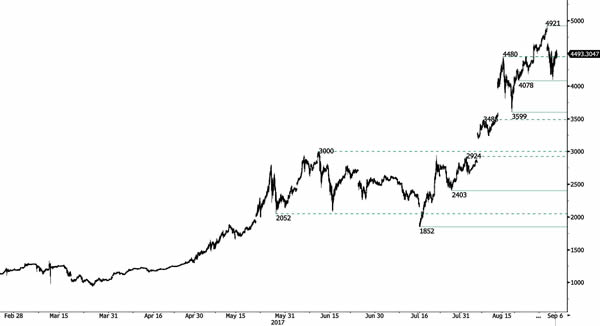
BITCOIN Recovery Bounce
Bitcoin has set a new all-time high but since declined confirming increasing selling pressures. Monitor the key support at 4480. Strong support lies very far at 3599 (22/08/2017 low). Key resistance can be located at 4921.
In the long-term, the digital currency has had an exponential growth. There are decent likelihood that the asset will reach $10'000.
EUR/CHF Breaks Rising Trendline
EUR/CHF remains weak as can be seen by the break of rising trendline. Hourly resistance lies at 1.1538 (04/08/2017 high). Hourly support is located at 1.1362 (25/08/2017 base low). Expected to show further bearishness.
In the longer term, the technical structure has reversed. Strong resistance is given at 1.20 (level before the unpeg). Yet, the ECB's QE programme is likely to cause persistent selling pressures on the euro, which should weigh on EUR/CHF. Supports can be found at 1.0184 (28/01/2015 low) and 1.0082 (27/01/2015 low).
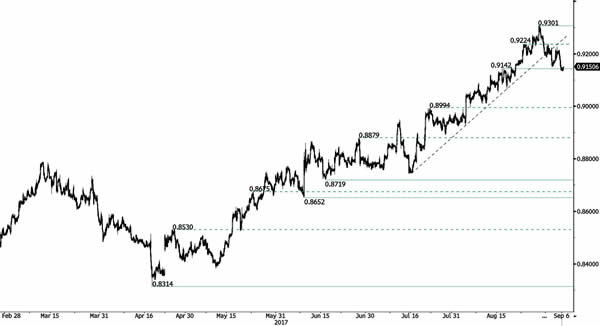
EUR/GBP Breaks Key Support At 0.9142
EUR/GBP rising trend support failed to hold as bearish pressure increases. Hourly support is given at 0.9142 (intraday low). Hourly resistance lies at 0.9306 (29/07/2017 high).
In the long-term, the pair has largely recovered from recent lows in 2015. The technical structure suggests a growing upside momentum. The pair is trading above from its 200 DMA. Strong resistance can be found at 0.9500 (psychological level).