
Sample Category Title
USDJPY Slumps To 108.50
The Japanese yen continued to move higher against the U.S dollar, reflecting the risk-averse mood in the broader markets. The USDJPY pair fell close to one percent overnight, slumping to 108.50, marking its biggest one-day drop in three months.
U.S dollar weakness is also helping to push the USDJPY pair lower, after U.S factory orders data came in at -3.3 percent for the month of August, which was the weakest reading in over three years.
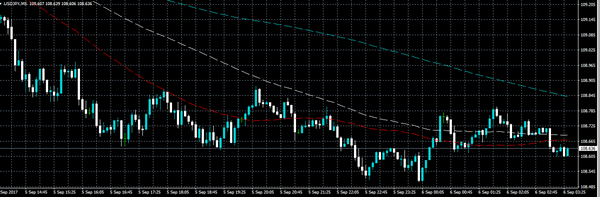
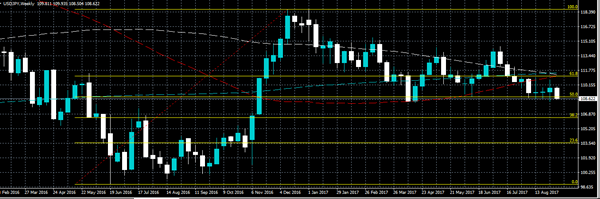
The USDJPY pair remains strongly bearish on all-time frames, with price-action now moving towards the 2017 price low, at 108.13.
Key intraday technical support is found at the former monthly price low, at 108.27, and the 2017 price low. Below the 108.13 level, further weekly support is located at the November 15th, 2016 price low, at 107.76.
Key intraday technical resistance is found at the 50 percent Fibonacci retracement, of the 118.66 price high to the 98.99 swing price low, at 108.81. Above the 108.81 level, further USDJPY resistance is found at 109.06, and the 50-hour moving average, at 109.31.
Bank Of Canada Headlines Active Wednesday Session
The economic calendar is in full swing on Wednesday, as a deluge of market-moving events are scheduled. None are bigger than the Bank of Canada (BOC) interest rate decision, which is due at 14:00 GMT.
The BOC is expected to keep interest rates on hold at 0.75%, but not everyone is banking on a status quo decision. In fact, many analysts believe the central bank will raise rates on Wednesday after Canada emerged as the G7’s fastest-growing economy in the first half of 2017.
It’s only a matter of time before the BOC hikes rates again. If policymakers don’t pull the trigger on Wednesday, they will likely do so in the next meeting.
On the data front, Germany will release its latest factory orders report at 06:00 GMT. German factory orders are projected to rise 5.8% annually in July, following a 5.1% increase the previous month.
The North American session features several prominent data releases on Wednesday. The US Commerce Department will report on Washington’s July trade balance. The nation’s deficit is expected to widen to $44.6 billion from $43.6 billion the month before.
North of the border, the Canadian government will also report on trade at 12:30 GMT. Canada’s deficit is expected to narrow to $3.3 billion in July from $3.6 billion the month before.
IHS Markit and the Institute for Supply Management will release their own versions of US services PMI on Wednesday. The Markit release is expected to show little deviation in August when compared with the previous month.
Earlier in the day, the Australian government reported that the economy expanded 0.8% in the second quarter. That was in line with the consensus view and nearly triple the previous quarter’s disappointing 0.3% gain.
USD/CAD
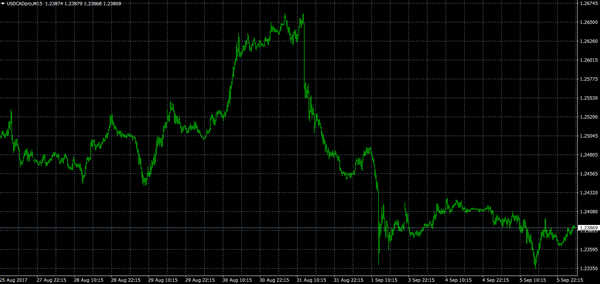
The loonie was little changed on the eve of the BOC rate decision. Technical indicators are obsolete ahead of the monetary policy announcement. A move to raise interest rates by the BOC will trigger a large rise in the Canadian dollar, which is already testing multiyear highs against the greenback.
EUR/USD
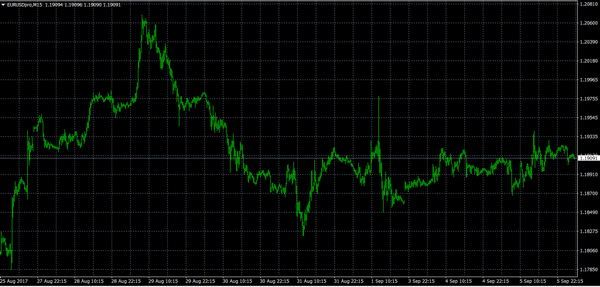
Like other dollar pairs, the EUR/USD was rangebound on Wednesday as investors eyed fresh trading catalysts. The EUR/USD toed the line at 1.1910 through the early morning hours. Immediate resistance is located at 1.1960. A breach of this level could send prices back toward the psychological 1.2000 region.
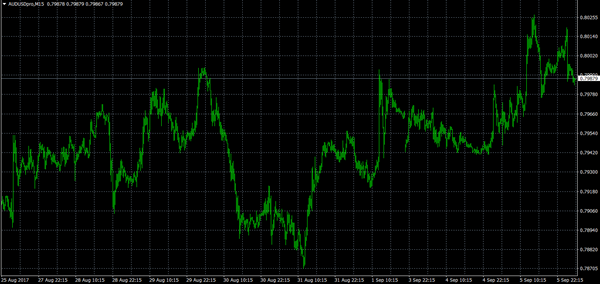
AUD/USD
The Australian dollar held within a narrow range following the GDP report. The AUD/USD exchange rate drifted 0.1% lower to 0.7986. The pair is testing the psychological 0.8000 level, which continues to separate the buyers and sellers. The AUD/USD must first clear the 0.8000 and 0.8026 handles before it can mount a re-test of the year-to-date high of 0.8065. On the opposite side of the ledger, immediate support is located at 0.7920, followed by 0.7880.
Trade Idea: EUR/JPY – Sell at 130.25
EUR/JPY - 129.88
New strategy :
Sell at 130.25, Target: 128.25, Stop: 130.85
Position: -
Target: -
Stop:-
Although the single currency has recovered after finding support at 129.37 and consolidation with initial upside bias is seen for gain to 130.00, however, reckon upside would be limited to 130.25-35 and resistance at 130.71 should remain intact, bring another decline, below said support at 129.37 would extend the fall from 131.71 top for retracement of recent upmove to 129.10-15, then towards 128.70-75 but support at 128.49 should remain intact.
In view of this, would not chase this fall here and would be prudent to sell euro on recovery as 130.25-35 should limit upside. Above said resistance at 130.71 would revive bullishness and suggest low is possibly formed, bring rebound to 131.00, then test of 131.35, break of latter level would indicate the retreat from 131.71 has ended, bring rest of this level first, above there would confirm recent upmove has resumed and extend gain to 132.00-10 but reckon upside would be limited to 132.50-60 and 133.00-10 should hold from here.
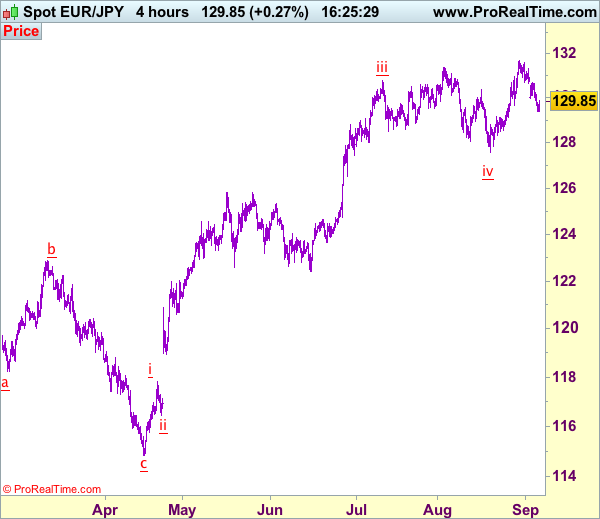
Our latest preferred count is that wave (ii) is ABC-X-ABC which ended at 123.33 and wave (iii) is unfolding with wave iii ended at 100.77, followed by wave iv at 111.57 and wave v as well as the wave (iii) has ended at 97.04, followed by wave (iv) at 111.43 and wave (v) has ended at 94.12 which is also the end of the larger degree v, this also implied the major wave (C) has also ended there, hence major correction has commenced from there with (A) leg unfolding in its lower degree wave c which has possibly ended at 145.69. Under this count, A-B-C wave (B) has commenced with A leg ended at 136.23, wave B at 143.79 and wave C has possibly ended at 149.79.
Our larger degree count is that the decline from 139.26 is wave (C) and is sub-divided into a diagonal triangle i-ii-iii-iv-v with wave i - 105.44, wave ii- 123.33, wave iii - 97.03, wave iv - 111.43, followed by the final wave v as well as the end of wave (C) at 94.12, this also mark the bottom of larger degree wave B. Under this count, major rise in wave C has commenced as an impulsive wave with minor wave III ended at 145.69, wave V is still in progress for further gain to 150.00. Having said that, this so-called wave V could well be the first leg of larger degree 5-waver wave C and this wave C should bring at least a retest of wave A top at 169.97 (July 2008).
Gold Two Factor Story | Aussie GDP Expanded| US Data And Sterling At 1.30 Under Focus
Two Factors Supporting Gold
ISM Non- Manufacturing and Fed Speeches Matter
Sterling At 1.30, For How Long?
Aussie GDP q/q Expanded
Two Factors Supporting Gold
North Korea may have another missile test any day (as there have been a few reports that the country is preparing for such event). More recently, we had more measured approach from Washington especially from president Trump who has adopted a more sensible approach rather than taking it to Twitter. I suppose 'fire and fury' tweet must have shown him that sensitive matter like these needs to be done through U.N
Gold price has retraced from it's high of 1344.44 due to the fact that the US hasn't made any rationale decision. It would be wrong to say that gold price in the recent months have moved higher mainly due to Trump. There are two important ingredients which has cooked the price of gold to this. Firstly, North Korea has reacted more notoriously due to Trump. This factor isn't going to stop anytime soon because of the unpredictable nature of both leaders; Kim Jong and Donald Trump. Finally, the global economic recovery has also supported the demand for the gold price. India and China have both increased their buying of physical metal.
In other words, we do not see the price of gold melting, there are way too many factors which are going to provide the support for the bulls. We maintain our year end target at 1350.
ISM Non- Manufacturing and Fed Speeches Matter
For the dollar index, the focus is more about the slated speeches by different Fed members. Their contrasting views and outlook for the economy makes the foundation for the dollar index. The Fed governor, Lael Brainard warned that the Fed needs to be cautious about their tightening monetary policy. The FOMC member Dudley will be speaking tomorrow and his contrasting views could push the dollar in a different direction. The upcoming US ISM non manufacturing PMI number matters for now. The forecast is for a more optimistic reading (55.8) relative to the previous reading (53.9). The dollar has been haunted by Friday's weaker payroll number and this data has a potential for a turnaround. Geopolitics and natural disasters, both are going to have a meaningful influence on the US GDP numbers and simmering warnings from rating agencies like Standard & Poor aren't aiding the dollar index.
Sterling At 1.30, For How Long?
The sterling dollar pair still enjoying the 1.30 mark against the dollar despite weaker than expected PMI which confirmed that Brexit uncertainty has made the sector to grow at the slowest pace since September.
Aussie GDP q/q Expanded
The Australian economy expanded much faster (0.8%) than the previous reading (0.3%). However, the number matched the expectations and traders have not rewarded the Aussie for that. In other words, the tail wind for the Aussie-dollar pair was not strong enough to keep the price in green territory. Government spending is aiding the growth however the RBA feels comfortable with current stance and it is no rush in changing anything yet. No change in the bank's stance is not overwhelming news for traders.
British Pound Back In Bullish Zone Vs US Dollar
Key Highlights
- The British Pound formed a bottom near 1.2773 against the US Dollar, and currently trading above 1.3000.
- The GPP/USD pair broke a major resistance area near 1.3000 on the 4-hours chart to open the doors for more upsides.
- German Factory orders in July 2017 posted a decline of 0.7% (MoM).
- Today, the BoC Interest Rate Decision is lined up and the central bank is likely to keep rates at 0.75%.
GBP/USD Technical Analysis
The British Pound started a sharp correction from 1.3265 starting August 2017 against the US Dollar. The GBP/USD pair recently formed a bottom at 1.2773 and preparing for further gains.
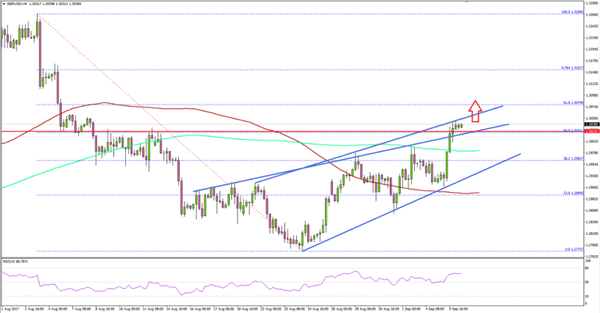
The pair during the upside broke a few important resistances like 1.2850, 1.2900, 1.3000 and 100 simple moving average (H4). There was also a break above a major contracting triangle at 1.3010 on the 4-hours chart.
A breach of the 50% Fib retracement level of the last decline from 1.3268 high to 1.2773 low also signifies a trend change. At the moment, the pair is attempting a close above a connecting resistance trend line at 1.3050.
Once there is a proper close above 1.3050, the pair might trade to 1.3100 or even 1.3150.
German Factory Orders
Today in the Euro Zone, the Factory orders report for July 2017 was released by the Deutsche Bundesbank. The forecast was lined up for an increase of 0.3% in orders compared with the previous month.
However, the actual result was disappointing as there was a decline in orders by 0.7%. Similarly, the yearly change in orders posted +5%, lower than the forecast of +5.8% and also less compared with the last +5.1%.
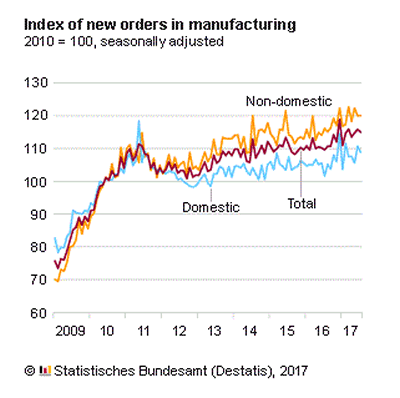
The report added that:
In July 2017 the manufacturers of intermediate goods saw new orders fall by 0.4% compared with June 2017. The manufacturers of capital goods showed decreases of 0.7% on the previous month. For consumer goods, a decrease in new orders of 3.0% was recorded.
Overall, the result could impact the market sentiment for both EUR/USD and GBP/USD. Having said that, the GBP/USD pair is likely to stay above the 1.3000-1.2960 support area in the near term.
Economic Releases to Watch Today
US Services PMI for August 2017 – Forecast 56.8, versus 56.9 previous.
US ISM Non-Manufacturing Index for August 2017 – Forecast 53.3, versus 53.9 previous.
BoC Interest Rate Decision – Forecast 0.75%, versus 0.75% previous.
Trade Idea: AUD/USD – Buy at 0.7925
AUD/USD – 0.7989
New strategy :
Buy at 0.7925, Target: 0.8125, Stop: 0.7865
Position: -
Target: -
Stop:-
Although aussie rose to as high as 0.8028 yesterday, lack of follow through buying and the subsequent retreat suggest consolidation below this level would be seen and pullback to 0.7950 cannot be ruled out, however, still reckon 0.7920-25 would limit downside and bring another rise, break of said resistance would extend gain to 0.8040-54, then retest of recent high of 0.8066 but break there is needed to confirm recent upmove has resumed for headway towards 0.8100-10 later.
In view of this, we are looking to buy aussie on pullback as 0.7920-25 should limit downside. On;y below support at 0.7871 would abort and suggest the rebound from 0.7808 has ended instead, bring further fall to 0.7850 but price should stay above said support at 0.7808.
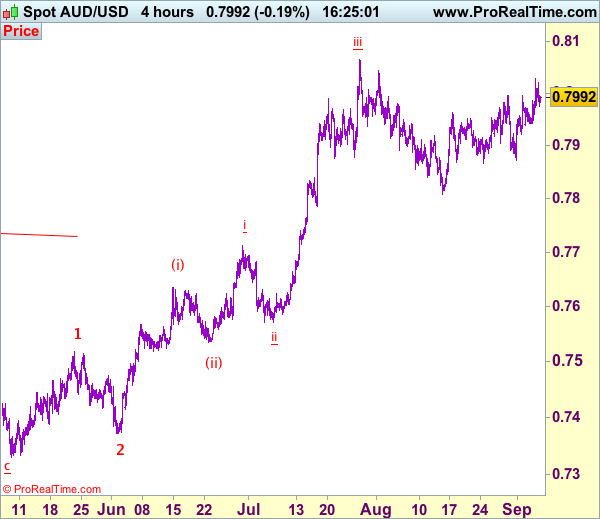
On the 4-hour chart, the move from 0.8066 is the wave 5 with i: 0.8860, ii: 0.8315, wave iii is an extended move ended at 1.0183, iv: 0.9706 and wave v has ended at 1.1081 (also the top of entire wave 5). The subsequent selloff is the major correction which is unfolding as ABC-X-ABC and 2nd A leg has ended at 0.8848, followed by a-b-c wave B which ended at 0.9758, hence, 2nd C wave is now in progress and indicated downside target at 0.7000 and 0.6950 had been met, so further fall to 0.6710-20 cannot be ruled out.
AUDUSD Consolidates Below Key 0.80 Level, Maintains Neutral To Bullish Outlook
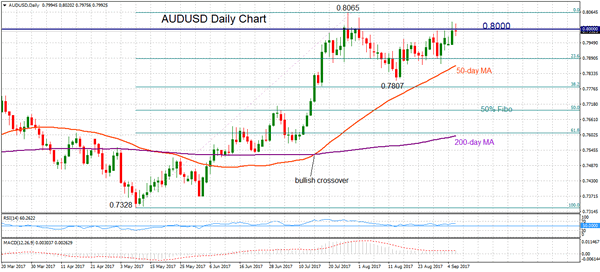
AUDUSD has a neutral to bullish bias in the short-term. The key 0.8000 level has proven to be a strong resistance level and will be quite a challenge to break. Daily momentum indicators such as RSI and MACD are pointing to a neutral outlook.
AUDUSD has been trading sideways within a broad range between 0.7890 and 0.8000 since a sharp rebound in mid-August off lows of 0.7807. Lack of upside momentum led to a consolidation phase. A horizontal MACD and RSI are highlighting a lack of clear direction in the market.
Prices spiked to a high of 0.8028 yesterday but retreated quickly to drop back below what is now a key resistance level at 0.8000. Support is at the bottom of the recent range at 0.7890 which is defined by the 23.6% Fibonacci retracement level of the upleg from 0.7328 to 0.8065 (May to July rise).
A break out of the range to the downside would target 0.7781 support (38.2% Fibonacci). A deeper decline below 0.7694 (50% Fibonacci) would change the bias to bearish.
While the short-term outlook for AUDUSD is neutral, there is room for a move to the upside as the pair is trading close to the upper end of the range. A sustained break above 0.8000 would turn focus to the upside to see a re-test of 0.8065 (a more than 2-year high). Such a move would strengthen the bullish bias to resume the uptrend from 0.7328.
AUDUSD is expected to trade sideways in the short-term. But the overall technical picture on the daily chart is neutral to bullish, with the crossover of the 50-day moving average over the 200-day MA indicating the uptrend from 0.7694 is still intact with no signs of a reversal.
EURJPY Increasingly Bearish After Break Below 130
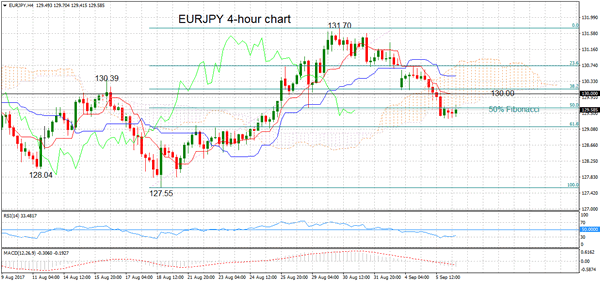
EURJPY's outlook has turned increasingly bearish following a retreat from the August 30 high of 131.70. Technical signals on the 4-hour chart are bearish. The market has fallen below the Ichimoku cloud while the Tenkan-sen has crossed below the Kijun-sen line. Momentum oscillators like RSI and MACD are in bearish territory.
EURJPY has entered a consolidation phase between 129.35 and 129.70 since the big drop below the key psychological level of 130.00 yesterday. RSI is horizontal and indicates that EURJPY is entering a neutral phase. But the indicator is below 50, highlighting overall bearishness in the market. MACD is below zero and sloping down, showing risk is tilted to the downside. Another leg lower would target support at the 61.8% Fibonacci retracement level of the 129.70 to 131.70 upleg. This level lies at 129.13. From here downward pressure would increase for a move towards 128.35 before reaching the August 18 low at 127.55. Such a move would result in a complete retracement of the uptrend from 127.55 to 131.70 and also shift the medium-term view which has been neutral on the daily chart (above 127.55).
The market is at a critical level at the moment as it is being capped by the 50% Fibonacci. Only a move above it and through 130.00 would indicate that downside pressure has eased. Rising above the cloud top at 130.90 would shift the focus to the upside for a re-test of the top at 131.70. From here there would be a resumption of the uptrend that started from 129.70.
Sideways trading is expected in the immediate term but the bearish technical signals on the 4-hour chart indicate risk is to the downside.
Dollar Tumbles As North Korea Promises A ‘Gift Of Packages’, Aussie Retreats On Disappointing GDP Growth
On Wednesday, markets continued being in a risk-averse mood as a North Korean diplomat warned the day before that more is coming from his country. However, in the US the focus turned to domestic policies, as Fed policymakers are preparing for their next meeting in two weeks’ time. With geopolitical risks in the background, the dollar weakened further following the dovish comments made by the Minneapolis Fed President Neel Kashkari. Meanwhile, the aussie lost steam after the GDP growth data appeared lower than expected.
Late on Tuesday, comments by a top North Korean diplomat enhanced the already heightened geopolitical tensions. Han-Tae-Song, who is also the North Korean Ambassador to the United Nations, threatened that the DPRK will deliver more “gift packages” to the US as long as the latter uses provocative actions to put pressure on the country. In the same day, the Russian president, Vladimir Putin, claimed that additional sanctions would lead “nowhere” while he advised that a dialogue between the countries would be more effective.
Back in the US, dovish remarks by Minneapolis Fed President Neel Kashkari who reiterated yesterday that the recent rate hikes might be a “real harm” to the economy, adding more losses to the greenback. However, early in the Asian session comments from the Dallas Fed President Robert Kaplan, gave some support to the dollar as he argued that the damage from the tropical storm Harvey might slow down the economy but will not affect the Fed’s decision to start reducing the $4.5 trillion balance sheet “as soon as next month”. He also mentioned that additional information would be needed before the central bank proceeds with a third hike this year.
The pound paused its uptrend against the dollar which drove the currency near to one-month high of $1.3043 early in Asia, moving sideways around 1.3019 later on. This came after the Brexit minister, David Davis, said late on Tuesday that Britain and the European Union have very different legal opinions on the divorce bill. Note that both sides are launching the fourth round of talks on September 18 after the third round concluded last week indecisive in many major topics including most importantly the UK’s financial obligations before it exits the bloc on March 2019.
In terms of data, Australian GDP growth figures for the second quarter missed expectations a day after the Reserve Bank of Australia decided to hold cash rates at the record low of 1.5%. Quarter-on-quarter, the Australian economy expanded by 0.8% compared to 0.3% seen in the previous quarter, though this was below the estimate of 0.9% expected by analysts. On a yearly basis, GDP growth increased by 0.1 percentage points to 1.8% but fell short of forecasts which anticipated a growth rate of 1.9% instead. Consumption increased by 0.2 percentage points in the second quarter to 0.8%, while capital expenditure rose by 1.5% from 0.4% (upwardly revised from -0.6%) seen in the previous quarter.
The aussie retreated from the one-month high of $0.8020 it touched on Tuesday to $0.7980.
The kiwi also ticked down to $0.7219 after it reached a one-week high of $0.7262 a day before, supported by higher global dairy prices which rose by 0.3% in September compared to a reduction of 0.4% in August as well as by the positive view on the Australian economy (given the relationship between the New Zealand and Australian economies).
The loonie was down by 0.19% with dollar/loonie climbing to $1.2392 before the markets close. The currency is expected to fluctuate after the Bank of Canada decides on interest rates later today.
Regarding commodities, oil prices were mixed while gold recorded some gains. WTI crude rose by 0.16% to $48.74 per barrel while Brent declined by 0.09% to $53.33. Gold was up by 0.03% at $1,338.60 an ounce.
Cautious Tone from Central Bankers As Risk Off Sentiment Returns
The US Commerce Department released Factory Order (MoM) for July that came at -3.3%, their biggest drop since August 2014. However, capital goods were stronger than the previous release, coming in at 1.2%, indicating an accelerated pace of business spending as we enter Q3.
Many Central Bankers were scheduled to speak on Tuesday. One such Central Banker was Fed Governor Brainard who expressed concern that US inflation is 'well short' of the Fed’s target (currently 2%) and that the Federal Reserve should be 'cautious about tightening policy further until we are confident inflation is on track to achieve our target'. Markets are skeptical of a rate hike anytime soon, with the probability of a December rate hike at approximately 30%. More US Central Bankers are scheduled to speak but the markets are expecting a similar tone. The markets are now anticipating that ECB President Draghi will echo similar cautiousness when the ECB meets on Thursday for a rates decision and to discuss economic policy.
To add to risk off sentiment comes reports that North Korea could develop missiles that can reach Europe sooner than expected, per French Defense Minister Parly. Her comments came after Russian leader Vladimir Putin said any new sanctions against North Korea, because of its nuclear program, would be 'useless' and 'ineffective'. More rhetoric followed with President Trump commenting on Twitter that he is allowing Japan and South Korea to buy 'a substantially increased amount of highly sophisticated military equipment from the United States'. Such comments resulted in Risk off sentiment as the market moved away from holding USD and moved into traditional safe-havens.
EURUSD climbed higher on Tuesday and currently trades around 1.1910.
USDJPY benefitted from its safe-haven status, losing 1% on Tuesday to trade as low as 108.63. The trend has continued overnight with USDJPY trading down to 108.50 in early trading. USDJPY is currently trading around 108.70.
GBPUSD saw its largest gain in 4 weeks, climbing to 1.30321 on Tuesday. The upward move continued overnight with GBPUSD currently trading around 1.3040.
Gold benefitted from safe-haven buying, trading up 0.3% to $1,338.88 on Tuesday, its highest since October 2016. Currently, Gold is trading around $1,338.
WTI rose over 2.5% on Tuesday, as many US Gulf Coast refineries are back online. WTI traded as high as $49.22pb on the day, before retracing to currently trade around $48.90. There are more concerns for the Gulf Coast as category 5 storm Hurricane Irma hits Caribbean islands and is likely to impact the south east US.
At 13:30 BST, the Bureau of Economic Analysis and the U.S. Census Bureau will release US Trade Balance for July. Consensus calls for a figure of -$44.6B, compared to the previous release of -$43.6B. The markets will be wary of volatility in USD if the release is wildly different from the forecast.
At 14:45 BST, Markit Economics will release US PMI & Composite PMI. PMI is forecast at 56.8, a slight reduction on the previous release of 56.9. Whilst any number above 50 indicates a bullish USD, the markets will be closely watching as to any aberration from the forecast.
At 15:00 BST, Institute for Supply Management (ISM) will release US Non-Manufacturing PMI for August. Consensus is for a decline to 53.3 from the previous reading of 53.9. Again, any significantly different number from the expected will likely cause USD volatility.
At 15:00 BST, The Bank of Canada will release their Interest Rate Decision along with a statement on the current Canadian economic outlook. The markets expect rates to remain at 0.75% although the tone of the statement is likely to cause volatility in CAD.