
Sample Category Title
AUD/USD Candlesticks and Ichimoku Analysis
Weekly
• Last Candlesticks pattern: Long white candlestick
• Time of formation: 10 Jul 2017
• Trend bias: Up
Daily
• Last Candlesticks pattern: Long white candlestick
• Time of formation: 18 Jul 2017
• Trend bias: Up
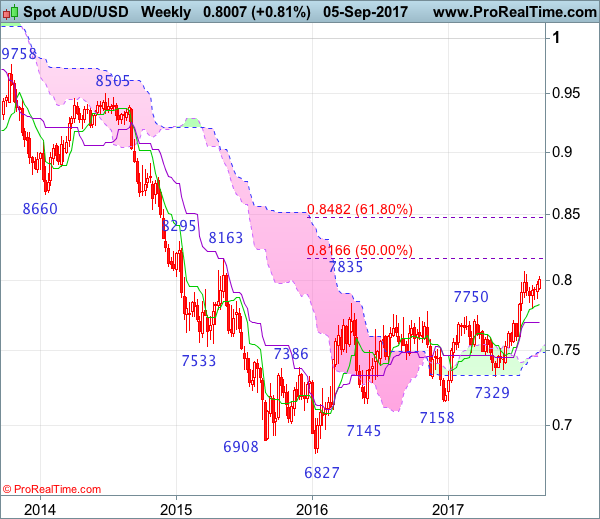
Although aussie retreated last week to as low as 0.7871, as renewed buying interest emerged there and the pair has risen again, retaining our bullishness (we recommended to buy at 0.7920 and a long position was entered) for gain towards recent high at 0.8066, however, break there is needed to confirm recent upmove has resumed and extend the medium term erratic rise from 0.6827 to 0.8163 resistance, then 0.8200 but loss of near term upward momentum should limit upside and reckon another previous resistance at 0.8295 would hold.
On the downside, whilst pullback to the Tenkan-Sen (now at 0.7950) cannot be ruled out, reckon 0.7921 support would hold and bring another rise to aforesaid upside targets later. Below support at 0.7867-71 would abort and prolong consolidation, risk weakness to 0.7830 but indicated support at 0.7808 should hold from here. Only below said support at 0.7808 would signal the corrective fall from 0.8066 temporary top is still in progress for retracement of recent upmove to 0.7760 (61.8% Fibonacci retracement of 0.7571-0.8066) but reckon downside would be limited to previous resistance at 0.7712 and 0.7670-75 would hold from here, bring another rebound later.
Recommendation: Hold long entered at 0.7920 for 0.8120 with stop now at break-even.

On the weekly chart, as aussie has surged again after finding renewed buying interest at 0.7871, retaining our view that the pullback from 0.8066 has ended at 0.7808 earlier and consolidation with upside bias remains for gain towards said resistance at 0.8066, however, break there is needed to confirm recent erratic rise from 0.6827 low has resumed and extend upmove to previous resistance at 0.8163, then 0.8250 but near term overbought condition should limit upside to another previous resistance at 0.8295 and price should falter below 0.8390-00, bring retreat later.
On the downside, expect pullback to be limited to this week’s low at 0.7938 and bring another rise later. Only below support at 0.7867-71 would defer and risk another test of said support at 0.7808, a weekly close below there would revive near term bearishness for retracement of recent rise to 0.7750, however, a sustained breach below previous resistance at 0.7712 is needed to signal a temporary top has been formed at 0.8066, bring test of the Kijun-Sen (now at 0.7698), then towards 0.7600-10 but support at 0.7571 should contain weakness.
Geopolitical Uncertainty And Florida Hurricane Weighed On Market Sentiment
The Dollar Was On The Losing End Due To Downbeat Fed Remarks And Persistent North Korea Jitters. The dollar edged down against the yen on Wednesday, getting closer to a recent 4-1/2 month low, pressured by simmering tensions on the Korean peninsula. Adding to pressure on the dollar, Federal Reserve Governor Lael Brainard said on Tuesday that inflation was “well short” of target, so the Fed should be cautious about raising U.S. interest rates.
The Yen Left Most Of Its Counterparts Eating Dust. The Japanese currency was the one safe-haven to rule them all as the franc was previously dragged lower by weaker than expected Swiss GDP while the dollar reacted negatively to Fed officials’ remarks.
The Kiwi Managed To Hold On To Most Of Its Intraday Gains. Even with the presence of risk-off vibes, the higher-yielding Kiwi managed to advance against most of its counterparts likely due to the 0.3% rebound in dairy prices during the GDT auction.
Gold Extends Gains. Gold kept raking in gains and is closing in on its yearly high on safe-haven flows. The precious metal is up 1.09% to $1,344.96 per troy ounce.
Watch Out Today For:
14:00 pm GMT: BOC Interest Rate Decision
Daily Technical Analysis: EURUSD, GBPUSD, USDJPY, USDCHF
EURUSD
The EURUSD was indecisive yesterday. There are no changes in my technical outlook. The bias remains neutral in nearest term. Overall I remain bullish but as long as stay below 1.2000 price is still in a bearish correction phase with key support seen at 1.1823. A clear break and daily close below that area could trigger further bearish correction testing 1.1750 – 1.1700 region but any downside pullback should be seen as a good opportunity to buy. On the upside, we need a clear break at least above 1.2000 to potentially end the current bearish correction phase targeting 1.2175 region or higher.
GBPUSD
The GBPUSD had a significant bullish momentum yesterday, broke above the range area as you can see on my daily chart below, topped at 1.3042 and hit 1.3044 earlier today in Asian session. The bias is bullish in nearest term testing 1.3125 region. Immediate support is seen around 1.2980 (former resistance). A clear break back below that area could lead price to neutral zone in nearest term as direction would become unclear. Overall I remain neutral.
USDJPY
The USDJPY had a bearish momentum yesterday bottomed at 108.63 and hit 108.50 earlier today in Asian session. The bias is bearish in nearest term but note that we need a clear break and consistent movement below 108.70 to continue the bearish pressure targeting 108.00 – 107.50 or lower. Immediate resistance is seen around 109.25. A clear break above that area could lead price to neutral zone in nearest term testing 109.80 – 110.00 region. Overall I remain neutral.
USDCHF
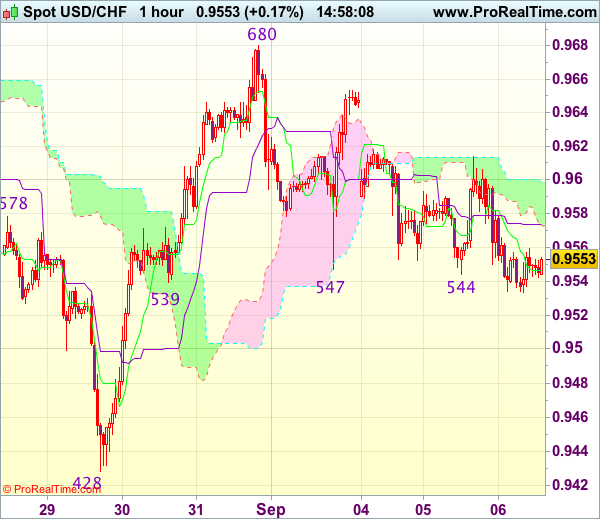
The USDCHF attempted to push higher yesterday topped at 0.9614 but whipsawed to the downside and closed lower at 0.9546. The bias is bearish in nearest term testing 0.9525 but key support remains at 0.9450. Immediate resistance is seen around 0.9600. A clear break above that area could lead price to neutral zone in nearest term testing 0.9650 area. I still prefer to stand aside and the best trading plan for me is to buy around 0.9450 or sell around 0.9765.
Trade Idea : USD/CHF – Buy at 0.9500
USD/CHF - 0.9548
Most recent candlesticks pattern : N/A
Trend : Down
Tenkan-Sen level : 0.9546
Kijun-Sen level : 0.9574
Ichimoku cloud top : 0.9599
Ichimoku cloud bottom : 0.9573
Original strategy :
Buy at 0.9500, Target: 0.9600, Stop: 0.9465
Position : -
Target : -
Stop : -
New strategy :
Buy at 0.9500, Target: 0.9600, Stop: 0.9465
Position : -
Target : -
Stop : -
As the greenback has remained under near term pressure and consolidation with initial downside bias remains, hence weakness to 0.9520-25 cannot be ruled out, however, if our view that low has been formed at 0.9428 last week is correct, downside would be limited to 0.9500 and bring another rebound later. Above 0.9615-20 would suggest low is possibly formed, bring test of 0.9653-55 resistance, break there would bring another rise to 0.9680 but break there is needed to add credence to this view and extend gain to resistance at 0.9698-99.
In view of this, we are inclined to buy dollar on further subsequent decline. Below 0.9490-00 would risk weakness to 0.9470 but still reckon downside would be limited to 0.9450 and said support at 0.9428 should remain intact, bring another rebound later.
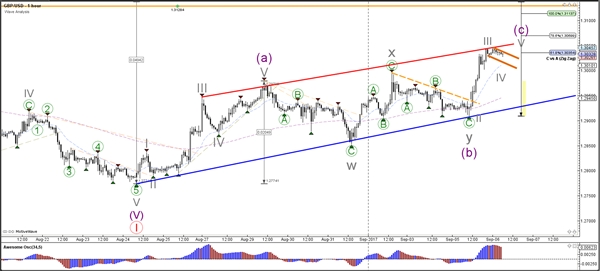
Daily Technical Analysis: GBP/USD Breaks Resistance And Approaches Wave C Target At 1.31
Currency pair GBP/USD
The GBP/USD did break above the resistance trend line (dotted orange) which kick started an impulsive wave C (purple). This C wave has reached the 50% Fibonacci level of wave 2 vs 1 but could extend further to the 61.8% Fib. This Fib plus the resistance levels of a potential head and shoulders pattern on the daily chart (orange lines) could act as potential resistance.
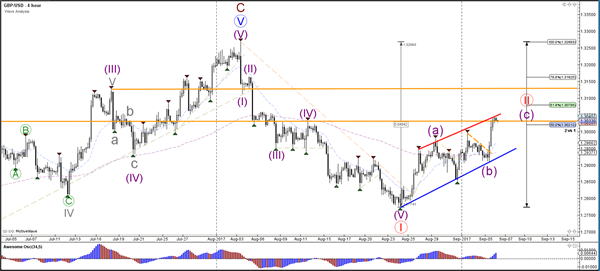
The GBP/USD could be building a wave 4 (grey) correction within the wave C (purple). A potential bull flag pattern (orange lines) could confirm this wave 4 structure. The target zone is around 1.3075- 1.31. The bearish retracement should typically not retrace deeper than 1.30-1.2975 otherwise price might not be in smaller wave 4 (grey).
Currency pair EUR/USD
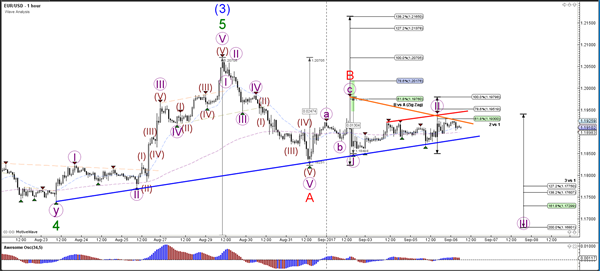
The EUR/USD is moving slowly and choppily and remains in a corrective chart pattern between support and resistance trend lines (blue/red). A break below the support trend line (blue) could confirm a potential ABC correction (red). The ABC correction (red) is invalidated if price breaks above the 138.2% Fib at 1.2165. A break above the resistance trend line (red) could indicate that there is bullish pressure to test the Fib levels of wave B vs A.
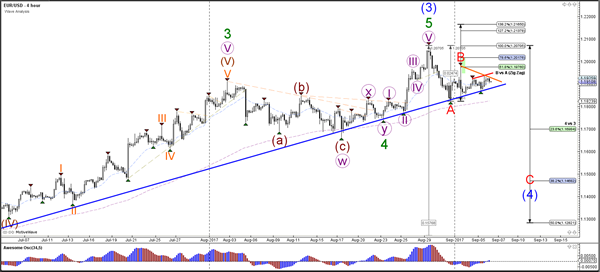
The EUR/USD could be building a potential wave 1 and 2 (purple) within wave C (red) and test the Fibonacci levels of wave 2 vs 1 (purple). A break above the 100% Fib level at 1.1980 invalidates it and could indicate that price will challenge higher Fib levels of wave B vs A. A bearish break below support (blue) could start the wave 3 (purple).
Currency pair USD/JPY
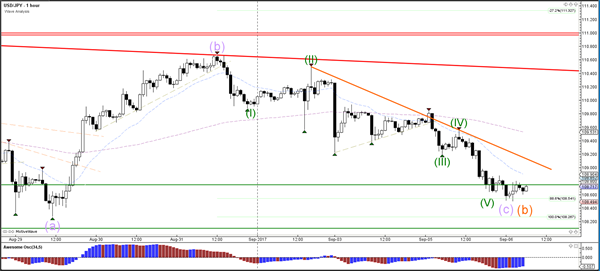
The USD/JPY is retesting the support zone (green) again which is a bounce or break spot. A bearish break below the zone indicates a downtrend whereas a bounce could indicate a continuation of wave C (orange).
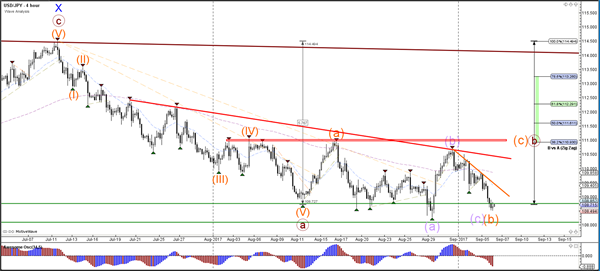
The USD/JPY is testing the 88.6% Fibonacci support level. A bullish bounce and then bullish break above resistance (orange) could indicate the completion of wave B (orange).
Daily Technical Outlook And Review: EUR/USD, GBP/USD, AUD/USD, USD/JPY, USD/CAD, USD/CHF, DOW 30, GOLD
A note on lower timeframe confirming price action...
Waiting for lower timeframe confirmation is our main tool to confirm strength within higher timeframe zones, and has really been the key to our trading success. It takes a little time to understand the subtle nuances, however, as each trade is never the same, but once you master the rhythm so to speak, you will be saved from countless unnecessary losing trades. The following is a list of what we look for:
- A break/retest of supply or demand dependent on which way you're trading.
- A trendline break/retest.
- Buying/selling tails ... essentially we look for a cluster of very obvious spikes off of lower timeframe support and resistance levels within the higher timeframe zone.
- Candlestick patterns. We tend to only stick with pin bars and engulfing bars as these have proven to be the most effective.
We typically search for lower-timeframe confirmation between the M15 and H1 timeframes, since most of our higher-timeframe areas begin with the H4. Stops are usually placed 1-3 pips beyond confirming structures.
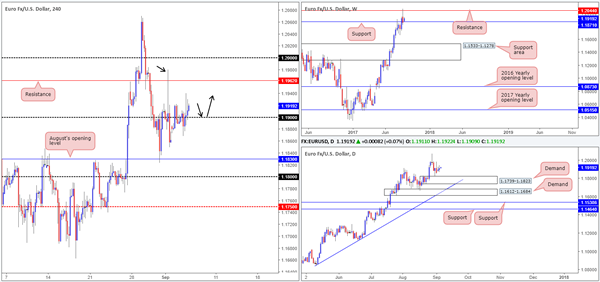
EUR/USD
Across the board, the greenback plummeted on Tuesday following dovish comments from Fed Governor Brainard, consequently forcing the single currency above the 1.19 handle amid early US trading. Technically speaking, this move should have been expected. Weekly action shows price shaking hands with a support level pegged at 1.1871, and daily price recently bounced nicely from demand coming in at 1.1739-1.1823.
As of current price, however, the tide may be changing as the USDX is seen trading from a weekly support at 11854, which boasts strong historical history. Therefore, the EUR may struggle to reach its next upside H4 target: resistance at 1.1962.
Suggestions: Although all three timeframes on the EUR suggest further buying may take place up to at least H4 resistance at 1.1962 (H4 consumption wick marked with a black arrow at 1.1979 shows that offers may be weak here), and quite possibly the large psychological boundary 1.20, we’re still wary due to where price is trading on the USDX!
Given the above factors, we would want to see H4 price retest 1.19 as support (see black arrows) and hold firm in the shape of a full, or near-full-bodied bullish candle, before looking to buy this market and targeting 1.1962/1.20.
Data points to consider: US ISM non-manufacturing PMI at 3pm GMT+1.
Levels to watch/live orders:
- Buys: 1.19 region ([waiting for a reasonably sized H4 bullish candle to form – preferably a full, or near-full-bodied candle – is advised] stop loss: ideally beyond the candle’s tail).
- Sells: Flat (stop loss: N/A).
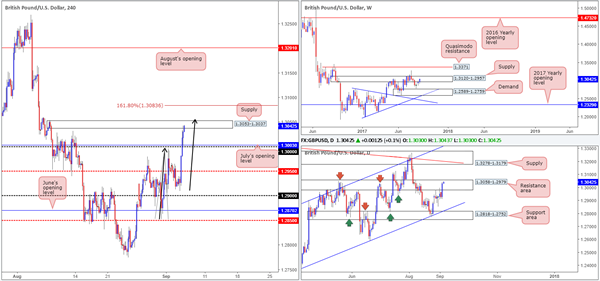
GBP/USD:
A spineless greenback helped GBP bulls find their feet early on in yesterday’s London morning segment. The advance, shaped by a number of strong consecutive H4 bull candles, ran through multiple tech resistances and ended the day kissing the underside of a supply penciled in at 1.3053-1.3037. Despite this, we may see this area faked before sellers step into the fray, since there is a potential AB=CD formation (see black arrows) seen just above at 1.3057.
Looking over to the bigger picture, weekly price remains teasing the underside of a supply base coming in at 1.3120-1.2957. Should the USDX weekly support at 11854 hold ground, this could bolster weekly sellers from the current supply zone and eventually send the unit back down to demand penciled in at 1.2589-1.2759. In conjunction with the weekly timeframe, daily price recently drove high into the walls of a resistance area at 1.3058-1.2979. Given its strong history dating back to mid-May, we feel this zone will likely provide resistance and ultimately push cable down to the support area seen below at 1.2818-1.2752 that converges with a channel support line taken from the low 1.2365.
Suggestions: A short from the H4 AB=CD completion point at 1.3057, with stops planted above its 161.8% Fib ext. level at 1.3083, could be an option today. First take-profit target, for us, would be the 1.30 region.
Data points to consider: US ISM non-manufacturing PMI at 3pm GMT+1.
Levels to watch/live orders:
- Buys: Flat (stop loss: N/A).
- Sells: 1.3057 (stop loss: 1.3086).
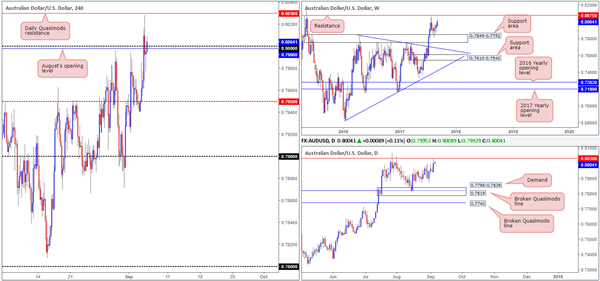
AUD/USD:
Bolstered by a fading US dollar, the commodity currency shifted northbound on Tuesday. The move saw price aggressively break through the 0.80 psychological boundary and come within a few pips of testing a daily Quasimodo resistance level at 0.8030. As of current price, the unit remains above 0.80, despite an earnest attempt from sellers to push lower during the US morning segment.
With 0.80 likely being a sensitive point in this market, let’s see how land lies on the higher timeframes. Since weekly price linked with the support area at 0.7849-0.7752 three weeks ago, the unit has remained reasonably well-bid. The next objective, assuming that price continues to push north, can be seen around resistance drawn from 0.8075. Before weekly action can reach the noted resistance, however, let’s not forget that daily action must first consume the Quasimodo resistance mentioned above at 0.8030.
Suggestions: In light of the above, we would not want to be a seller at 0.80 given the room seen to move higher on the bigger picture. Similarly, we would be uncomfortable buying above 0.80 seeing how close the daily Quasimodo resistance is located. In addition to this, a sell from the daily Quasimodo opens one up to the possibility of being faked up to the weekly resistance at 0.8075. Therefore, the only place of interest right now, in our opinion, is the said weekly resistance level, which happens to stretch as far back as 1997! Whether or not this will turn to be a valid sell zone will depend entirely on how H4 price action responds. Ideally, we’d want a strong bearish candle to form from here in the shape of a full, or near-full-bodied candle.
Data points to consider: Australian growth figures at 2.30am. US ISM non-manufacturing PMI at 3pm GMT+1.
Levels to watch/live orders:
- Buys: Flat (stop loss: N/A).
- Sells: 0.8075 region ([waiting for a reasonably sized H4 bearish candle to form – preferably a full, or near-full-bodied candle – is advised] stop loss: ideally beyond the candle’s wick).
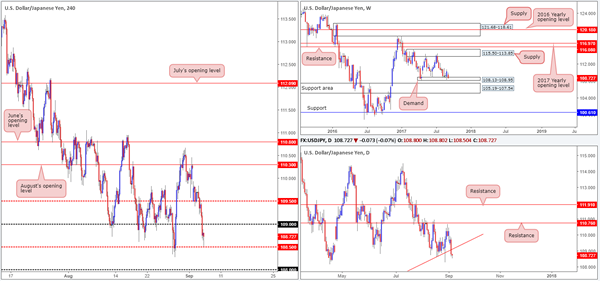
USD/JPY
According to weekly structure, demand at 108.13-108.95 is struggling to hold firm at the moment. A violation of this zone could see the pair sink into a nearby support area fixed at 105.19-107.54. Recent action on the daily timeframe reveals that price crossed below a trendline support extended from the low 100.08, thus further confirming weakness within the said weekly demand area. The story on the H4 timeframe, however, shows that yesterday’s dollar selloff dragged price below the 109 handle and eventually into the jaws of a mid-level support drawn from 108.50.
Suggestions: A buy from 108.50, considering the weakness being seen on the higher timeframes right now, would not be a trade we’d label high probability. Similarly, a short below 108.50 would also be an uncomfortable short, given that price remains within a weekly demand area, although weak looking at this time.
With the above points in mind, our team’s position will remain flat going into today’s sessions.
Data points to consider: US ISM non-manufacturing PMI at 3pm GMT+1.
Levels to watch/live orders:
- Buys: Flat (stop loss: N/A).
- Sells: Flat (stop loss: N/A).
USD/CAD
During the course of yesterday’s sessions, the pair failed to sustain gains above the 1.24 handle and proceeded to drive lower and retest H4 mid-level support at 1.2350/H4 support at 1.2362. Despite a second bounce being seen from this area, the bulls are not registering much intent to push higher.
Last week, weekly price hammered its way through a long-term weekly trendline support extended from the low 0.9633, which, technically speaking, has likely set the stage for further selling this week down to demand penciled in at 1.2127-1.2309. On the other side of the field, nevertheless, daily price remains trading within the walls of a demand area at 1.2303-1.2423 drawn from as far back as June 2015.
Suggestions: To our way of seeing things right now, the bears look to have the upper hand in this market right now, even though daily action is sited within demand.
Preferably, we would love to be sellers in this market given the pair’s underlying trend. However, selling into daily demand and H4 support is just too risky for our liking. In regard to longs, we would not feel comfortable buying this market above 1.24 due to weekly price showing room to drive lower. To that end, the only place of interest is the 1.23 handle due to its location on the higher timeframes (positioned just three pips below daily demand, and sited within the top edge of weekly demand). For us, we would look to place stops below the H4 low @ 1.2276 formed on the 24thJune 2015, and target 1.2350 as an initial take-profit level.
Data points to consider: US ISM non-manufacturing PMI at 3pm. Canadian trade balance at 1.30pm, BOC meeting at 3pm GMT+1.
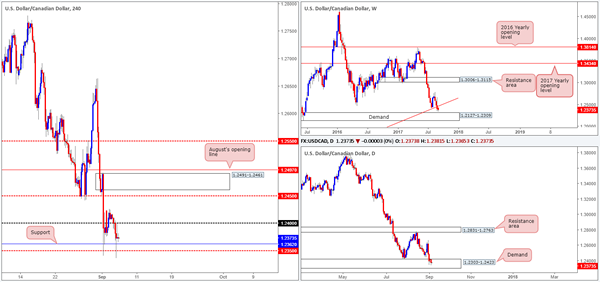
Levels to watch/live orders:
- Buys: 1.23 region (stop loss: 1.2274).
- Sells: Flat (stop loss: N/A).
USD/CHF
Going into the early hours of yesterday’s London segment, the pair continued to retrace after failing to sustain gains beyond the 0.96 mark. The day ended with the unit marginally breaching the lower edge of a H4 demand zone at 0.9538-0.9557, which, as you can probably see, intersects nicely with daily support at 0.9546.
Despite recent developments, this is still a tricky market to trade at the moment. A long from the current demand is unfortunately clouded by nearby resistance: July’s opening level planted at 0.9580, followed closely by the 0.96 line. A close below H4 demand on the other hand opens up downside to 0.95 according to H4 structure. However, price could potentially halt before we reach this barrier seeing as the top edge of the weekly support area is lodged at 0.9515.
Suggestions: Owing to the above notes, there’s very little to hang our hat on at this time. Therefore, remaining on the sidelines and awaiting further developments is the route we’ve chosen to take.
Data points to consider: US ISM non-manufacturing PMI at 3pm GMT+1.
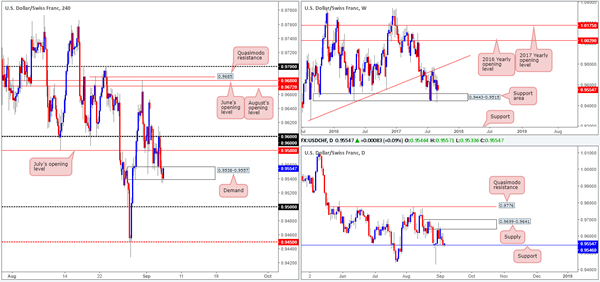
Levels to watch/live orders:
- Buys: Flat (stop loss: N/A).
- Sells: Flat (stop loss: N/A).
DOW 30
August’s opening level at 21913 maintained support for the majority of yesterday’s London segment. It wasn’t until the early hours of US trade did the index turn red and aggressively dive lower. H4 price, as you can see, settled for the day beneath resistance at 21771, potentially opening up the possibility for further selling down to daily support etched out at 21664 (fuses nicely with H4 trendline support taken from the low 21484). Also of particular interest here is the top edge of the weekly demand at 21462-21645 is seen located only a few points below the said daily support.
Our suggestions: Despite the recent moves south, the US equity market is still entrenched within an incredibly strong uptrend. This – coupled with daily support, the top edge of a weekly demand and a H4 trendline support, makes for a nice-looking area to consider buying from (yellow rectangle). For aggressive traders, stops could be placed around the 21633 mark. For conservative traders, however, waiting for H4 price to prove buyer intent exists here in the shape of a full, or near-full-bodied bullish candle, may be the path to take.
Data points to consider: US ISM non-manufacturing PMI at 3pm GMT+1.
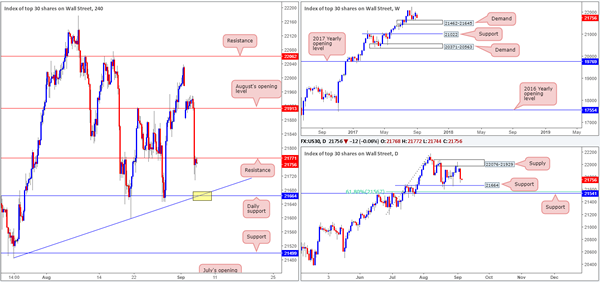
Levels to watch/live orders:
- Buys: 21664 region ([waiting for a reasonably sized H4 bullish candle to form – preferably a full, or near-full-bodied candle – is advised] stop loss: ideally beyond the candle’s tail).
- Sells: Flat (stop loss: N/A).
GOLD
In recent trading, the yellow metal advanced higher following a beautiful to-the-pip retest of H4 support at 1325.9. The move from this line lifted the unit above weekly resistance at 1337.3, but has since formed little bullish intention. In fact, we would say, judging by the H4 candles (bearish wicks), that the bears are now in control for the time being. Therefore, we do not, even though daily price also closed above the weekly resistance level, consider this to be a bullish signal as of yet.
Our suggestions: Let price action unfold. What we mean by this is to wait and see if the H4 candles push back below the weekly resistance level. This, to us, would be considered a bearish signal and one worth trading back down to daily support at 1308.4. Also something you may want to consider is a H4 close beyond H4 support at 1325.9 could be used as a respectable trigger to reduce risk to breakeven.
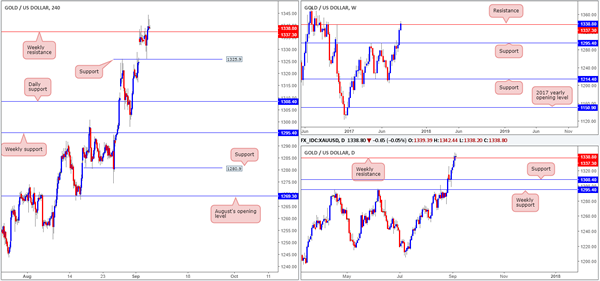
Levels to watch/live orders:
- Buys: Flat (stop loss: N/A).
- Sells: Watch for H4 price to close back below 1337.3 and then consider entering short (stop loss: 1355.9.
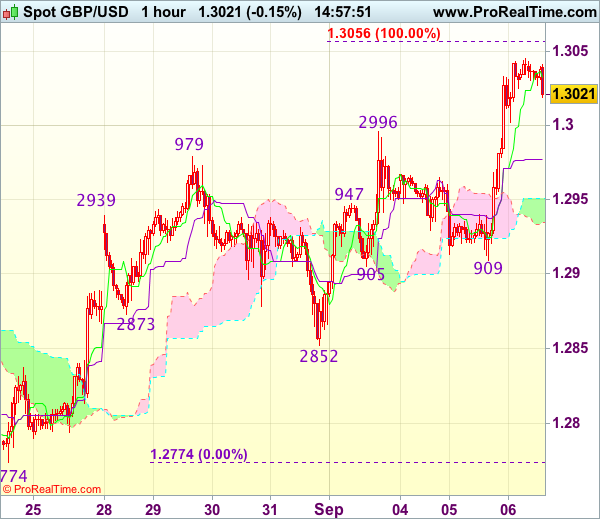
Trade Idea : GBP/USD – Buy at 1.2970
GBP/USD - 1.3026
Most recent candlesticks pattern : N/A
Trend : Near term up
Tenkan-Sen level : 1.3032
Kijun-Sen level : 1.2977
Ichimoku cloud top : 1.2951
Ichimoku cloud bottom : 1.2935
Original strategy :
Buy at 1.2970, Target: 1.3070, Stop: 1.2935
Position : -
Target : -
Stop : -
New strategy :
Buy at 1.2970, Target: 1.3070, Stop: 1.2935
Position : -
Target : -
Stop : -
Yesterday’s rally above previous resistance at 1.3032 confirms recent rise from 1.2774 has resumed and mild upside bias remains for this move to extend further gain to 1.3055-60 (100% projection of 1.2774-1.2979 measuring from 1.2852), then towards 1.3080 (61.8% Fibonacci retracement of 1.3269-1.2774) but near term overbought condition would prevent sharp move beyond 1.3100, risk from there is seen for a retreat to take place later.
In view of this, would not chase this rise here and would be prudent to buy cable on pullback as the Kijun-Sen (now at 1.2977) should limit downside and bring another rise. Below the upper Kumo (now at 1.2951) would defer and risk weakness to the lower Kumo (now at 1.2935) but only break of support at 1.2905-09 would signal top is formed.
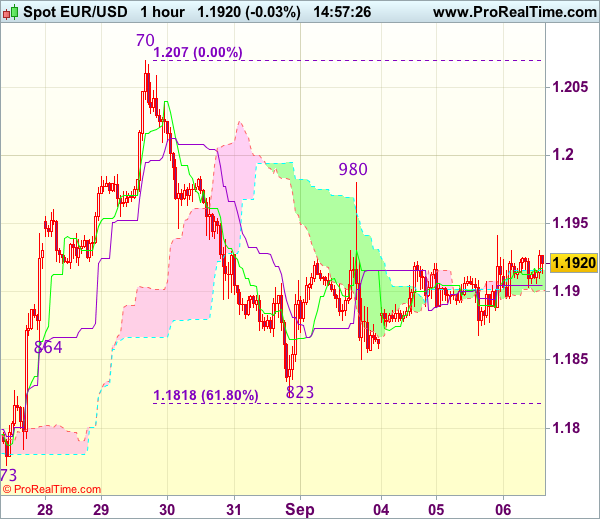
Trade Idea : EUR/USD – Sell at 1.1980
EUR/USD - 1.1926
Most recent candlesticks pattern : N/A
Trend : Up
Tenkan-Sen level : 1.1917
Kijun-Sen level : 1.1905
Ichimoku cloud top : 1.1915
Ichimoku cloud bottom : 1.1900
Original strategy :
Sell at 1.1980, Target: 1.1880, Stop: 1.2015
Position : -
Target : -
Stop : -
New strategy :
Sell at 1.1980, Target: 1.1880, Stop: 1.2015
Position : -
Target : -
Stop : -
Yesterday’s cable-led rebound suggests consolidation with initial upside bias would be seen and gain to 1.1950-55 cannot be ruled out, however, reckon upside would be limited to resistance at 1.1980 and bring another decline later. Below 1.1885-90 would bring weakness to 1.1850, break there would signal the rebound from 1.1823 has ended, then test of this level would follow, break there would add credence to our view that top has been formed at 1.2070 earlier and extend the fall from there to 1.1815-18 (61.8% Fibonacci retracement of 1.1662-1.2070), then 1.1790-00 but downside should be limited to previous support at 1.1773.
In view of this, we are looking to sell euro again on recovery as 1.1980 resistance should limit upside. Only a firm break above said resistance at 1.1980 would abort and signal the fall from 1.2070 has ended at 1.1823, bring further gain to 1.2000 and possibly towards 1.2025-30.
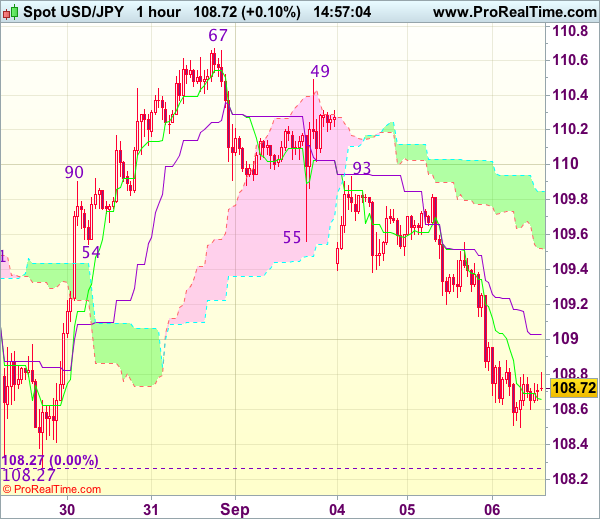
Trade Idea : USD/JPY – Sell at 109.40
USD/JPY - 108.60
Most recent candlesticks pattern : N/A
Trend : Sideways
Tenkan-Sen level : 108.66
Kijun-Sen level : 109.03
Ichimoku cloud top : 109.85
Ichimoku cloud bottom : 109.52
Original strategy :
Sell at 109.40, Target: 108.40, Stop: 109.75
Position : -
Target : -
Stop : -
New strategy :
Sell at 109.40, Target: 108.40, Stop: 109.75
Position : -
Target : -
Stop : -
As dollar has remained under pressure after yesterday’s selloff, adding credence to our view that the fall from 110.67 is still in progress and may extend weakness towards previous support at 108.27, however, break there is needed to retain bearishness and extend the fall from 114.50 to another previous chart support at 108.13, having said that, the greenback needs to penetrate this chart support to confirm early selloff from 118.66 has resumed for subsequent weakness to 107.70-75 which is likely to hold from here.
In view of this, we are looking to sell dollar on recovery as 109.40-50 should limit upside and bring another decline later. Above 109.80-83 would abort and signal an intra-day low is formed instead, bring a stronger rebound to 110.00-05 but price should falter well below resistance at 110.49.
European Open Briefing: Asian Equity Markets Declined On Wednesday
Global Markets:
- Asian stock markets: Nikkei lost 0.15 %, Shanghai Composite down 0.04 %, Hang Seng down 0.86 %, ASX 200 fell 0.45 %
- Commodities: Gold at $1343.91 (-0.05 %), Silver at $17.98 (+0.21 %), WTI Oil at $48.59 (-0.14 %), Brent Oil at $53.20 (-0.36%)
- Rates: US 10-year yield at 2.07, UK 10-year yield at 1.01, German 10-year yield at 0.32
News & Data:
- AUD GDF q/q 0.8 % vs 0.8 % expected
- JPY Average Cash Earnings -0.3 % vs 0.5 % expected
- CHF CPI m/m 0.0 % vs -0.3 % previous
- GBP Services PMI 53.2 vs 53.5 expected
- USD Factory Orders m/m -3.3 % vs 0.3 % expected
- NZD GDT Price Index 0.3 % vs 0.3 % expected
- Fed policymakers signal caution on inflation, rate hikes- RTRS
Markets Update:
Asian equity markets declined on Wednesday, following the fall on wall street. Overnight the U.S. stocks slipped while Treasuries rallied the most in 10 months as tensions with North Korea mounted and another Atlantic hurricane threatened to make landfall.
USDJPY was seen trading down around 108.50 in pre-Tokyo session as the US Dollar continued to lose against the Yen. The dollar lost 0.9 percent overnight, its biggest one-day drop in three months. But as Tokyo became more active it recovered to 108.80 and is mid-range at the moment trading around 180,70. The Average Cash earnings had slid down to -0.3 % from 0.4 %.
EURUSD is currently seen trading at 1.1914 as the Euro increased 0.2 percent against the US Dollar. The dollar suffered after Federal Reserve Governor Lael Brainard said on Tuesday inflation was “well short” of targetThe dollar index, which tracks the dollar against a basket of currencies, was little changed at 92.32
AUDUSD rallied higher early on Wednesday reaching highs of around 0.8020 ahead of the GDP release, however the Aussie lost most of it gains and fell to trade below 0.8 after the release of GDP data and is currently seen trading around 0.7990. NZDUSD followed a similar patter, the kiwi was seen trading higher reaching highs of 0.7260 early in its morning and then turning lower currently seen trading below 0.7230 against the US Dollar.
Upcoming Events:
- 12:30 GMT – (CAD) Trade Balance
- 12:30 GMT – (CAD) Labor Productivity q/q
- 12:30 GMT – (USD) Trade Balance
- 14:00 GMT – (CAD) BOC Rate Statement
- 14:00 GMT – (CAD) Overnight Rate
- 14:00 GMT – (USD) ISM Non-Manufacturing PMI