Sample Category Title
EUR/CHF Daily Outlook
Daily Pivots: (S1) 1.1357; (P) 1.1388; (R1) 1.1411; More...
EUR/CHF is still bounded in consolidation from 1.1537 and intraday bias remains neutral. On the upside, break of 1.1537 resistance will confirm resumption of larger rally from 1.0629. In that case, EUR/CHF should target 1.2 key resistance level next. On the downside, firm break of 38.2% retracement of 1.0830 to 1.1537 at 1.1267 will extend the correction to 61.8% retracement at 1.1100 before completion.
In the bigger picture, long term rise from SNB spike low back in 2015 is still in progress. EUR/CHF should now be heading back to prior SNB imposed floor at 1.2000. For now, this will be the favored case as long as 1.1087 resistance turned support holds.
AUD/USD Bullish Pause
AUD/USD continue to trend above rising trendline. Hourly support can be found at 0.7946 (05/09/2017 low). Strong resistance is given at 0.8066 (27/07/2017 high). Expected to further consolidate.
In the long-term, the trend is largely negative since 2011. Key supports stands at 0.6009 (31/10/2008 low) . A break of the key resistance at 0.8295 (15/01/2015 high) is needed to invalidate our long-term bearish view.
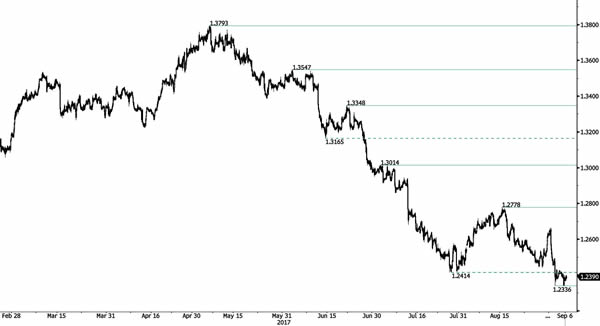
USD/CAD Bounce Is Weak
USD/CAD recovery bounce is failing to find momentum. Hourly support is located at 1.2336 (intraday low). Resistance is now given at a distance at 1.2778 (15/08/2017 low). Expected to show continued short-term bearish pressures if resistance at 1.2778 holds.
In the longer term, the pair has broken longterm support that can be found at 1.2461 (16/03/2015 low). Strong resistance is given at 1.4690 (22/01/2016 high). The pair is likely to head further lower.
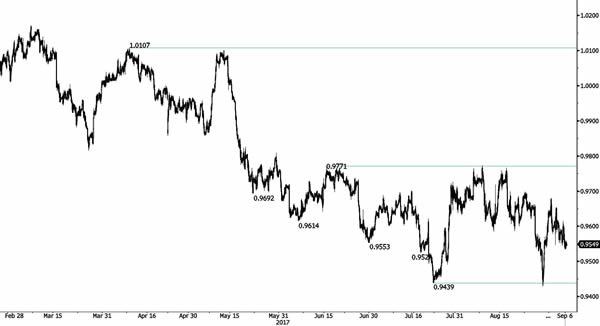
USD/CHF No Pickup In Buying Interest Thus Far
USD/CHF has broken the key support area between 0.9600 and 0.9570 confirming persistent selling pressures. Strong resistance is given at 0.9771 (15/06/2017 high). The pair is likely to head further lower below 0.9500. Expected to show renewed bearish pressures.
In the long-term, the pair is still trading in range since 2011 despite some turmoil when the SNB unpegged the CHF. Key support can be found 0.8986 (30/01/2015 low). The technical structure favours nonetheless a long term bullish bias since the unpeg in January 2015
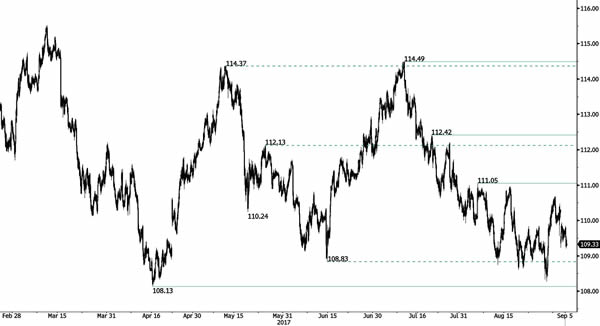
USD/JPY Weakening
USD/JPY demand runs into solid selling pressure. The pair has failed to test resistance at 111.05 (04/08/2017 high). Support is located at 108.13 (14/06/2017 low). Expected to show further downside pressures.
We favor a long-term bearish bias. Support is now given at 99.02 (10/08/2013 low). A gradual rise towards the major resistance at 125.86 (05/06/2015 high) seems unlikely. Expected to decline further support at 93.79 (13/06/2013 low).
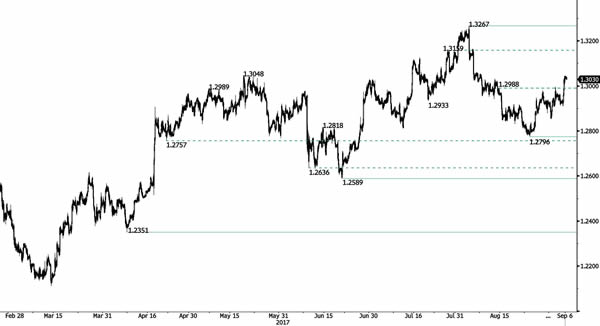
GBP/USD Strong Bounce
GBP/USD surged higher clearing resistance at 1.2988 / 95 (01/09/2017). Hourly support is given at 1.2774 (24/08/2017 high) while hourly resistance is given at 1.3050 (07/08/2017 high). Expected to show short-term bullish pressures.
The long-term technical pattern is even more negative since the Brexit vote has paved the way for further decline. Long-term support can be found at 1.1841 (07/10/2017 low). Long-term resistance is given around 1.35 and would indicate a long-term reversal in the negative trend. Yet, it is very unlikely at the moment.
EUR/USD Drifting Higher
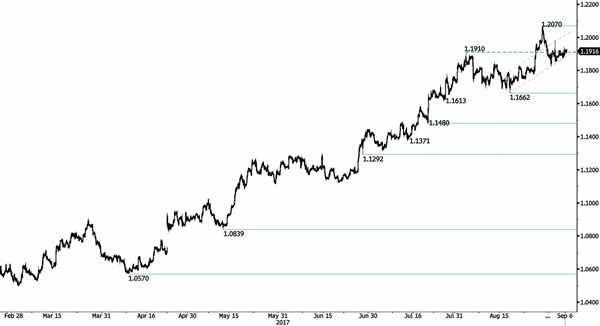
EURUSD is consolidating after massive bullish rally around the 1.1916 level. Hourly resistance can be found at 1.2070 (29/08/2017 high) while hourly support lies at 1.1820 (31/08/2017 low). Stronger support is given at a distance at 1.1662 (17/08/2017 low). Expected to show renewed bullish pressures.
In the longer term, the momentum is now turning largely positive. We favour a continued bullish bias. Key resistance is holding at 1.2252 (25/12/2014 high) while strong support lies at 1.0341 (03/01/2017 low).
Forex Technical Analysis: EUR/USD, USD/JPY, GBP/USD
EUR/USD
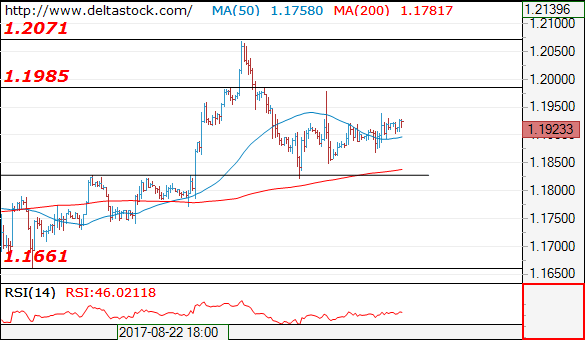
Current level - 1.1923
The intraday bias is slightly positive, for a test of 1.1985 resistance area and the latter is expected to cap the upside, for another leg downwards, to 1.1830. A violation of the latter will challenge 1.1660.
| Resistance | Support | ||
| intraday | intraweek | intraday | intraweek |
|
1.1980 |
1.2070 |
1.1830 |
1.1830 |
|
1.2070 |
1.2160 |
1.1740 |
1.1660 |
USD/JPY
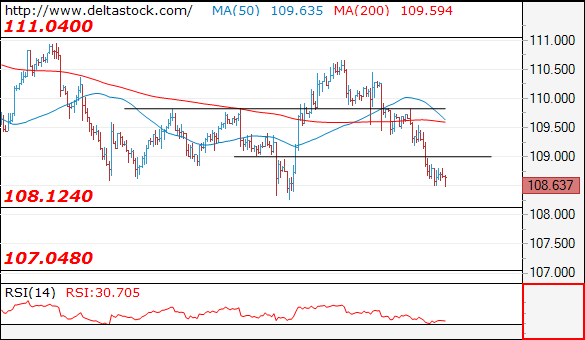
Current level - 108.63
The bias is negative, for a test of 108.10 lows and I favor a break through that area to target 107.00 area. Initial intraday resistance lies at 109.00-10.
| Resistance | Support | ||
| intraday | intraweek | intraday | intraweek |
|
109.10 |
111.00 |
108.10 |
108.10 |
|
110.60 |
112.20 |
108.10 |
107.00 |
GBP/USD
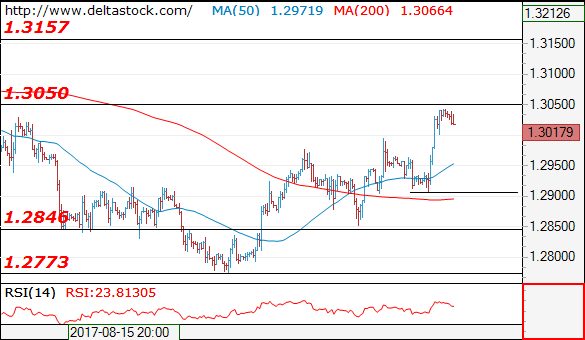
Current level - 1.3017
Yesterday's reversal at 1.2907 has started a rise, which is currently testing 1.3050 resistance. My outlook is positive above 1.2990, for a break through 1.3050, towards 1.3150 area. On the senior frames the whole rebound after 1.2770 seems corrective, so pay attention to the key low at 1.2907, as a break there will trigger a sell-off towards last month's low.
| Resistance | Support | ||
| intraday | intraweek | intraday | intraweek |
|
1.3050 |
1.3157 |
1.2990 |
1.2773 |
|
1.3157 |
1.3260 |
1.2907 |
1.2606 |
EUR/CHF Elliott Wave Analysis
EUR/CHF : 1.1393
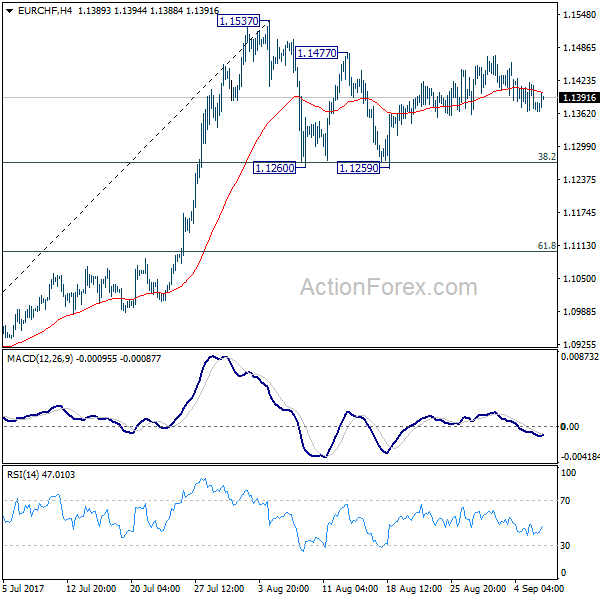
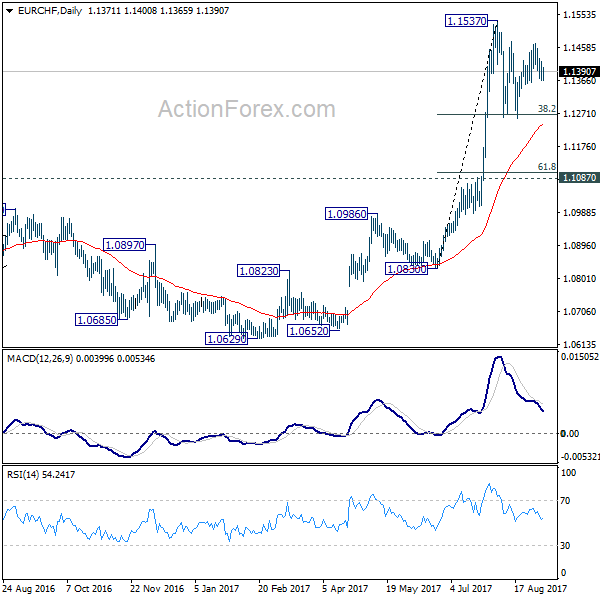
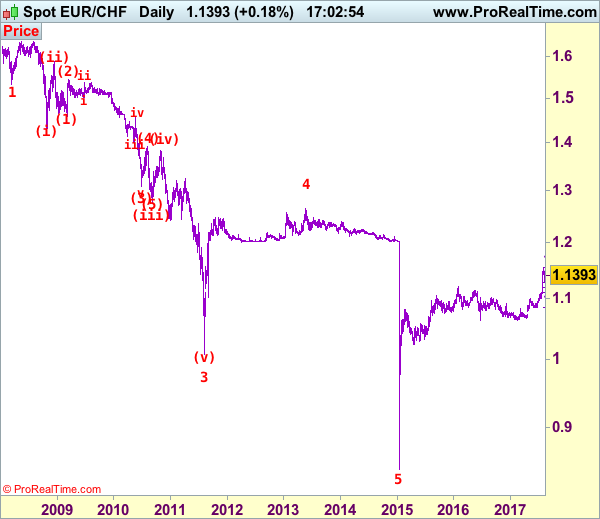
As the single currency has retreated after faltering below indicated previous resistance at 1.1479, retaining our view that further sideways trading would be seen and risk of initial weakness to 1.1320-30 cannot be ruled out, however, reckon 1.1290-00 would hold and bring another rebound later. A break of said resistance at 1.1479 would add credence to our view that the correction from 1.1538 (i.e. wave iv) has ended at 1.1259, then a retest of this recent high would follow. Looking ahead, a break of this resistance at 1.1538 (wave iii top) is needed to confirm upmove has resumed in wave v to 1.1600, then towards 1.1700-10.
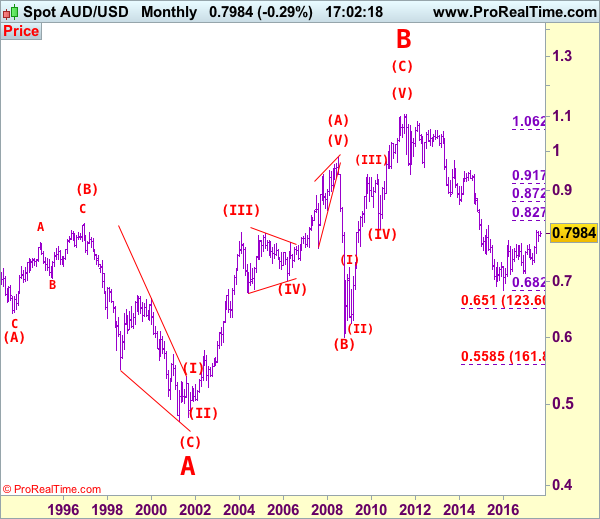
To recap our preferred count, the decline from 1.6828 (end wave (B)) is labeled as the beginning of wave (C) which should unfold as an impulsive move with 1: 1.5326, 2: 1.6377 and wave 3 is sub-divided into (i): 1.4300, (ii): 1.5880 and wave (iii) is still unfolding with (1): 1.4577, (2): 1.5448 and wave (3) is an extended 3rd with i: 1.5006, ii: 1.5383, wave iii: 1.3073, then wave iv ended at 1.3925 and wave v at 1.3073, wave (4) ended at 1.3925 and wave (5) has ended at 1.2765 which also marked the low of wave (iii) and wave (iv) has ended at 1.3835 and wave (v) as well as larger degree wave 3 has ended at 1.0075. The selloff from 1.2650 signals wave 4 has ended there and we are taking a view that the wave 5 could also have ended 0.8426, hence consolidation is seen with mild upside bias for rebound to 1.1400 (already met), then towards 1.1600.
On the downside, whilst initial pullback to 1.1355-60 is likely, reckon 1.1320-30 would limit downside and bring another rise later. Below said support at 1.1259 would defer and signal the wave iv correction is still in progress (probably a complex one), bring retracement of recent upmove to 1.1185-90 (50% Fibonacci retracement of 1.0833-1.1538), however, reckon downside would be limited to 1.1100-05 (61.8% Fibonacci retracement of 1.0833-1.1538), bring upmove in wave v later (probably in late Q3). Only a drop below previous resistance at 1.0988 (wave i top) would abort and signal recent upmove has ended, bring correction to 1.0950, then 1.0900 but support at 1.0833 should remain intact.
Recommendation: Buy again at 1.1330 for 1.1530 with stop below 1.1230.
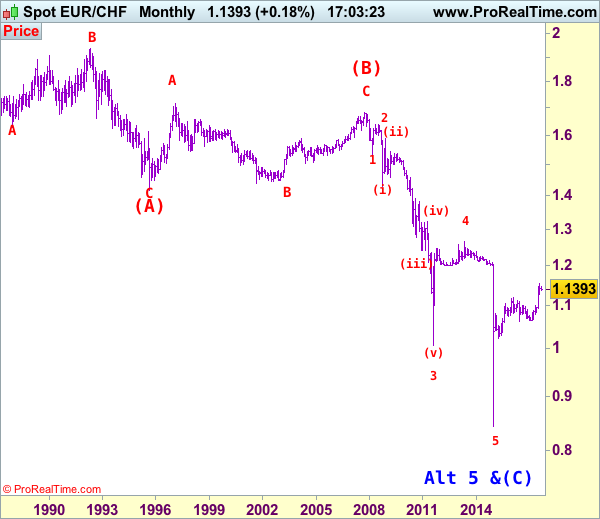
The long-term downtrend started from 1.9626 (Apr 1985) to 1.4166 (Sep 1995) is treated as wave (A) with A:1.6285 (Dec 1987), B: 1.9342 (May 1992) and C: 1.4166, then wave (B) ended at 1.6828 with A: 1.7147 (Feb 1997), B: 1.4398 (Sep 2001), C: 1.6828 (Nov 2007), therefore, wave (C) is now in progress with the breakdown indicated as above. This wave (C) already met indicated downside target at 1.1455/60 and 1.1300, it could have ended at 0.8426, consolidation with mild upside bias is seen for gain to 1.1000 and later towards 1.2000.
AUD/USD Elliott Wave Analysis
AUD/USD – 0.7985
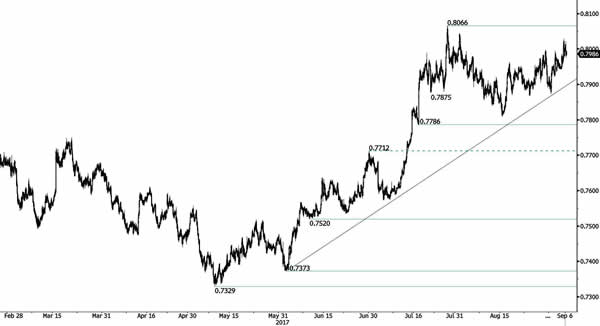
Although aussie slipped initially last week to 0.7871, as renewed buying interest emerged there and the pair has risen again, retaining our bullish view that pullback from 0.8066 has ended at 0.7808 last month and upside bias remains for further gain to 0.8040-45, however, break of said recent high at 0.8066 is needed to confirm medium term erratic rise from 0.6827 (2016 low) has resumed and extend gain to 0.8100, then towards previous resistance at 0.8163.
We are keeping our count that top has been formed at 1.1081 (wave 5 of V) and major correction (A-B-C-X-A-B-C) has commenced, indicated downside targets at 0.7945 (61.8% Fibonacci retracement of entire rise from 0.6007-1.1081) and 0.7750 had been met and downside bias is seen for further weakness to 0.6800, then 0.6700 but reckon 0.6500 would hold from here.
Our preferred count is that the rally from 0.6007 to 0.7270 (7 Jan 2009) is marked as wave A, the retreat to 0.6248 (2 Feb 2009) is wave B and the subsequent upmove is labeled as wave C with wave (iii) and wave (iv) ended at 0.8265 and 0.7700 respectively and wave (v) as well as 3 ended at 0.9407, then wave 4 ended at 0.8066 (instead of 0.8578). The wave 5 has met our indicated projection target of 1.1060 and could ended at 1.1081, this level is now treated as the peak of wave (C) as well as larger degree wave B, hence major fall in wave C has commenced, our initial downside target at psychological support at 0.7000 has just been met and further weakness to 0.6500 would be seen later.
On the downside, expect pullback to be limited and 0.7920-25 should hold, bring another rise later. Below 0.7920 would risk another test of said last week’s low at 0.7871 but break there is needed to signal the rebound from 0.7808 has ended, bring another fall towards this level. A break below there would shift risk back to downside for the corrective decline from 0.8066 top to bring retracement of early upmove to 0.7760 (61.8% Fibonacci retracement of 0.7571-0.8066) and then test of previous resistance at 0.7712 but reckon downside would be limited to 0.7640-50.
Recommendation: Hold long entered at 0.7920 for 0.8120 with stop below 0.7920.
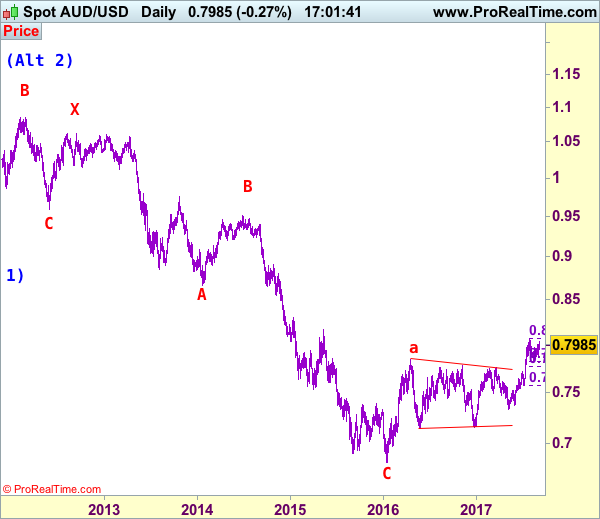
Our alternate count on the daily chart treated the top formed in 2008 at 0.9851 could be a larger degree wave I and was followed by a deep and sharp correction in wave II to 0.6007 and wave III is unfolding from there.
The long-term uptrend started from 0.4775 (2 Apr 2001) with an impulsive structure. Wave I is labeled as 0.4775 to 0.9851 (15 Jul 2008), wave II has ended at 0.6007 (Oct 2008) and wave III is still in progress which may extend further gain to 1.1265.