Sample Category Title
Trade Idea: USD/CAD – Hold short entered at 1.2690
USD/CAD - 1.2590
Trend: Down
Original strategy :
Sold at 1.2690, Target: 1.2490, Stop: 1.2610
Position: - Short at 1.2690
Target: - 1.2490
Stop: - 1.2610
New strategy :
Hold short entered at 1.2690, Target: 1.2490, Stop: 1.2610
Position: - Short at 1.2690
Target: - 1.2490
Stop:- 1.2610
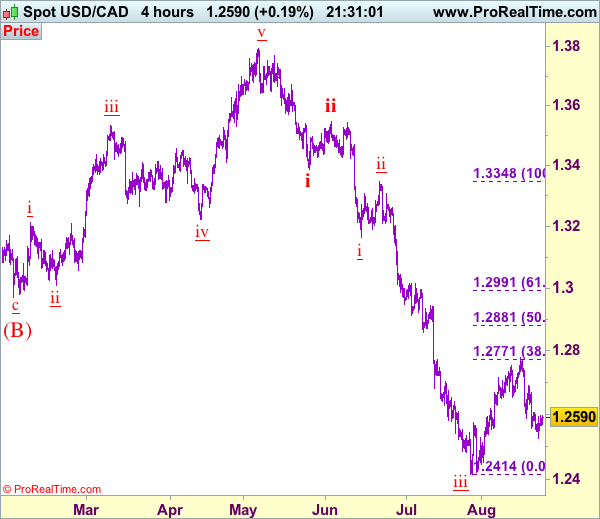
As the greenback has rebounded after falling to 1.2525 yesterday, suggesting minor consolidation above this level would be seen, however, as long as 1.2605-10 holds, bearishness remains for the fall from 1.2778 top to extend weakness to 1.2490-00 but a sustained breach below there is needed to signal the wave iv correction from 1.2414 (wave iii trough) has ended at 1.2778, bring further fall towards support at 1.2451 which is likely to hold on first testing. We are keeping our count that wave v as well as wave (C) ended at 1.3794 and impulsive wave (i ii, i ii) is now unfolding with minor wave iii possibly ended at 1.2414, hence wave iv correction is underway.
In view of this, we are holding on to our short position entered at 1.2690. Only above 1.2691 resistance would risk a stronger rebound to 1.2740-50, however, said resistance at 1.2778 should hold. Only break of said resistance at 1.2778 would abort and signal the rebound from 1.2414 is still in progress for retracement of recent decline to 1.2825-30 but still reckon upside would be limited to 1.2880-85 (50% Fibonacci retracement of wave iii) and price should falter well below 1.2990-95 (61.8% Fibonacci retracement), bring retreat later.
To recap, wave B from 1.3066 is unfolding as an a-b-c and is sub-divided as a: 1.2192, b: 1.2716 and wave c is a 5-waver with i: 1.1983, ii: 1.2506, extended wave iii with minor iii at 1.0206, wave iv ended at 1.0781 and wave v as well as wave iii has ended at 0.9931, hence the subsequent choppy trading is the wave iv which is unfolding as (a)-(b)-(c) with (a) leg of iv ended at 1.0854, followed by (b) leg at 1.0108 and (c) leg as well as the wave iv ended at 1.0674. The wave v is sub-divided by minor wave (i): 0.9980, (ii): 1.0374, (iii): 0.9446, (iv): 0.9913 and (v) as well as v has possibly ended at 0.9407, therefore, consolidation with upside bias is seen for major correction, indicated target at 1.3700 and 1.4000 had been met and further gain to 1.4700 would be seen later.
GBP/JPY Mid-Day Outlook
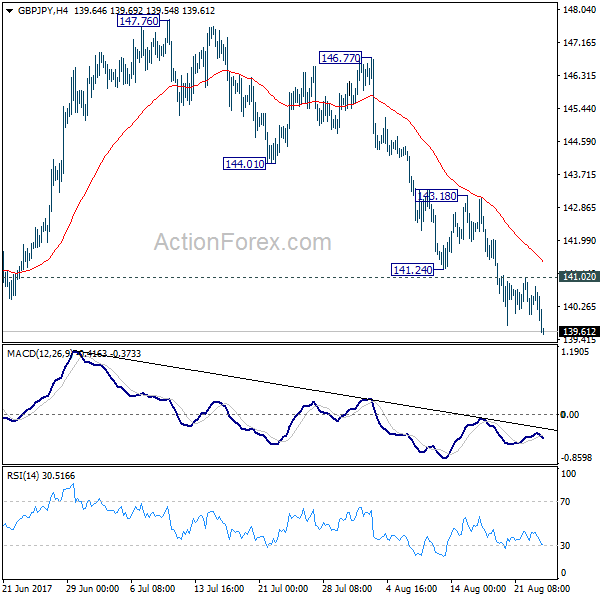
Daily Pivots: (S1) 140.00; (P) 140.51; (R1) 140.98; More
GBP/JPY's fall continues today and reaches as low as 139.58 so far. Intraday bias remains on the downside for 138.65 support. Break there will extend the fall from 147.76 towards 135.58 key support level. At this point, price actions from 148.42 are seen as a sideway consolidation pattern. Hence, we'll expect strong support from 135.58 to contain downside and bring rebound. On the upside, above 141.02 minor resistance will turn intraday bias neutral first.
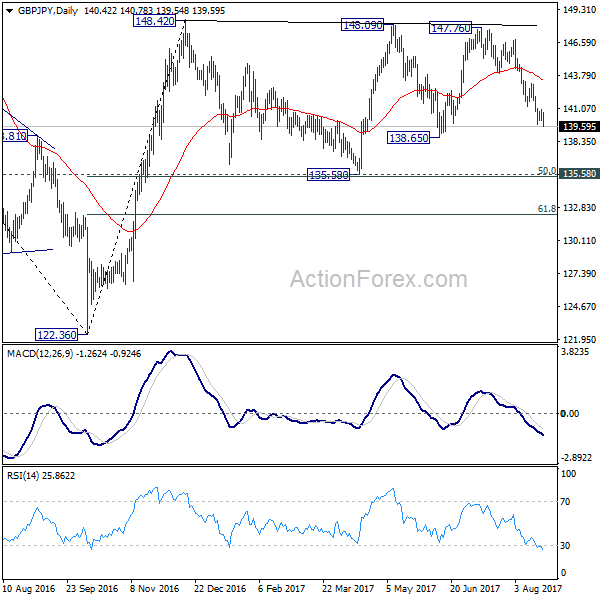
In the bigger picture, the sideway pattern from 148.42 is extending with another leg. We'd expect strong support from 135.58 and 50% retracement of 122.36 to 148.42 at 135.39 to contain downside. Medium term rise from 122.36 is still expected to resume later. And break of 38.2% retracement of 196.85 to 122.36 at 150.43 will carry long term bullish implications. However, firm break of 135.58/39 will dampen the bullish view and turn focus back to 122.36 low.
EUR/USD Mid-Day Outlook
Daily Pivots: (S1) 1.1729; (P) 1.1776 (R1) 1.1809; More...
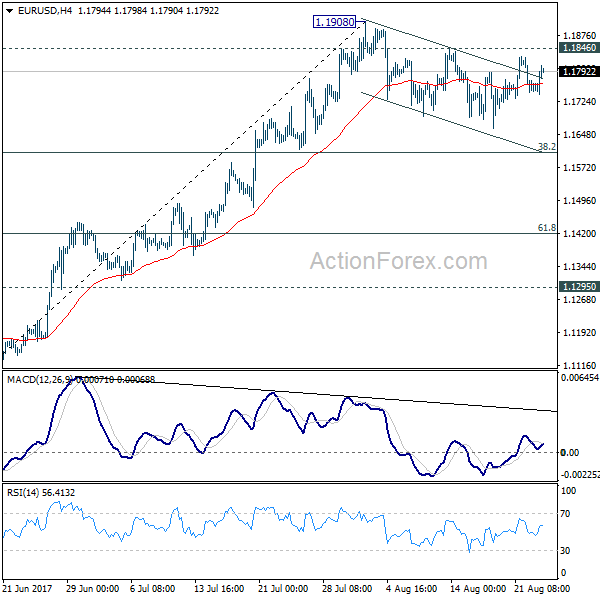
Intraday bias in EUR/USD remains neutral as the consolidation from 1.1908 might extend. In case of deeper fall, downside should be contained by 38.2% retracement of 1.1119 to 1.1908 at 1.1606 to bring up trend resumption. Break of 1.1846 minor resistance will argue that larger rise from 1.0339 is resuming for 1.2042 long term support turned resistance next.
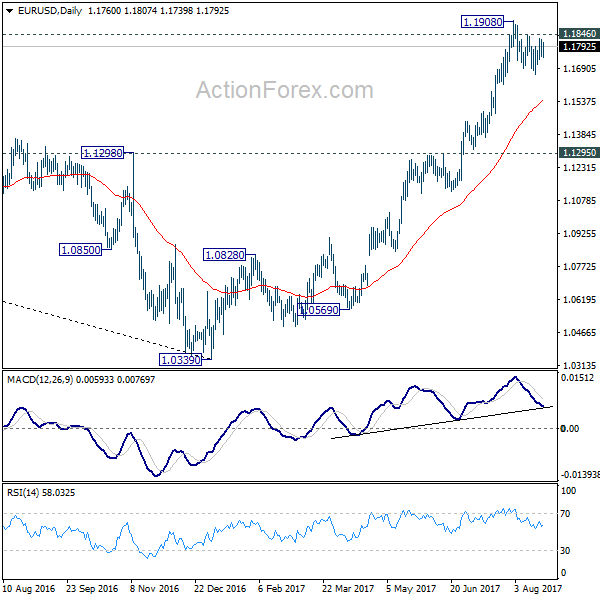
In the bigger picture, an important bottom was formed at 1.0339 on bullish convergence condition in weekly MACD. Sustained trading above 55 month EMA (now at 1.1768) will pave the way to key fibonacci level at 38.2% retracement of 1.6039 (2008 high) to 1.0339 (2017 low) at 1.2516. While rise from 1.0339 is strong, there is no confirmation that it's developing into a long term up trend yet. Hence, we'll be cautious on strong resistance from 1.2516 to limit upside. But for now, medium term outlook will remain bullish as long as 1.1295 support holds, in case of pull back.
GBP/USD Mid-Day Outlook
Daily Pivots: (S1) 1.2785; (P) 1.2847; (R1) 1.2883; More...
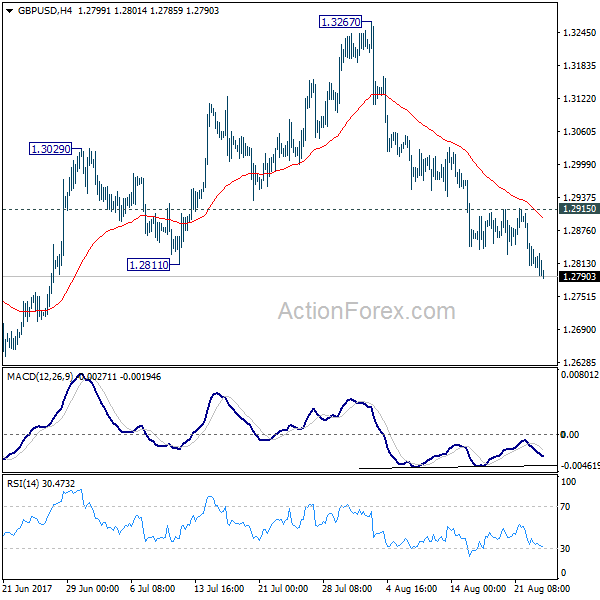
GBP/USD's decline from 1.3267 continues today and intraday bias remains on the downside for 1.2588 key near term support. As noted before, we're favoring the case that correction from 1.1946 is completed at 1.3267. Decisive break of 1.2588 will confirm our view and target a test on 1.1946 low. On the upside, break of 1.2952 resistance is needed to indicate short term bottoming. Otherwise, outlook will stay cautiously bearish in case of recovery.
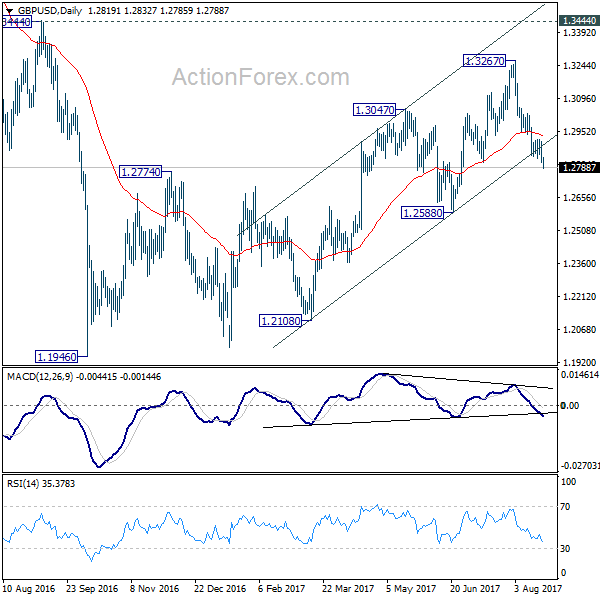
In the bigger picture, overall, price actions from 1.1946 medium term low are seen as a corrective pattern. While further rise cannot be ruled out, larger outlook remains bearish as long as 1.3444 key resistance holds. Down trend from 1.7190 (2014 high) is expected to resume later after the correction completes. And break of 1.2588 will indicate that such down trend is resuming.
USD/CHF Mid-Day Outlook
Daily Pivots: (S1) 0.9630; (P) 0.9659; (R1) 0.9711; More....
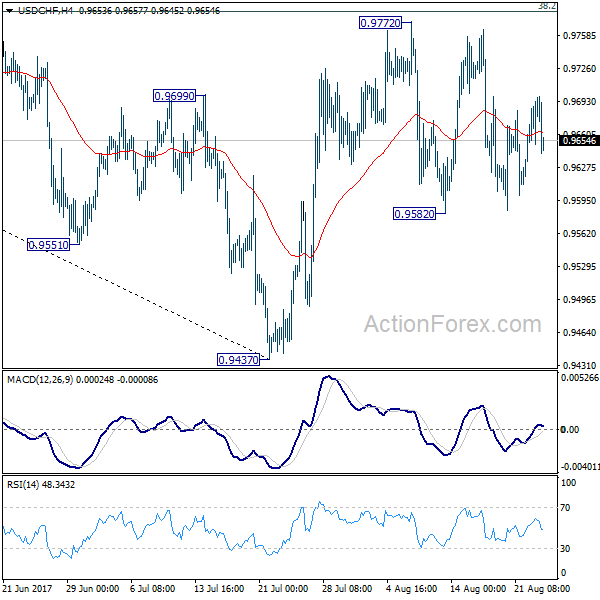
Intraday bias in USD/CHF remains neutral as it's bounded in range of 0.9582/9772. On the upside, decisive break of 0.9772 resistance will revive the bullish case of reversal. That is, whole decline from 1.0342 has completed at 0.9437 after defending 0.9443 support. USD/CHF should then target channel resistance (now at 0.9862) next. Meanwhile, the pair is bounded inside medium term falling channel and limited below 38.2% retracement of 1.0342 to 0.9437 at 0.9783 for the moment. Break of 0.9582 will turn bias back to the downside for 0.9437. This could also extend the fall from 1.0342 through 0.9437/43 key support level.
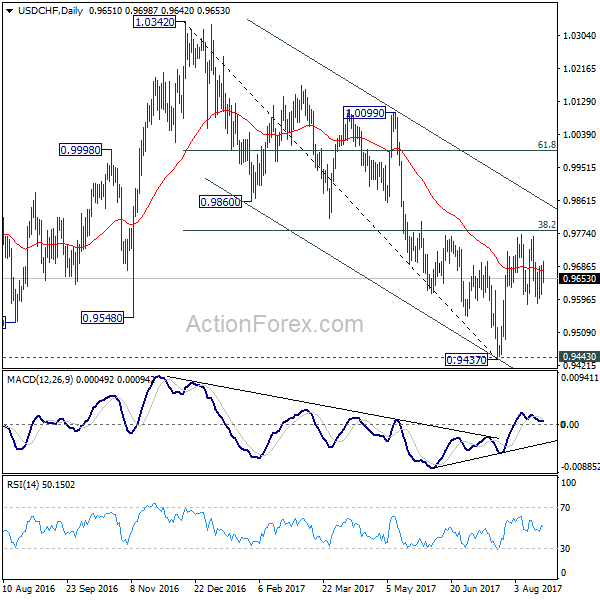
In the bigger picture, we're slightly favoring the case that USD/CHF has successfully defended 0.9443 key support level. And long term range trading in 0.9443/1.0342 is extending with another rise. At this point, there is no sign of an up trend yet. Hence, while further rise is expected in USD/CHF, we'll start to be cautious on loss of momentum above 61.8% retracement of 1.0342 to 0.9437 at 0.9996. However, firm break of 0.9443 will carry larger bearish implication and would target next key support at 0.9072.
USD/JPY Mid-Day Outlook
Daily Pivots: (S1) 109.04; (P) 109.35; (R1) 109.85; More...
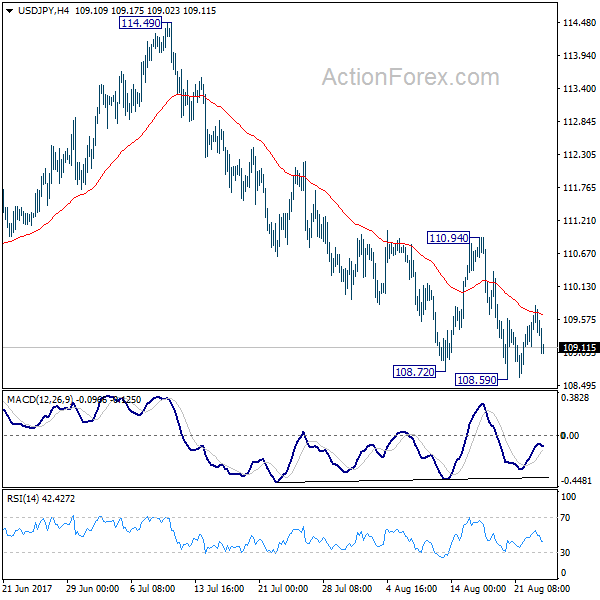
USD/JPY dips after being rejected by 4 hour 55 EMA but stays above 108.59 temporary low. Intraday bias remains neutral and more consolidation could be seen. But near term outlook stays bearish with 110.94 resistance intact and deeper decline is expected. Break of 108.59 will target a test on 108.12 low. Whole corrective decline from 118.65 is possibly resuming and break of 108.12 will target 61.8% retracement of 98.97 to 118.65 at 106.48. Nonetheless, firm break of 110.94 will indicate short term bottoming and turn bias back to the upside.
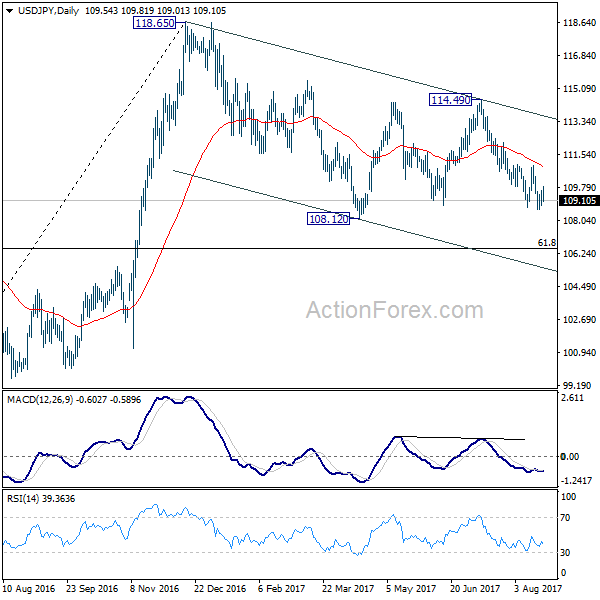
In the bigger picture, the corrective structure of the fall from 118.65 suggests that rise from 98.97 is not completed yet. Break of 118.65 will target a test on 125.85 high. At this point, it's uncertain whether rise from 98.97 is resuming the long term up trend from 75.56, or it's a leg in the consolidation from 125.85. Hence, we'll be cautious on topping as it approaches 125.85. If fall from 118.65 extends lower, downside should be contained by 61.8% retracement of 98.97 to 118.65 at 106.48 and bring rebound.
Markets Brace as Jackson Hole Looms
Financial markets offered a muted response towards Mario Draghi's speech in Germany on Wednesday. Investors who were expecting fireworks left disappointed after the ECB chief maintained a safe distance from market-sensitive remarks.
While Draghi defended QE and stated that unconventional monetary policy was a success, the scant details on the ECB's quantitative easing exit strategy simply left market players empty handed. Although Euro bulls eventually found support in the form of strong Eurozone PMI reports, the threat of Draghi verbally intervening to weaken the currency at Jackson Hole is likely to limit the upside. With July's ECB meeting minute's already revealing concerns over how a resurgent Euro is obstructing the central bank's efforts to hit the 2% inflation target, Draghi's speech on Friday will be in sharp focus.
From a technical standpoint, the EURUSD remains bullish on the daily charts, as there have been consistently higher highs and higher lows. Prices are trading firmly above the 50 Simple Moving Average, while the MACD points to the upside. A breakout and daily close above 1.1830 should encourage a further move higher towards 1.1900. In an alternative scenario, sustained weakness below 1.1700 should encourage a further depreciation towards 1.1660 and 1.1600 respectively.
It's all about the Jackson Hole Symposium
A sense of anticipation can be felt across the financial markets ahead of the Jackson Hole Symposium later this week, which could offer an opportunity for central banks to signal policy shifts. Financial heavyweights such as Mario Draghi and Janet Yellen will be in the spotlight, with markets closely scrutinizing their speeches for fresh insight on the outlook for monetary policy and interest rates.
Although there have been reports that Draghi will not deliver a new policy message at the conference, this does not rule out the possibility of verbal intervention to weaken the Euro. While Federal Reserve Chair Janet Yellen will be speaking on financial stability, investors will most likely comb through the speech for further clues on when the Fed plans to unwind its balance sheet and raise rates.
If Draghi or Yellen surprise investors by announcing new policy messages, financial markets may experience explosive levels of volatility, which should jolt them from their summer lull.
NZD/USD On The Way Down
NZD/USD plunged aggressively today and resumed the yesterday's bearish candle. Technically should drop much deeper on the short term, but was stopped by a strong confluence area. Price dropped significantly even if the USDX failed to stay higher and now is trading in the red. USDX failed once again to stay above the 93.50 psychological level and now is going down again.
The dollar index is moving sideways, but remains to see if this is an accumulation or a distribution movement. A further USDX's drop will send the greenback much lower versus its rivals. USD could receive support from the US New Home Sales, which is expected to increase from 610K to 611K. The Flash Services PMI and the Flash Manufacturing PMI could increase will be released as well.
Price dropped through the confluence area formed at the intersection between the red downtrend line with the minor red uptrend line. A valid breakdown below this confluence area will accelerate the sell-off and will validate the Head and Shoulders pattern.
Technically was expected to drop further after the retest of the fourth warning line (wl4) of the former ascending pitchfork. NZD/USD should drop more than 300 pips if the Head and Shoulders pattern will be confirmed. However, a false breakdown below the mentioned confluence area will send the rate towards the third warning line (WL3) of the former descending pitchfork.
USD/JPY Further Drop Expected
Price drops after the retest of the 50% retracement level, the first warning line (wl1) and the minor red uptrend line. Technically is expected to drop much deeper on the short term as the Nikkei stock index is trading in the red and looks poised to resume the downside movement. Only a Nikkei's failure to close below the 19336 level will signal a Yen's exhaustion.
EUR/CHF Is The Rebound Completed
Price increased sharply in the first part of the day, but has found strong resistance at the red downtrend line. Has also failed to stabilize above the WL2 and now could drop towards the upper median line (uml) again.
Only a breakout above the mentioned resistance levels and above the WL4 will confirm a further increase, but this scenario is less likely to happen because the behavior has changed (lower highs).