
Sample Category Title
USD/CHF Daily Outlook
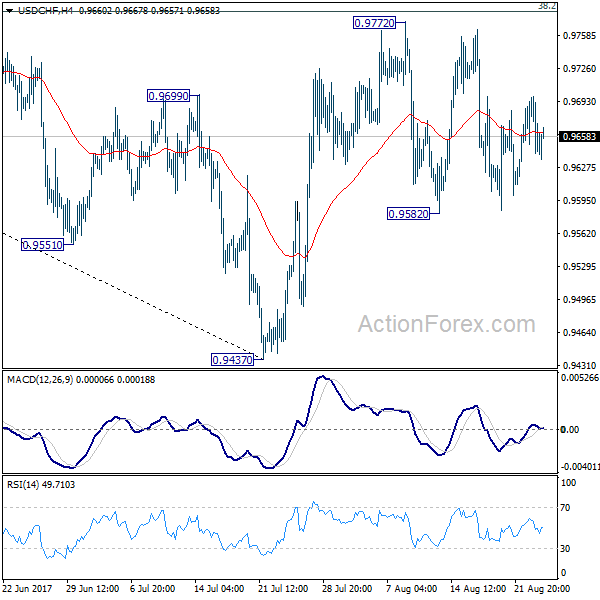
Daily Pivots: (S1) 0.9632; (P) 0.9664; (R1) 0.9688; More....
No change in USD/CHF's outlook as it's bounded in range of 0.9582/9772. Intraday bias remains neutral at this moment. On the upside, decisive break of 0.9772 resistance will revive the bullish case of reversal. That is, whole decline from 1.0342 has completed at 0.9437 after defending 0.9443 support. USD/CHF should then target channel resistance (now at 0.9849) next. Meanwhile, the pair is bounded inside medium term falling channel and limited below 38.2% retracement of 1.0342 to 0.9437 at 0.9783 for the moment. Break of 0.9582 will turn bias back to the downside for 0.9437. This could also extend the fall from 1.0342 through 0.9437/43 key support level.
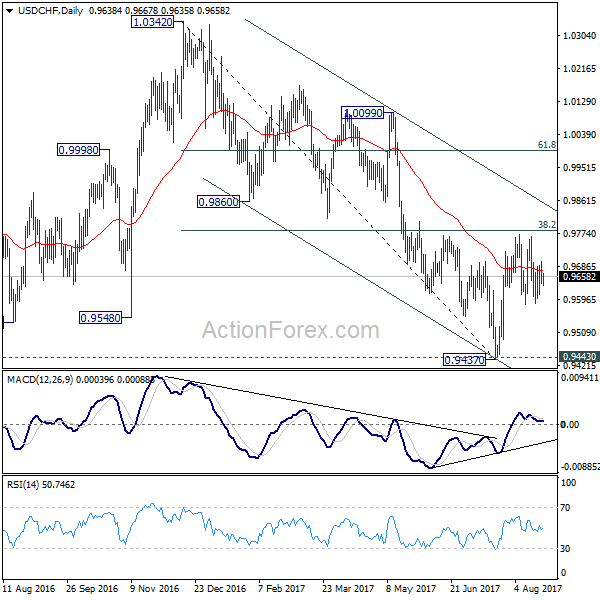
In the bigger picture, we're slightly favoring the case that USD/CHF has successfully defended 0.9443 key support level. And long term range trading in 0.9443/1.0342 is extending with another rise. At this point, there is no sign of an up trend yet. Hence, while further rise is expected in USD/CHF, we'll start to be cautious on loss of momentum above 61.8% retracement of 1.0342 to 0.9437 at 0.9996. However, firm break of 0.9443 will carry larger bearish implication and would target next key support at 0.9072.
USD/JPY Daily Outlook
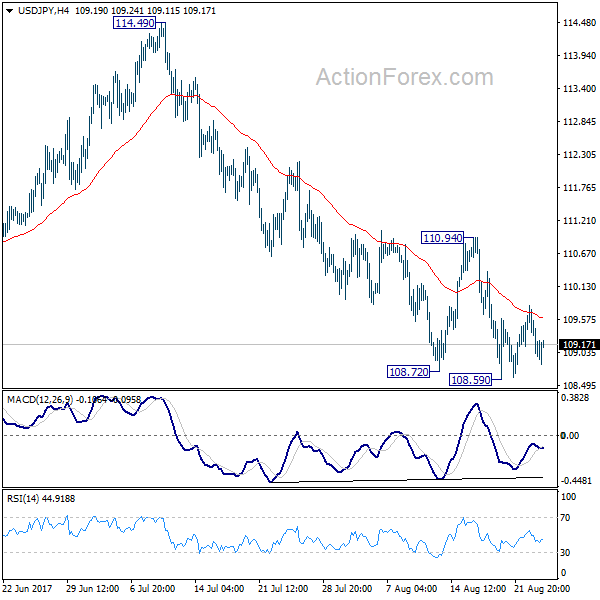
Daily Pivots: (S1) 108.69; (P) 109.26; (R1) 109.59; More...
USD/JPY is staying in consolidation above 108.59 temporary low and intraday bias remains neutral. Near term outlook stays bearish with 110.94 resistance intact and deeper decline is expected. Break of 108.59 will target a test on 108.12 low. Whole corrective decline from 118.65 is possibly resuming and break of 108.12 will target 61.8% retracement of 98.97 to 118.65 at 106.48. Nonetheless, firm break of 110.94 will indicate short term bottoming and turn bias back to the upside.
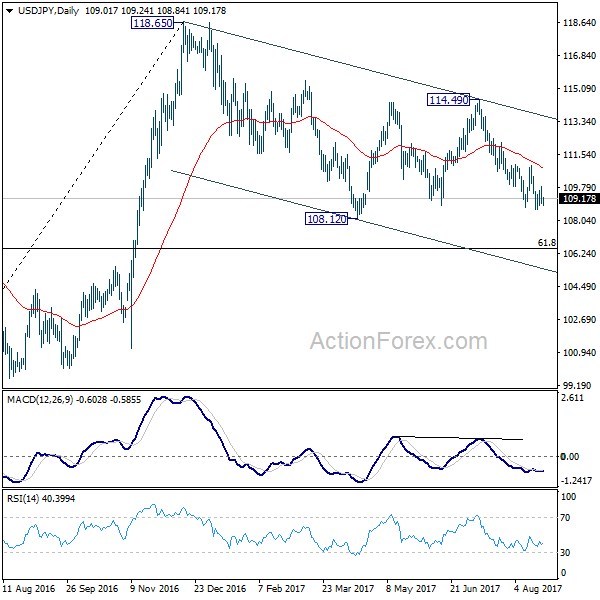
In the bigger picture, the corrective structure of the fall from 118.65 suggests that rise from 98.97 is not completed yet. Break of 118.65 will target a test on 125.85 high. At this point, it's uncertain whether rise from 98.97 is resuming the long term up trend from 75.56, or it's a leg in the consolidation from 125.85. Hence, we'll be cautious on topping as it approaches 125.85. If fall from 118.65 extends lower, downside should be contained by 61.8% retracement of 98.97 to 118.65 at 106.48 and bring rebound.
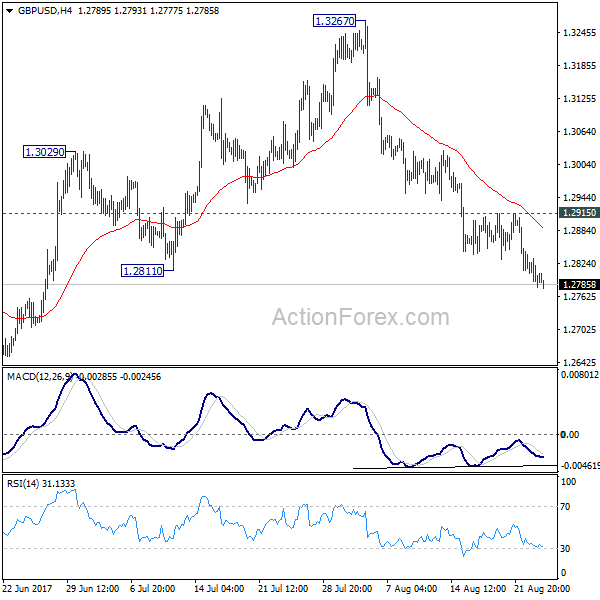
GBP/USD Daily Outlook
Daily Pivots: (S1) 1.2774; (P) 1.2803; (R1) 1.2828; More...
Intraday bias in GBP/USD remains on the downside as fall from 1.3267 is still in progress for 1.2588 key near term support. As noted before, we're favoring the case that correction from 1.1946 is completed at 1.3267. Decisive break of 1.2588 will confirm our view and target a test on 1.1946 low. On the upside, break of 1.2952 resistance is needed to indicate short term bottoming. Otherwise, outlook will stay cautiously bearish in case of recovery.
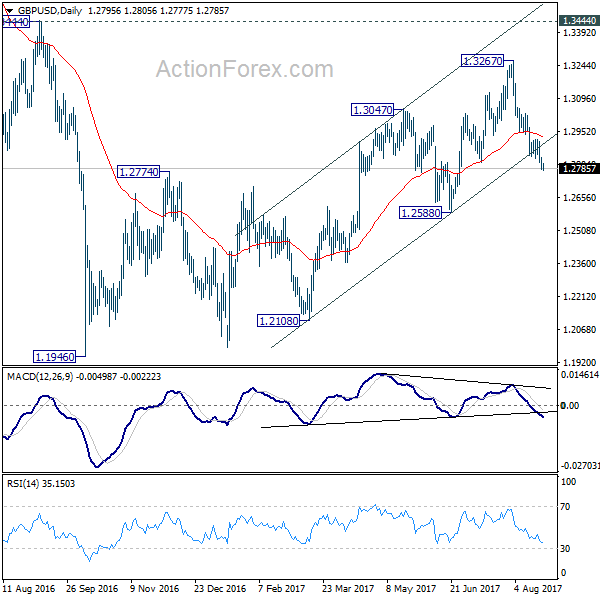
In the bigger picture, overall, price actions from 1.1946 medium term low are seen as a corrective pattern. While further rise cannot be ruled out, larger outlook remains bearish as long as 1.3444 key resistance holds. Down trend from 1.7190 (2014 high) is expected to resume later after the correction completes. And break of 1.2588 will indicate that such down trend is resuming.
Trump’s Government Shutdown Threat Stole Spotlight from Jackson Hole
While markets are awaiting speeches of Fed Chair Janet Yellen and ECB President Mario Draghi in the annual Jackson Hole symposium, they are unsettled by US President Donald Trump's comments on shutting the government. DOW gave up some of the gains on revived hope on tax reform and closed down -87.8 pts or -0.40% at 21812.09. S&P 500 dropped -8.47 pts or -0.35% to close at 2444.04. Dollar index is heading back to 93 handle and is kept well below near term resistance at 94.28, and thus maintaining bearishness. More notable movement is seen in 30 year yield which recent recent fall and closed down -0.04 at 2.749. 10 year yield also lost 0.044 to close at 2.171 but it kept above last week's low at 2.163. In the currency markets, Sterling and Kiwi are trading as the weakest one for the week and there is no sign of a rebound.
Shutdown threat complicates debt ceiling plan
Trump's pledge in a rally in Phoenix that "if we have to close down our government, we're building that wall" is seen by analysts as unsettling. He has requested USD 1.6b for building the US-Mexico border wall but that is widely rejected by Democrats. And, even though the House has passed a spending package with the wall funding, Trump doesn't have enough support to pass in the Senate by September 30. And he could in the end veto the spending bill if wall funding is not included. At the same time, some Republicans are working on a bipartisan bill with Democrats on raising debt ceiling. But the Democrats are clear on their rejection of attaching any condition to the debt bill. Now, it's believed that Trump's veto on spending will not only risk government shut down on October 1, but debt payment defaults shortly after that.
Fitch warns of rating review with negative implications
Credit ratings agency Fitch warned that failure to raise the debt ceiling would prompt a review on US AAA sovereign rating "with potentially negative implications". Fitch warned that "brinkmanship over the debt limit could ultimately have rating consequences, as failure to raise it would jeopardize the Treasury's ability to meet debt service and other obligations." It noted that "republican fiscal conservatives are likely to make support for lifting the debt limit conditional on measures to aggressively reduce the budget deficit. A 'clean' debt limit increase, unattached to other policy measures, appears possible, although it may require support from Democrats." And, "in Fitch's view, the economic impact of stopping other spending to prioritize debt repayment, and potential damage to investor confidence in the full faith and credit of the U.S., which enables its 'AAA' rating to tolerate such high public debt, would be negative for U.S. sovereign creditworthiness."
Impact on Fed's policy
Bearing a resemblance to the situation in 2013, one may worry about Fed's move in light of possible government shutdown. Back in 2013, the FOMC, led by the then Chair Ben Bernanke. Haunted by threats of not raising debt ceilings by Republicans at the time, Bernanke refrained from making announcement on tapering at the meeting on September 17-18. As noted in the minutes, the Fed acknowledged that "a number of significant risks remained, including those related to the potential economic effects of the sizable increases in interest rates since the spring, ongoing fiscal drag, and the possible fallout from near-term fiscal debates". US dollar slumped with the DXY index sinking over -1% on the day of this dovish announcement. More in US Debts Approach Limit. How Will It Affect Fed's Policy?
On the data front
New Zealand trade surplus narrowed to NZD 85b in July but was better than expectation of NZD -200m deficit. UK will release Q2 GDP revision, BBA mortgage approvals and CBI realized sales. US will release jobless claims and existing home sales.
GBP/USD Daily Outlook
Daily Pivots: (S1) 1.2774; (P) 1.2803; (R1) 1.2828; More...
Intraday bias in GBP/USD remains on the downside as fall from 1.3267 is still in progress for 1.2588 key near term support. As noted before, we're favoring the case that correction from 1.1946 is completed at 1.3267. Decisive break of 1.2588 will confirm our view and target a test on 1.1946 low. On the upside, break of 1.2952 resistance is needed to indicate short term bottoming. Otherwise, outlook will stay cautiously bearish in case of recovery.
In the bigger picture, overall, price actions from 1.1946 medium term low are seen as a corrective pattern. While further rise cannot be ruled out, larger outlook remains bearish as long as 1.3444 key resistance holds. Down trend from 1.7190 (2014 high) is expected to resume later after the correction completes. And break of 1.2588 will indicate that such down trend is resuming.
Economic Indicators Update
| GMT | Ccy | Events | Actual | Forecast | Previous | Revised |
|---|---|---|---|---|---|---|
| 22:45 | NZD | Trade Balance (NZD) Jul | 85M | -200M | 242M | 246M |
| 8:30 | GBP | BBA Mortgage Approvals Jul | 40.2K | |||
| 8:30 | GBP | GDP Q/Q Q2 P | 0.30% | 0.30% | ||
| 8:30 | GBP | Index of Services 3M/3M Jun | 0.50% | 0.40% | ||
| 8:30 | GBP | Total Business Investment Q/Q Q2 P | -0.10% | 0.60% | ||
| 10:00 | GBP | CBI Realized Sales Aug | 14 | 22 | ||
| 12:30 | USD | Initial Jobless Claims (AUG 19) | 236K | 232K | ||
| 14:00 | USD | Existing Home Sales Jul | 5.57M | 5.52M | ||
| 14:30 | USD | Natural Gas Storage | 53B | |||
| Jackson Hole Symposium |
Elliott Wave View: USDJPY Resuming Lower
Short term USDJPY Elliott wave view suggest the decline from 7/11 peak is unfolding as a double three Elliott wave structure. Decline to 108.71 low ended Minor wave W and Minor wave X bounce ended at 110.95 peak. Subdivision of Minor wave Y is unfolding as a Zigzag structure. Minute wave ((w)) of ((Y) ended at 108.59 low and Minute wave ((x)) of (Y) bounce ended at 109.82. The pair has reacted lower from the blue box, but the move lower will get validation only with a break below 108.59. Until then a double correction in Minutte wave ((x)) still can happen.
Down from 108.59, Sub Minutte wave a of (y) ended at 108.82 low and the pair is in Sub Minutte wave b bounce to correct the decline from 109.82 peak. Near term, while bounces fail below 109.82 peak and more importantly below 110.95, expect pair to extend lower. Initial target to the downside is 108.35-108 area to complete Minutte wave (w). Afterwards, pair should bounce in Minutte wave (x) before the decline resumes. We don’t advise buying the pair and expect more downside in the pair as far as bounces fail below 110.95 peak.
USDJPY 1 Hour Elliott Wave Chart
Double three ( 7 swings): Is the most important pattern in Elliott wave’s new theory and probably the most common pattern in the market these days. Double three is also known as a 7-swing structure. It is a very reliable pattern that gives traders a good opportunity to trade with a well-defined level of risk and target areas. The image below shows what Elliott Wave Double Three looks like. It has labels (W), (X), (Y) and an internal structure of 3-3-3. This means that all 3 legs has corrective sequences. Each (W) and (Y) is formed by 3 wave oscillations and has a structure of A, B, C or W, X, Y of smaller degrees.
Market Morning Briefing: Overall Weakness In The Dollar And Pound Continues
STOCKS
Dow (21812.09, -0.40%) dipped yesterday after threat from Trump to let the US government shut down over funding for a border wall. The Dow index slipped 87 points yesterday and if it remains below 21900, chances of testing 21670-21600 comes into the focus again. A medium term top seems to have been made near 22179 earlier this month and while that holds, we would have to remain cautious for seeing some more dips on the downside.
Dax (12174.30, -0.45%) is trading above weekly support levels of 11980 which could take the index to higher levels in the coming sessions. A break below 11980, if seen could extend the fall from levels near 13000 to lower levels of 11700-11600 in the coming weeks. Watch price action near crucial support at 11980 just now.
Asia-Pac likely to remain bearish in the near term. The stock indices are all set on extending the downside correction before attempting on any recovery just now. Nikkei (19408.80, -0.13%) trades below 19650 and while it remains below 19650, the fall that started near 20000 could continue towards 19000 levels in the near term. This could also lead to a fall in the Dollar Yen (109.16) in the coming sessions.
Shanghai (3283.58, -0.13%) could start off its corrective mode while resistance at 3300 holds. A fall towards 3260/50 looks likely just now. Unless a break above 3300 is seen, we expect a short corrective fall in the coming sessions.
Nifty (9852.50, +0.89%) closed above 9850 yesterday but is likely to remain range-bound within 9700-9900 region for a few more sessions. Immediate support and resistance levels are visible at 9700-9680 and 9900 levels respectively. We would suggest to remain cautious as the downside vulnerability is still intact while below 9900.
COMMODITIES
Gold (1289) was unable to move beyond its key physiological resistance of 1300. Thus it could remain in a sideways channel of 1275-1298 regions for rest of this week. Silver (16.93) is also trading within the range of 16.50-17.05 regions. Only a daily close above 17.05 could open up 17.50 levels.
Copper (2.98) moved up but still within the narrow range of 2.85-98. Only above 2.98, higher resistances of 3.05 and 3.12 can come into consideration. We will remain bullish on copper while it is trading above 2.85 regions.
This is the 9th consecutive week of shortage in U.S. oil inventory and as a result Brent (52.55) moved up but still within the range of 47-54,narrowed from 45-55 last month.Only a close above 54 could open higher levels of 56 and 59 respectively . WTI (48.37) has also moved up along with Brent. We will remain bullish on Brent and WTI while they are trading above 47 and 46 regions respectively.
FOREX
Overall weakness in the Dollar and Pound continues. Dollar-Yen suggests Risk is still in the air.
The Euro-Yen (128.85) is largely stable as both the Euro (1.1805) and the Yen (USDJPY 109.17) have gained simultaneously against the Dollar. The Dollar Index (93.28) continues to consolidate sideways between 92.50-94.25, but may resume the overall downtrend while the Resistance at 94.00-25 continues to hold.
The mentioned Support at -1.81% on the German-US 10Yr Spread (-1.79%) has held well enough, lending a bit of a bounce to the Euro (1.1805). We need to see if the Spread will now move up further towards -1.75% or not, for which the market will be looking forward to Jackson Hole tomorrow.
Dollar-Yen (109.17) found Resistance near 109.80 itself early yesterday morning and is therefore likely to remain ranged between 108.60-109.80 for a few more days. In the longer term, the chances of an eventual break below 108.60 are higher. Keep an eye on this, as it suggests lurking danger. Maybe USA - North Korea?
The Pound (1.2800) hasn't broken below 1.2787 as yet but remains bearish while below 1.2845-50. It looks particularly bearish against the Yen (GBPJPY = 139.60) but may have Resistance against the Euro near the current level (EURGBP = 0.9230). This last is a cautionary note against our expressed bullishness on the EURGBP over the last few days.
The Aussie (0.7903) has managed to avoid a fall, bouyed by the rise in the Euro. It appears ranged between 0.7830-7950 for the next few days, within the still intact overall uptrend.
As expected, the Chinese Yuan (USDCNY = 6.6588) has strengthened a bit more since yesterday. We target 6.6150 on the downside. Dollar-Rupee quotes 64.05/10 on the NDF, after having closing near 64.11 yesterday.
INTEREST RATES
The US yields are hovering around their crucial areas of supports as investors are focusing on the Jackson Hole conference this week, specially Fed Chair Yellen's speech on Friday 9.30 PM IST to get insights on the outlook for monetary policy.
Euro moved up in line with our expectation. the German-US 2Yr Spread (-2.02%) and the German-US 10Yr Spread (-1.80%) are looking stable at current levels and rise towards -1.98% and -1.76% respectively, which could be beneficial for Eur as well. Besides market is waiting for ECB President Draghi's speech on this Saturday at 12.30 AM IST.
The Japan 5Yr (-0.10%) and the 10Yr (0.03%) are also stable at this moment. The Japan 30Yr (0.82%) might find support at current levels and could move upward towards 0.90%.
Muted price action had been seen in the UK yields . The 10YR (1.06%) and the 20YR (1.61%) both have scope of testing 1% and1.50% on the downside.
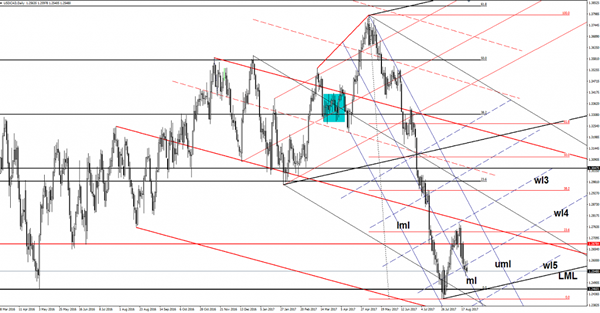
USD/CAD In The Seller’s Territory
USD/CAD is trading in the red after the false breakout above the warning line (wl4) and could slip much lower on the short term. Has retested the median line (ml) of the minor descending pitchfork, but wasn't enough to start another leg higher. Could come down t o retest the confluence area formed at the intersection between the 1.2460 with the lower median line (LML) of the major black ascending pitchfork.
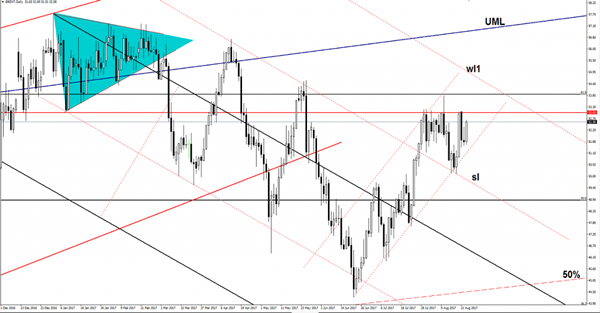
Brent Oil Still Bullish
Brent Oil rallied after the minor retreat and is expected to approach and retest the 53.03 major horizontal resistance. Only another false breakout will send the rate tumbling and much below the downside line of the minor ascending channel. Is trading right above the $52.50 per barrel and seems determined to resume the upward movement after the failure to retest the uptrend line.
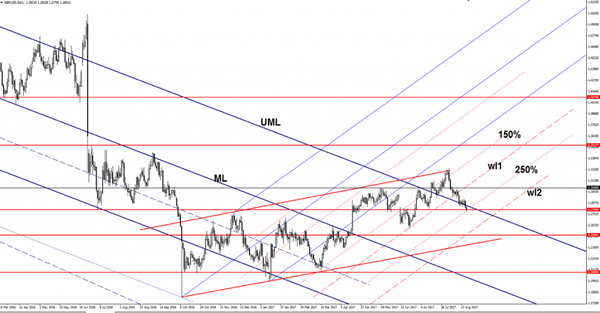
GBP/USD Slide Further
Price slips lower on the bearish pressure and looks very heavy on the short term, even if the USDX has slipped lower as well. Is challenging a critical support level, a valid breakdown will signal a broader drop on the Daily chart. Right now is better to stay away till we'll have a clear direction, at this moment we don't have a trading opportunity. GBP/USD stays lower despite the mixed United States data, the greenback would have appreciated much more if the New Home Sales would have come in lines with expectations or better.
Unfortunately, the New Home Sales plunged from 630K to 571K in July, even if the economists have expected to see an increase to 611K. You should keep an eye on the economic calendar tomorrow because we have some high impact data.
It is pressuring the 1.2798 static support right now, actually, is trying to breakdown through the confluence area formed between the 1.2798 level with the 250% Fibonacci line (ascending dotted line). A valid breakdown will accelerate the sell-off, which will approach the next downside target from the second warning line (wl2).
Technically should drop much deeper after the breakdown below the first warning line (wl1) and after the failure to stabilize above the upper median line (UML) of the major descending pitchfork. Personally, I believe that only the fundamental factors could turn the rate to the upside again.
Will Draghi or Yellen Deliver a Summer Bombshell?
Significant Policy Warnings May Be Too Much to Ask This Year
The Jackson Hole Symposium is this week's highly anticipated event, in part due to a severe lack of other newsworthy market stories but also because two very important central bankers are scheduled to appear.
The Federal Reserve and the European Central Bank are not only two of the most important central banks in the world, they're expected to be among the more active over the next year, with the former having already begun raising interest rates and the latter in the process of winding down its quantitative easing program.
With announcements expected from both in the coming months, investors will be looking to their speeches at Jackson Hole - a platform used to prepare markets for policy changes by previous Fed Chairs Alan Greenspan and Ben Bernanke - for similar policy signals.
Janet Yellen - Federal Reserve Chair
Yellen's remarks will be poured over by investors, primarily for clues on the future path of interest rates, with the prolonged period of low inflation now starting to unsettle some policy makers. The Fed had previously indicated that it plans to raise interest rates one more time this year but investors have been unconvinced for some time and recently, the scepticism has started to spill over into commentary from some policy makers.
Swing voters within the FOMC, such as Jerome Powell and Robert Kaplan, appear to be among those that still need convincing, while others appear to lack the belief they once had. Should nothing change then I expect the Fed will likely hold off until next year to raise interest rates further but with the committee appearing so split, it's very difficult to know. This is perfectly reflected in current market implied rate hike expectations.
Source - CME Group FedWatch Tool
It's also worth noting that the Fed will soon effectively be tightening on two fronts, with the central bank set to announce in September that it plans to start reducing the size of its balance sheet which was built up in the aftermath of the financial crisis through quantitative easing. The balance sheet currently stands close to $4.5 trillion, a level many believe is far too high.
Source - Federal Reserve
If the Fed starts the process of balance sheet reduction next month, it may buy them a little more time on interest rates and allow them to wait for inflation to pick up before hiking again.
Whatever they decide, traders will be keenly following Yellen's comments on Friday for any suggestion that the pace of rate hikes will be slower than previously expected. Should this happen, we could see further weakness in the dollar and yields could fall.
Mario Draghi - ECB President
While getting policy clues out of Janet Yellen may be difficult, in the case of Draghi it's like trying to draw blood from a stone, at least recently anyway.
The ECB has become obsessed, it seems, with the euro rate and bond yields and the unintentional tightening in financial conditions that these could trigger. At the end of June, Draghi suggested that recent progress could allow the central bank to pull back on unconventional measures - a clear reference to tapering of asset purchases - and markets were quick to respond.
Despite the market's reaction being far from extraordinary, officials from the ECB were quick to clarify his remarks and effectively reverse the moves that followed it. Clearly they're far more concerned about what are relatively minor moves than they would have us believe.
After this mishap, it seems likely that Draghi will very much keep to the script during his appearance at Jackson Hole and, unfortunately for us, I expect this script will be rather uneventful. Not only will the next ECB meeting in September come with new macroeconomic projections that will shape their decision on QE after December, but his speech also falls in the relatively illiquid month of August. The ECB will want to avoid any sharp appreciation in the currency and a similar rise in bond yields at all costs.
If anything, Draghi may deliver a rather dovish message that still leaves the door open to tapering at the end of the year while carefully managing the euro lower.
Of course, there is the potential that a warning of a policy shift comes from the event - and we should be prepared for significant volatility in case it happens - I just don't expect it to come from Draghi this time around. And Yellen may remain tight lipped as well given the uncertain outlook on inflation.