
Sample Category Title
Daily Technical Analysis: EUR/USD Retests Resistance Of Bull Flag Pattern At 1.1825
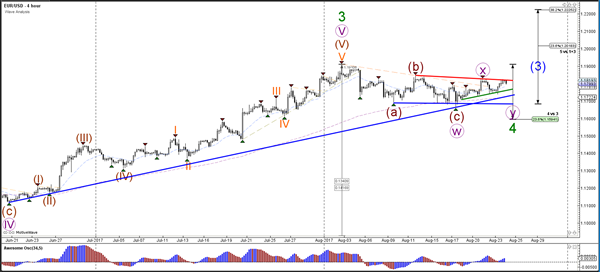
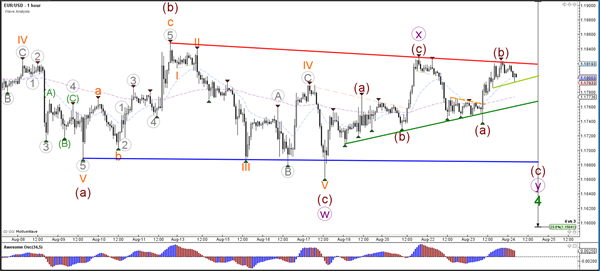
Currency pair EUR/USD
The EUR/USD is challenging the resistance trend line (red) of the bull flag chart pattern. At the moment it is unable to break and a correction back to the support trend lines is possible. The next breakout above resistance (red) of the contracting triangle pattern should see the continuation of wave 3 (blue).
The EUR/USD has arrived at a break spot. A break below support (light green) could see price challenge the bigger support zones (green/blue) and perhaps even the 23.6% Fib of wave 4 vs 3, whereas a break above resistance could lead to an uptrend continuation. There is the possibility of an ABC (brown) correction before wave 4 (green) is ready but a break above the major resistance (red) would invalidate that and indicate a potential bullish breakout.
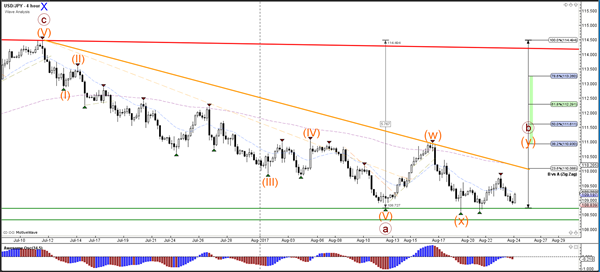
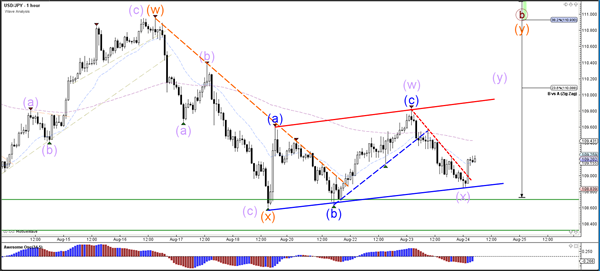
Currency pair USD/JPY
The USD/JPY is again retesting the support zone (green lines). A bounce could see price move higher towards the Fib levels of wave B vs A whereas a bearish break could indicate a downtrend continuation.
The USD/JPY is building a channel (red/blue lines) at the support zone (green).
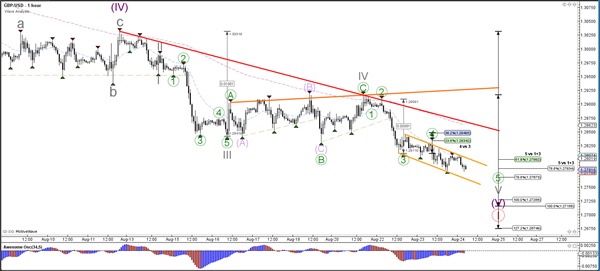
Currency pair GBP/USD
The GBP/USD is moving lower within the downtrend channel (red). The round quarter level of 1.2750 could act as a support zone.
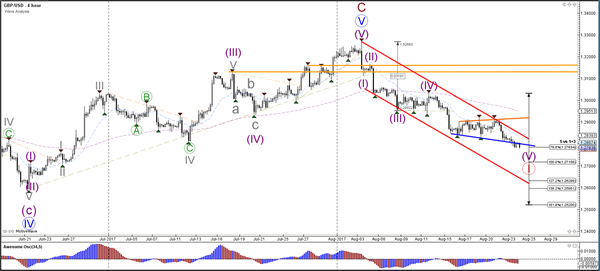
The GBP/USD indeed completed a wave 4 (green) correction and is moving lower in a smaller channel (orange lines).
Daily Technical Outlook And Review: EUR/USD, GBP/USD, AUD/USD
A note on lower timeframe confirming price action...
Waiting for lower timeframe confirmation is our main tool to confirm strength within higher timeframe zones, and has really been the key to our trading success. It takes a little time to understand the subtle nuances, however, as each trade is never the same, but once you master the rhythm so to speak, you will be saved from countless unnecessary losing trades. The following is a list of what we look for:
- A break/retest of supply or demand dependent on which way you're trading.
- A trendline break/retest.
- Buying/selling tails ... essentially we look for a cluster of very obvious spikes off of lower timeframe support and resistance levels within the higher timeframe zone.
- Candlestick patterns. We tend to only stick with pin bars and engulfing bars as these have proven to be the most effective.
We typically search for lower-timeframe confirmation between the M15 and H1 timeframes, since most of our higher-timeframe areas begin with the H4. Stops are usually placed 1-3 pips beyond confirming structures.
EUR/USD
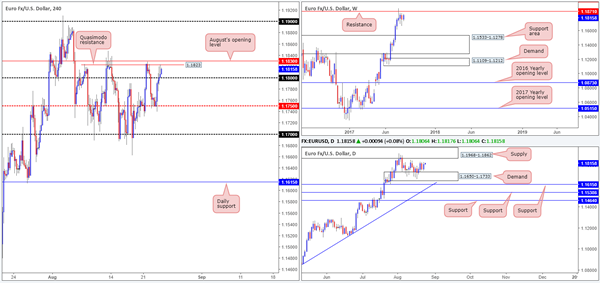
EUR buyers managed to find their feet early on in the day on Wednesday, bolstered by the H4 mid-level support at 1.1750. As a result of this, H4 price broke and eventually closed above the 1.18 handle. As you can see though, the unit failed to generate much follow through after this, due to a nearby Quasimodo resistance level at 1.1823 (shadowed closely by August’s opening level at 1.1830). However, considering that the USDX shows room for the H4 candles to push down as far as the trendline support extended from the low 11853, we may see the two noted H4 resistances give way sometime today.
The story over on the weekly chart shows that the buyers and sellers remain battling for position below a major resistance at 1.1871. A similar picture can be seen on the US dollar index (USDX), only inverse from a weekly support drawn in at 11854. Looking down to the daily timeframe, price is currently seen sandwiched between a supply zone coming in at 1.1968-1.1862 and a demand base lodged at 1.1650-1.1733.
Suggestions: A decisive close above 1.1830 on the H4 chart likely clears the footpath north up to the 1.19 band. While this may be true on the H4 timeframe, the bigger picture shows we have both the underside of the current daily supply at 1.1862 and the weekly resistance at 1.1871 to contend with before 1.19 can be achieved. This, for us, makes buying beyond 1.1830 just too much of a risk.
Data points to consider: US Jackson Hole symposium (all day), Unemployment claims at 1.30pm GMT+1.
Levels to watch/live orders:
- Buys: Flat (stop loss: N/A).
- Sells: Flat (stop loss: N/A).
GBP/USD
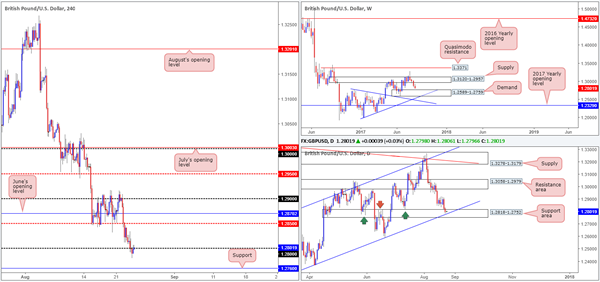
GBP/USD staged a modest selloff on Wednesday, forcing the H4 candles beyond the 1.28 handle. While there will be traders looking to sell this recent break, it might be worth noting what price actually broke into! Over on the daily timeframe, price entered into the walls of a support area drawn from 1.2818-1.2752, which intersects beautifully with a channel support line etched from the low 1.2365. Also notable is the nearby weekly demand seen at 1.2589-1.2759!
Suggestions: In view of the unit’s close proximity to the weekly demand, as well as price currently interacting with a daily support area, we’re reluctant to take on any medium/long-term shorts at this time. Ultimately, what we’re looking for is a decisive H4 close back above the 1.28 neighborhood. This, alongside a retest and a reasonably sized H4 bullish candle (preferably printed in the shape of a full, or near-full-bodied candle) would, in our opinion, be enough to validate a long trade. The first area of concern would be the H4 mid-level resistance at 1.2850, followed closely by June’s opening level at 1.2870.
Data points to consider: UK (second estimate) growth figures q/q at 9.30am. US Jackson Hole symposium (all day), Unemployment claims at 1.30pm GMT+1.
Levels to watch/live orders:
- Buys: Watch for H4 price to close above 1.28 and then look to trade any retest seen thereafter ([waiting for a reasonably sized H4 bullish candle to form following the retest is advised] stop loss: ideally beyond the candle’s tail).
- Sells: Flat (stop loss: N/A).
AUD/USD:
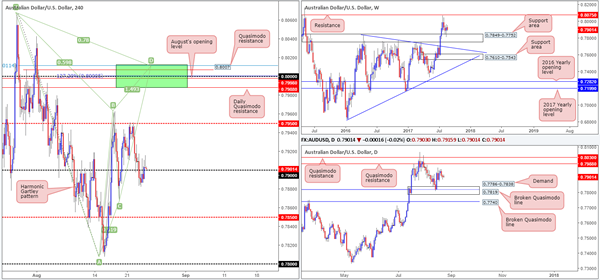
In recent trading, we saw the H4 candles inch back above the 0.79 handle after clocking a low of 0.7887. Should this number hold as support, the 0.7950 line is likely going to be the next target. Beyond this number, however, we have our eye on the 0.80 line. As highlighted in previous reports, apart from 0.80 being a watched round number, there are several nearby structures that deserve mention:
The daily Quasimodo resistance level at 0.7988.
A H4 Quasimodo resistance level at 0.8007.
A H4 127.2% Fib ext. point at 0.80 taken from the low 0.7807.
August’s opening level at 0.7998.
A H4 Harmonic Gartley reversal point at the 78.6% Fib resistance line drawn from 0.8011.
Suggestions: While the above structures on the H4 timeframe (green sell zone) boast attractive confluence, one must take into account that a fakeout may be seen up to the daily Quasimodo resistance level at 0.8030 sited just above the green zone. Traditionally, when trading Gartley patterns, the stop-loss order should go beyond the X point (0.8065). If you were to follow this, a fakeout up to the daily Quasimodo resistance is not a concern. It is more for the aggressive traders who will likely look to position stops just beyond the green zone. Should you be one of those traders, you may want to consider waiting for the H4 candles to prove seller intent (in the form of either a full, or near-full-bodied candle), before pressing the sell button. This will help avoid a fakeout should it occur.
At current price, nevertheless, we see little opportunity to trade. A long from 0.79 is, of course, an option, but given the recent H4 bearish selling wick printed just above this level, we’re reluctant to pull the trigger. Unless 0.80 comes into view today, we will likely remain on the sidelines.
Data points to consider: US Jackson Hole symposium (all day), Unemployment claims at 1.30pm GMT+1.
Levels to watch/live orders:
- Buys: Flat (stop loss: N/A).
- Sells: 0.8011/0.7988 (stop loss: either wait for a H4 bearish candle to form in the shape of a full, or near-full-bodied candle, and place stops above the candle’s wick. Another option is to enter at 0.80 and place stops above the H4 Harmonic X point at 0.8067).
Oil And Gold Consolidate Gains
Oil and Gold had relatively calm sessions overnight with both crude and gold quietly consolidating their recent gains ahead of Jackon Hole.
OIL
Oil prices rose by just over one percent overnight as the Energy Information Administration (EIA) Crude Inventories showed a drop of 3.3 million barrels, continuing the trend of declines of crude oil in storage in the U.S. Although the number was slightly less than predicted, crude also got a boost from continued supply disruptions in Libya as well as potential weather related disruptions in the Gulf of Mexico.
The street appears to be in a wait and said mode now, firstly from Yellen's keynote speech at Jackson Hole, and secondly for more substantial evidence of OPEC compliance and a tightening of supplies globally rather than just the United States. The market seems unwilling to pull the trigger and test higher ranges on either Brent or WTI until this happens, even as the short end of the Brent futures curve moves into backwardation.
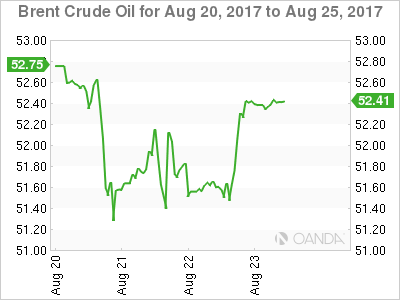
Brent spot is trading flat at 52.65, just below its upper range boundary at 52.70. A break opens up a test of 53.50 as Brent's price action and premium over WTI spot continues to be the more constructive of the two. Only a move below 51.20 would shake confidence at this stage.
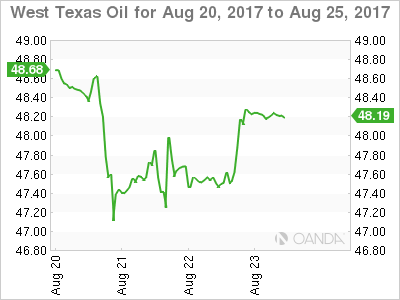
WTI spot is also flat from its New York close at 48.20. The short term technical show a converging triangle with lower and upper boundaries at 47.65 (also the 100-day average) and 48.50. A break of either level opens an extension of the price action below 47.00 and above 49.00 respectively.
GOLD
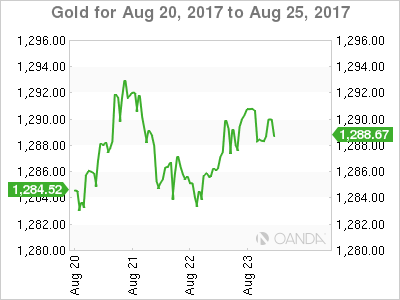
The summer doldrums continued overnight as gold produced a sideways day ahead of the start of the Jackson Hole Symposium. The trend line support, today at 1281.00, remained untested overnight as gold traded quietly higher to close near the top of its range at 1288.00.
Ms. Yellen's speech will decide the near term fate of the U.S. dollar and thus gold as well so patience will be required until her keynote speech tomorrow.
In the meantime, however, gold's price action continues to be constructive as its quietly goes about its work consolidating the gains of the last ten days. Resistance appears initially at 1296.00 followed by the Friday high at 1301.00.
European Open Briefing: Asian Equity Markets Gained Slightly On Thursday
Global Markets:
- Asian stock markets: Nikkei lost 0.28 %, Shanghai Composite lost 0.07 %, Hang Seng up 0.09 %, ASX 200 gained 0.04 %
- Commodities: Gold at $1294.98 (+0.02 %), Silver at $17.06 (+0.10 %), WTI Oil at $48.36 (-0.10 %), Brent Oil at $52.55 (-0.02 %)
- Rates: US 10-year yield at 2.17, UK 10-year yield at 1.06, German 10-year yield at 0.36
News & Data:
- USD New Home Sales 571 K vs 611 K expected
- USD Crude Oil Inventories -3.3 M vs -8.9 M expected
- EUR French Flash Manufacturing PMI 55.8 vs 54.5 expected
- EUR French Flash Services PMI 55.5 vs 55.9 expected
- EUR German Flash Manufacturing PMI 59.4 vs 57.7 expected
- EUR German Flash Services PMI 53.4 vs 53.4 expected
- EUR Flash Manufacturing PMI 57.4 vs 56.3 expected
- EUR Flash Services PMI 54.9 vs 55.4 expected
Markets Update:
Asian equity markets gained slightly on Thursday in spite of the concerns about the Trump administration’s ability to enact its fiscal agenda. Most indexes were seen trading in a tight range as investors await guidance from a key meeting of global central bankers.
EURUSD buyers managed to find their feet early on in the day on Wednesday eventually closing the day above 1.1800, post this the Euro continued to trade within a very small range as there were very little factors driving it. Currently the Euro is seen trading close to it’s opening price around 1.1806 against the US Dollar losing a few points (net) on the session.
USDJPY has been quite active early on Thursday in spite of the very light data inflow. The yen slipped 0.2 percent as the US dollar popped over 30 pips from early session lows under 108.90 and is currently seen trading at 109.2.
AUDUSD gained a few points early in the session reaching highs of 0.79160, but it didn't last as price dipped back and is now little net changed on the session. The 0.7950 line is likely going to be the next target for the Aussie should the round number 0.7900 hold as support.
Upcoming Events:
- 08:30 GMT – (GBP) Second Estimate GDP q/q
- 08:30 GMT – (GBP) Prelim Business Investment q/q
- 12:30 GMT – (USD) Unemployment Claims
- 14:00 GMT – (USD) Existing Home Sales
Market Update – Asian Session: China Deleveraging Efforts Showing Signs Of Working
Asia Summary
Asian equity markets opened mixed again with quiet trade in equities and FX. The USD firmed up slightly against regional currencies, on avg ~0.1% with a little economic catalyst to push things further. Traders remain focused on Jackson Hole and any indication from world leaders on their plans for fiscal policy. Growth concerns re-enter the peripheral as Trump indicates at yesterday rally that he is fine shutting down the government to get what he wants. The PBOC had its 4th consecutive drain, though skipped OMO; while setting the yuan at an 11-month high of 6.6525.
Key economic data
(NZ) NEW ZEALAND JULY TRADE BALANCE (NZD): +85M V -200ME; YTD: B V -3.51BE; Exports: 4.63B v 4.42Be; Imports4.55 B v 4.60Be
(KR) South Korea Q2 Short Term External Debt: $117.3B v $115.4B prior
Speakers and Press
China/Hong Kong
(CN) FX Regulator SAFE Capital Account Dep Head Guo Song: Proposes stable outbound direct investment policy; work on promoting yuan convertibility under capital account - Chinese Press
(CN) China Premier Li Keqiang: China will further reduce leverage at central State-owned enterprises (SOE) by establishing multiple channels to reduce corporate debts - State Council executive meeting
(CN) China MOFCOM: US probe into China, sabotages international trade system; will use necessary ways to defend legitimate right
(CN) Analysts note that PBOC efforts to deleverage have resulted in a noticeable decline in CODs in August - Chinese press
Korea
(KR) South Korea Fin Min Kim: To announce 'comprehensive' measures on household debt in Sept; Domestic consumption low and employment weak
Asian Equity Indices/Futures (00:00ET)
Nikkei -0.2%, Hang Seng +0.5%; Shanghai Composite -0.0%, ASX200 +0.3%, Kospi +0.4%
Equity Futures: S&P500 -0.1%; Nasdaq100 -0.0%, Dax +0.1%, FTSE100 +0.1%
FX ranges/Commodities/Fixed Income (00:00ET)
EUR 1.1766-1.1748; JPY 109.83-109.37; AUD 0.7918-0.7883; NZD 0.7283-0.7232
Dec Gold -0.1% at $1,293/oz; Oct Crude Oil -0.04% at $48.38/brl; Sept Copper +0.3% at $2.99/lb
(CN) China PBOC skips OMO v CNY180B in 7 and 14-day reverse reports prior: net drains CNY100B v drains CNY40B prior
USD/CNY *(CN) PBOC SETS YUAN REFERENCE RATE AT 6.6525 V 6.6633 PRIOR
(CN) PBoC auctions CNY80B in 3-month MoF deposits at 4.51% v 4.46% prior
(NZ) New Zealand sells NZ$150M v NZ$150M indicated in 3.5% 2033 Bonds; avg yield 3.2883%; bid-to-cover 2.23x
(CN) China sells CNY36B in 3-yr bonds
(JP) Japan MoF sells ¥3.59B in 3-month bills; avg yield -0.1463%
Equities notable movers
Australia/New Zealand
FLT.AU Reports FY17 (A$) Net profit 230.8M v 225Me; EBITDA 402.1M v 399Me; Rev 2.68B v 2.64B y/y; +11%
BLY.AU Reports H1 (A$) Adj Net loss 41.8M v loss 52.1M y/y; adj EBITDA 21.4M v 13.5M y/y; Rev 356.2M v 310.5M y/y; +22%
MPG.NZ Chairman: 4-month Rev flat y/y; sees H1 flat y/y – AGM; -11.5%
The Jackson Hole Symposium Starts Today
The Jackson Hole Symposium Starts Today
Market movers today
The Jackson Hole Symposium starts today but financial markets will have to wait until tomorrow to get the key speeches by both ECB President Mario Draghi and Fed President Janet Yellen. There may be some interesting interviews at the fringes though to look out for.
On the data front , US initial jobless claims and US existing home sales are due. Initial claims have been edging lower again in recent weeks and fell to 232k last week – very close to the cycle low in February. It points to a robust labour market with a very low rate of layoffs.
In the UK, the second GDP estimate for Q2 is due for release. The first estimate showed sluggish quarterly growth of 0.3%, driven primarily by the service sector, while construction and manufacturing dragged. However, there is speculation that the second estimate will revise the figure upwards, as we also observed sluggish growth of 0.2% in Q1 and the Bank of England had expected a figure of 0.4%. In the second estimate, we will also get data on the expenditure components and it will be interesting to see whether private consumption growth continues to remain low and investments in Q2 saw high growth (1.2% in Q1).
We have a busy calendar in Scandinavia today: In Norway, the Q2 GDP figures and the Q3 Oil investment survey are due and in Sweden, the Riksbank's Kerst in af Jochnick is due to speak at 13.00. For more details, see Scandi Markets on page 2.
Selected market news
Risk sentiment was weighed down yesterday by renewed concerns about US politics and US equity markets mirrored the declines in Europe with S&P 500 closing 0.35% lower. In Asia, the picture is more mixed this morning with Japanese and Chinese markets trading slight ly lower, while most other regional indices are higher. One of the drivers appears to be some previous comments from US President Donald Trump, who on Thursday threatened a government shutdown if Congress did not pay for his proposed border wall for Mexico. Trump's hard rhetoric has added concerns about a potent ial government shutdown in connect ion with the upcoming debt ceiling negotiations and reminded investors that it might not be easy to get a tax reform deal.
On the data side, euro area PMIs showed an upbeat economic picture in August , supporting our const ruct ive view of euro area growth for this year – we forecast 2.0%. In the US, data was more mixed with US Markit PMI manufacturing falling to 52.5 in August from 53.3 against expectations of an increase to 53.5, with PMI service surprising to the upside rising to 56.9 from 54.7 in July.
Mario Draghi's speech yesterday offered lit t le hints on future monetary policy and while we still have to wait until Draghi's speech at Jackson Hole on Friday at 21:00 CET for more details, we got a little bit of colour on the ECB's stance as ECB member Ardo Hansson said in an interview yesterday that he is not currently concerned about the strength of the euro.
Aussie Dollar Trading Marginally Lower In The Morning Session
For the 24 hours to 23:00 GMT, the AUD slightly declined against the USD and closed at 0.7908.
LME Copper prices declined 0.4% or $29.0/MT to $6555.0/MT. Aluminium prices declined 1.1% or $22.0/MT to $2082.5/MT.
In the Asian session, at GMT0300, the pair is trading at 0.7905, with the AUD trading a tad lower against the USD from yesterday’s close.
The pair is expected to find support at 0.7886, and a fall through could take it to the next support level of 0.7867. The pair is expected to find its first resistance at 0.792, and a rise through could take it to the next resistance level of 0.7935.
The currency pair is showing convergence with its 20 Hr and 50 Hr moving averages.

Euro-Zone’s Manufacturing Sector Activity At A 2-Month High In August, Services Sector Growth Cooled To A 7-Month Low In...
For the 24 hours to 23:00 GMT, the EUR rose 0.43% against the USD and closed at 1.1814, following robust economic data from across the Euro-zone.
Data indicated that the Euro-zone's flash Markit manufacturing PMI unexpectedly advanced to a level of 57.4 in August, expanding at its fastest pace in two months, indicating that manufacturing sector continues to be one of the important bellwether for the region's economic recovery. Market participants had expected the PMI to drop to a level of 56.3, following a reading of 56.6 in the prior month. On the contrary, the region's preliminary Markit services PMI unexpectedly fell to a seven-month low level of 54.9 in August, while markets were anticipating it to remain steady at a level of 55.4 registered in the previous month.
In other economic news, the flash consumer confidence index in the common currency region unexpectedly improved to a level of -1.5 in August, compared to a level of -1.7 in the prior month. Markets were anticipating the index to ease to a level of -1.8.
Separately, Germany's manufacturing sector growth unexpectedly jumped to a level of to 59.4 in August, confounding market consensus for a decline to a level of 57.6. In the preceding month, the PMI had registered a reading of 58.1. Moreover, activity in the nation's services sector expanded more-than-expected to a level of 53.4 in August, compared to a reading of 53.1 in the prior month, while markets were expecting the PMI to rise to a level of 53.3.
The greenback lost ground against a basket of currencies, as the US President, Donald Trump's warning of a government shutdown dampened investor sentiment.
The US President vowed that he will shut down government if he does not get funding to build a border wall with Mexico. Further, Trump also threatened of possible termination of the North American Free Trade Agreement (NAFTA).
Meanwhile, Fitch Ratings warned that failure of the US government to raise the debt ceiling in a timely manner would prompt it to review its rating on US sovereign debt for a possible downgrade.
On the macro front, the US preliminary Markit manufacturing PMI unexpectedly eased to a 2-month low level of 52.5 in August, defying market expectation for a rise to a level of 53.5 and compared to a reading of 53.3 in the previous month. On the other hand, the nation's flash Markit services PMI rose to a level of 56.9 in August, topping market expectations of an advance to a level of 55.0. In the prior month, the PMI had recorded a level of 54.7.
Other data showed that new home sales in the US sharply fell by 9.4% on monthly basis, to a level of 571.0K in July, compared to a revised reading of 630.0K in the previous month, while market participants had envisaged it to drop to a level of 610.0K. Also, the nation's mortgage applications slid 0.5% in the week ended 18 August. In the prior week, mortgage applications had risen 0.1%.
In the Asian session, at GMT0300, the pair is trading at 1.1804, with the EUR trading 0.08% lower against the USD from yesterday's close.
The pair is expected to find support at 1.1755, and a fall through could take it to the next support level of 1.1706. The pair is expected to find its first resistance at 1.1838, and a rise through could take it to the next resistance level of 1.1872.
In absence of any major macroeconomic releases in the Euro-zone today, traders will pay attention to the US weekly jobless claims followed by existing home sales data for July, both scheduled to release later in the day.
The currency pair is showing convergence with its 20 Hr moving average and trading above its 50 Hr moving average.

Pound Trading Lower, Ahead Of Britain’s GDP Data
For the 24 hours to 23:00 GMT, the GBP declined 0.13% against the USD and closed at 1.2804.
In the Asian session, at GMT0300, the pair is trading at 1.2788, with the GBP trading 0.12% lower against the USD from yesterday's close.
The pair is expected to find support at 1.2766, and a fall through could take it to the next support level of 1.2744. The pair is expected to find its first resistance at 1.2822, and a rise through could take it to the next resistance level of 1.2856.
Going ahead, investors will closely monitor Britain's flash 2Q GDP report, slated to release in a few hours, to gauge the strength in the British economy. Moreover, the nation's BBA mortgage applications data for July, will also be eyed by traders.
The currency pair is trading below its 20 Hr and 50 Hr moving averages.

Japanese Yen Reverses Its Gains In The Asian Session
For the 24 hours to 23:00 GMT, the USD declined 0.76% against the JPY and closed at 108.88.
The Japanese Yen gained ground against the USD, as investors fretted over the US President Donald Trump’s warning of the Federal Government shut-down if Congress fails to fund his long-promised border wall with Mexico.
In economic news, Japan’s final machine tool orders advanced more than initially estimated by 28.0% on an annual basis in July, after recording a gain of 31.1% in the previous month. The preliminary figures had indicated an advance of 26.3%.
In the Asian session, at GMT0300, the pair is trading at 109.17, with the USD trading 0.27% higher against the JPY from yesterday’s close.
The pair is expected to find support at 108.78, and a fall through could take it to the next support level of 108.4. The pair is expected to find its first resistance at 109.62, and a rise through could take it to the next resistance level of 110.08.
Looking forward, Japan’s national consumer price index for July, scheduled to release overnight, will be on investors’ radar.
The currency pair is showing convergence with its 20 Hr moving average and trading below its 50 Hr moving average.
