Sample Category Title
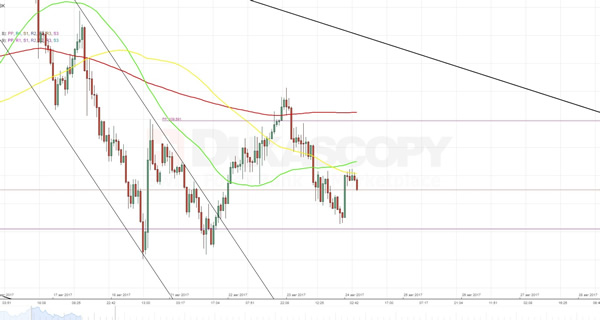
USD/JPY Analysis: Returns Back To 108.82
Unfortunately for the buck, the assumption about an existence of a short-term ascending channel did not confirm, as the currency rate once again slipped to the monthly S1. A quite sharp fall indicated that the pair had a chance bypass this support level, but in the early Thursday morning the Greenback started to actively recover ahead of the Jackson Hole symposium. An aggregate of technical indicators suggests the pair will continue to move downwards despite the two failed attempts to slide below the 108.82 level. That might be true, especially taking into account that the pair is simultaneously moving a senior descending channel. On the other hand, there will be also a release of the US housing data that might accelerate the fall, or help the buck to continue to recover further.
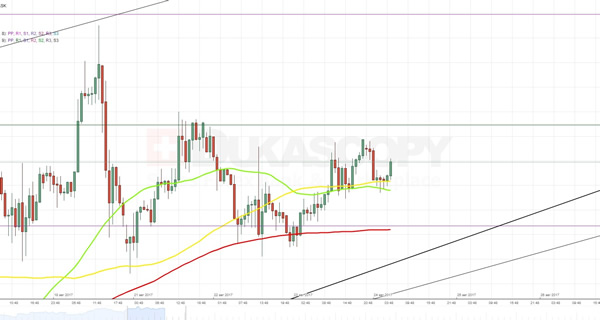
XAU/USD Analysis: Heads Towards 1,292.91
The way the bullion moved yesterday confirmed that a theory that a support area formed by a combination of the 200-hour SMA and the weekly PP near 1,284.70 was a stronger barrier than the 55- and 100-hour SMAs.
As a result, the pair broke to the top and has practically reached the monthly R1 at 1,292.91. Most probably, today the yellow metal is going to repeat this attempt. Such assumption is supported by an aggregate of technical indicators, which sends a strong buy signal. However, even if the gold will lose some value while waiting for beginning of the Jackson Hole Symposium, the drop is unlikely to go below the above combined support level.
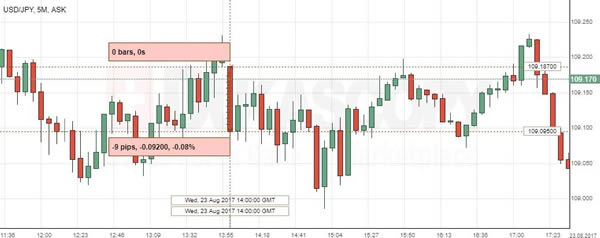
USD/JPY: New Home Sales
The report showing an unexpected drop in the US new home sales in July boosted an initial fall in the USD/JPY. The Yen strengthened against the US dollar by 0.08% to reach the 109.39 mark, albeit the pair returned to testing pre-data levels in the Thursday’s morning session.
The Commerce Department revealed that new home sales in the US fell 9.4% to a seasonally adjusted amount of 571K units in July, which was the strongest decline since December 2016. Weak figures raised concerns over the future recovery and healthy growth of the country’s property market. Data would be closely watched to evaluate whether enhanced supply conditions would help reinforce sales conditions in the next couple of months.
EUR/USD: German Flash Manufacturing PMI
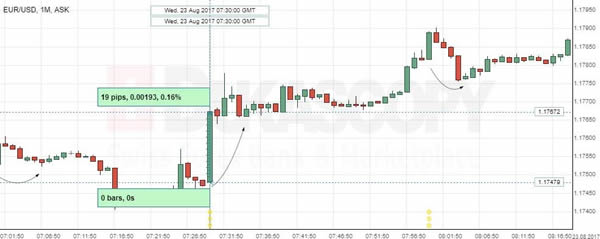
The EUR/USD currency pair started a robust increase after the August PMI reports for Germany and the Euro zone came in. The Markit report were published simultaneously with the ECB President’s Mario Draghi speech, which together with better-than-expected Germany’s data caused a 19 base points gain in the European single currency against the Greenback, while the following report for the EZ confirmed the upmove above the 1.1762 mark.
Markit showed that the German Flash Services PMI matched estimates with a 53.4 rate, while the Manufacturing Index rose to 59.4, despite expectations for a decline in August. Data are set to diminish concerns about the stronger Euro capable of affecting manufacturing growth.
Trade Idea: EUR/JPY – Stand aside
EUR/JPY - 128.99
New strategy :
Stand aside
Position: -
Target: -
Stop:-
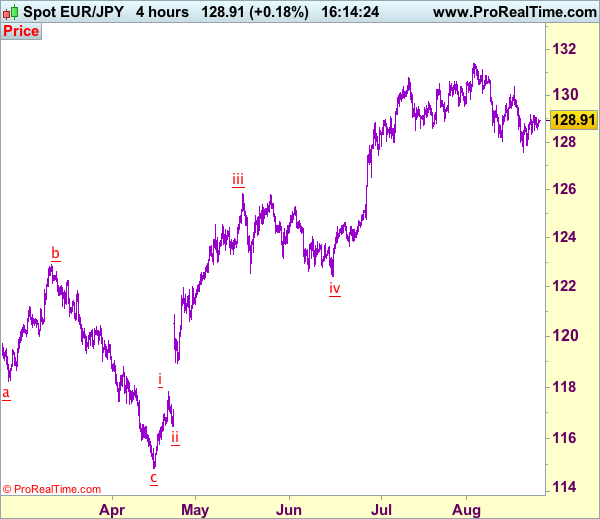
Although the single currency found good support at 127.56 last week and staged a rebound since, a firm break above indicated resistance at 129.18 is needed to signal low has been formed at 127.56, bring a stronger rebound to 129.50-60 and possibly towards 130.00. Looking ahead, only break of indicated resistance at 130.40 would revive bullishness and signal the fall from 131.40 has ended, then gain to 130.90-00 would follow.
On the downside, below 128.30-35 support would suggest the rebound from 127.56 has ended, bring weakness to 128.10-15, however, break of support at 127.84 is needed to signal the rebound from 127.56 (last week’s low) has ended, bring retest of this level, break there would signal the fall from 131.40 top is still in progress for retracement of early upmove to 127.00, then towards 126.50-60. As near term outlook is mixed, would be prudent to stand aside for now.
Our latest preferred count is that wave (ii) is ABC-X-ABC which ended at 123.33 and wave (iii) is unfolding with wave iii ended at 100.77, followed by wave iv at 111.57 and wave v as well as the wave (iii) has ended at 97.04, followed by wave (iv) at 111.43 and wave (v) has ended at 94.12 which is also the end of the larger degree v, this also implied the major wave (C) has also ended there, hence major correction has commenced from there with (A) leg unfolding in its lower degree wave c which has possibly ended at 145.69. Under this count, A-B-C wave (B) has commenced with A leg ended at 136.23, wave B at 143.79 and wave C has possibly ended at 149.79.
Our larger degree count is that the decline from 139.26 is wave (C) and is sub-divided into a diagonal triangle i-ii-iii-iv-v with wave i - 105.44, wave ii- 123.33, wave iii - 97.03, wave iv - 111.43, followed by the final wave v as well as the end of wave (C) at 94.12, this also mark the bottom of larger degree wave B. Under this count, major rise in wave C has commenced as an impulsive wave with minor wave III ended at 145.69, wave V is still in progress for further gain to 150.00. Having said that, this so-called wave V could well be the first leg of larger degree 5-waver wave C and this wave C should bring at least a retest of wave A top at 169.97 (July 2008).
Trade Idea: AUD/USD – Hold long entered at 0.7895
AUD/USD – 0.7878
Original strategy :
Bought at 0.7895, Target: 0.8050, Stop: 0.7865
Position: - Long at 0.7895
Target: - 0.8050
Stop: - 0.7865
New strategy :
Hold long entered at 0.7895, Target: 0.8050, Stop: 0.7865
Position: - Long at 0.7895
Target: - 0.8050
Stop:- 0.7835
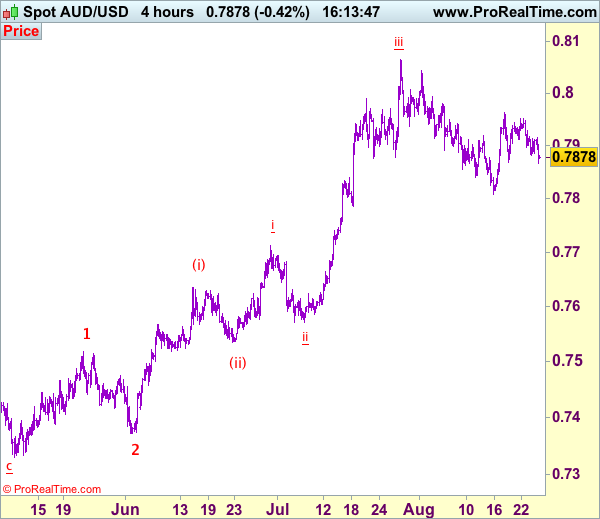
As aussie has slipped again after brief recovery to 0.7916, suggesting caution on our bullishness but as long as support at 0.7865-67 holds, prospect of another rebound remains, above 0.7916 would bring test of indicated resistance at 0.7963, break there would add credence to our view that low has possibly been formed at 0.7808 early last week, bring a stronger rebound to 0.8000, however, break there is needed to signal the pullback from 0.8066 top (wave iii peak) has ended at 0.7808 (wave iv) and bring eventual retest of this level.
In view of this, we are holding on to our long position entered at 0.7895. Below said support at 0.7865-67 would dampen this bullish scenario and suggest the rebound from 0.9808 has ended, bring another test of this level, below there would signal the wave iv correction from 0.8066 is still in progress for weakness to 0.7786 support, however, oversold condition should prevent sharp fall below 0.7750 and price should stay above i top at 0.7712, bring rebound later. We are keeping our latest bullish count that recent impulsive waves is unfolding as (1 2, (i)(ii), i ii) and may extend headway towards 0.8150.
On the 4-hour chart, the move from 0.8066 is the wave 5 with i: 0.8860, ii: 0.8315, wave iii is an extended move ended at 1.0183, iv: 0.9706 and wave v has ended at 1.1081 (also the top of entire wave 5). The subsequent selloff is the major correction which is unfolding as ABC-X-ABC and 2nd A leg has ended at 0.8848, followed by a-b-c wave B which ended at 0.9758, hence, 2nd C wave is now in progress and indicated downside target at 0.7000 and 0.6950 had been met, so further fall to 0.6710-20 cannot be ruled out.
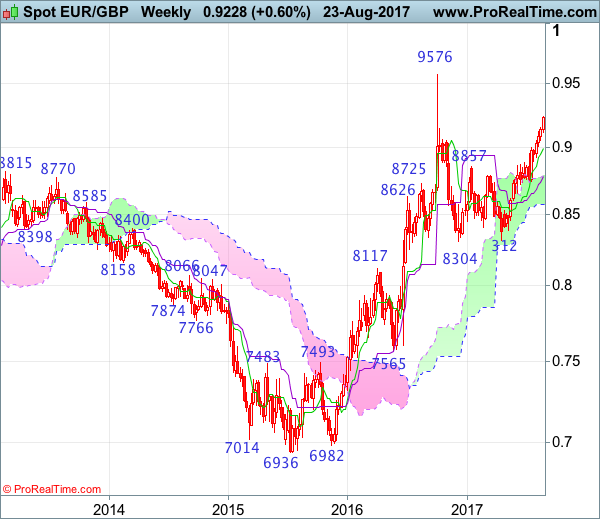
EUR/GBP Candlesticks and Ichimoku Analysis
Weekly
• Last Candlesticks pattern: N/A
• ime of formation: N/A
• Trend bias: Near term up
Daily
• Last Candlesticks pattern: Doji
• Time of formation: 21 Jul 2017
• Trend bias: Up
EURGBP – 0.9045
As the single currency has surged again this week, adding credence to our bullish view that medium term upmove is still in progress and upside bias remains for the uptrend to extend headway to 0.9250-55, then towards 0.9290-00, however, near term overbought condition should prevent sharp move beyond 0.9350-55 and price should falter below 0.9380-85 (100% projection of 0.8312-0.8950 measuring from 0.8743), risk from there is seen for a strong retreat to take place later.
On the downside, whilst initial pullback to the Tenkan-Sen (now at 0.9144) and 0.9100-10 cannot be ruled out, reckon 0.9060-65 would limit downside and brig another rise later. A daily close below the Kijun-Sen (now at 0.9033) would defer and risk test of support at 0.9008 but a daily close below there is needed to signal a temporary top is formed, bring test of previous resistance at 0.8950 and later towards 0.8895-00, having said that, reckon the upper Kumo (now at 0.8841) would contain downside, bring another rise later.
Recommendation: Buy again at 0.9070 for 0.9270 with stop below 0.8970.
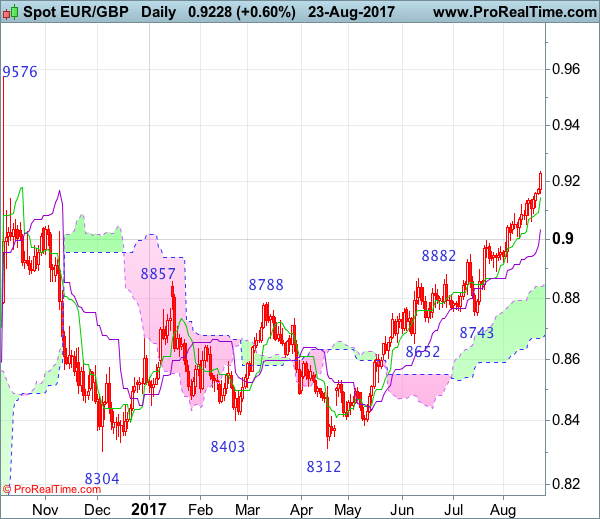
On the weekly chart, this week’s rally looks set to form another white candlestick (4th in a row), adding credence to our bullish view that recent erratic rise from 0.8304 is still in progress and upside bias remains for this move to extend gain to 0.9250-60, then 0.9300-10, however, near term overbought condition should limit upside to 0.9350 and reckon 0.9380-85 (100% projection of 0.8312-0.8950 measuring from 0.8743) would hold. Looking ahead, break there is needed to retain bullishness and signal the entire correction from 0.9576 top has ended at 0.8304 and encourage for further subsequent gain to 0.9450.
On the downside, although pullback to 0.9100-10 cannot be ruled out, reckon 0.9050-55 would limit downside and the Tenkan-Sen (now at 0.8990) should hold, bring another rise. A drop below support at 0.8891 would defer and suggest top is possibly formed, bring retracement of recent upmove to 0.885-60, then 0.8795-00 but reckon support at 0.8743 would hold. Only a weekly close below this support would retain bearishness for subsequent decline to 0.8650-55 but the lower Kumo (now at 0.8571) should remain intact, bring another rally later.
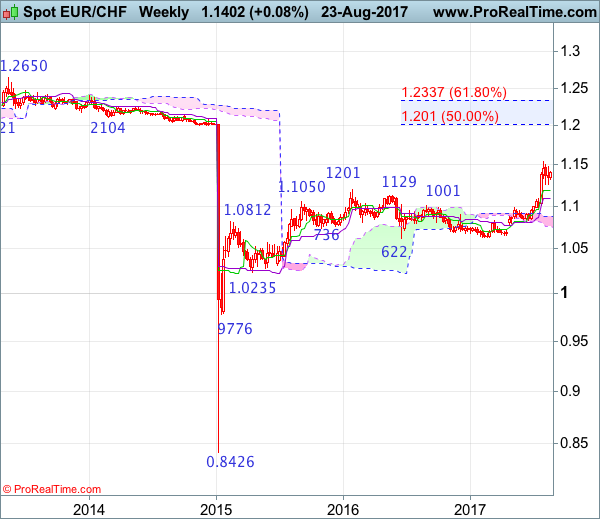
EUR/CHF Candlesticks and Ichimoku Analysis
Weekly
• Last Candlesticks pattern: Long white candlestick
• Time of formation: 24 Jul 2017
• Trend bias: Up
Daily
• Last Candlesticks pattern: Morning doji
• Time of formation: 25 Jul 2017
• Trend bias: Up
EUR/CHF – 1.1399
As the single currency found support at 1.1259 and has staged a strong rebound, suggesting the pullback from 1.1538 has possibly ended there and consolidation with mild upside bias would be seen for gain to 1.1444, however, break of resistance at 1.1479 is needed to add credence to this view, bring retest of this level later. Only a break of said recent high at 1.1538 would confirm recent upmove has resumed and extend headway to 1.1600-10, having said that, further sharp move beyond 1.1700 should not be repeated and price should falter below 1.1770-80, bring retreat later.
On the downside, whilst pullback to the Tenkan-Sen (now at 1.1369) cannot be ruled out, reckon support at 1.1343 would limit downside and bring another rise later. Below 1.1320 would risk weakness towards said support at 1.1259 but only break there would abort and extend the corrective fall from 1.1538 top for retracement of recent upmove to 1.1185 (50% Fibonacci retracement of 1.0833-1.1538), however, sharp fall below 1.1100-05 (61.8% Fibonacci retracement) should not be repeated and 1.1050 would hold, bring rebound later.
Recommendation: Buy at 1.1355 for 1.1555 with stop below 1.1255.

On the weekly chart, the single currency traded narrowly after retreating from recent high at 1.1538, retaining our view that consolidation below this level would be seen, however, support at 1.1259 should contain downside and bring another rise later, above 1.1479 resistance would signal the pullback from 1.1538 has ended and bring retest of this level. Only a break of this recent high would revive bullishness and extend the major rise from 0.8426 low for headway to 1.1590-00, then towards 1.1700-10, however, overbought condition should prevent sharp move beyond 1.1800 and reckon 1.1900-10 would hold from here, risk from there has increased for a retreat to take place later.
On the downside, expect pullback to be limited to 1.1320-25 and bring another rise later. Below said support at 1.1259 would bring test of the Tenkan-Sen (now at 1.1192), break there would defer and suggest a temporary top is formed instead, bring retracement of recent rise to 1.1100-05 (61.8% Fibonacci retracement of 1.0833-1.1538), then test of the Kijun-Sen (now at 1.1087) but reckon support at 1.0987 would remain intact.
USDJPY Neutral In Medium-Term, Downside Risk Remains Below Key 110 Level
USDJPY is neutral after pausing a decline at 108.60. Risk to the downside is high as there was a bearish signal from the crossover of the 50-day moving average (MA) with the 200-day MA on July 18. Momentum indicators are in bearish territory, with RSI below 50 and MACD below zero.
However, the RSI and MACD are no longer sloping down and are moving sideways, suggesting downside momentum has weakened and there is diminished risk for further declines in the near term. Prices are hovering near the key 109.00 level but a daily close below this would shift focus to the downside. First target is the August 18 low of 108.60 ahead of the round number at 108.00. An extension lower from this point would change the big picture and shift the bias to bearish from neutral.
USDJPY would need to rise back above 110.00 resistance to ease downward pressure. The level at 110.90 is an important barrier as it acted as resistance as well as support in the past. From here prices could resume upside towards the 50-day moving average (MA) at 111.33 and 200-day MA at 112.52. A move higher from this point would turn the focus to the July 11 peak at 114.49. This is the top of the medium-term range. Breaking above this area would shift the outlook to bullish.
EURUSD Still Consolidating In Short Term, Maintains Bullish Outlook
EURUSD has been consolidating since reaching a 2½-year high of 1.1909 on August 2. The 50-period moving average (MA) has flatlined on the 4-hour chart, pointing to a neutral bias in the short term and indicating that the strong rally that began in April has run out of steam.
However, the risk is to the upside as both the RSI and the MACD are in bullish territory. The RSI is trending down but remains comfortably above 50, while the MACD histogram is just above the red signal line.
To regain upside momentum, prices would need to break above the 23.6% Fibonacci retracement level of the July-August upleg from 1.1479 to 1.1909. The 23.6% Fibonacci level is also the 1.18 handle. A sustained rise above this level would open the towards the August peak of 1.1909, but before then, the pair might meet a hurdle at around the 1.1845 area, which previously acted as resistance. A break above 1.1909 would signal a resumption of the uptrend and reinforce the bullish outlook in the medium-term. The next key resistance after this point is the psychological 1.20 level.
To the downside, the 50-period MA at 1.1632 should be watched as a drop below this line would weaken the positive short-term bias, if not, push it to negative. Further down, support should come from the 38.2% and 50% Fibonacci levels at 1.1745 and 1.1695 respectively. Failure to hold above the 50% Fibonacci level could lead to a sharper correction and bring into view the 200-period MA (currently at 1.1665).
A drop below the 200-period MA could accelerate the decline towards the 50-day moving average on the daily chart, which is currently around 1.1560, threatening the medium-term bullish structure.