Sample Category Title
Forex Technical Analysis: EUR/USD, USD/JPY, GBP/USD
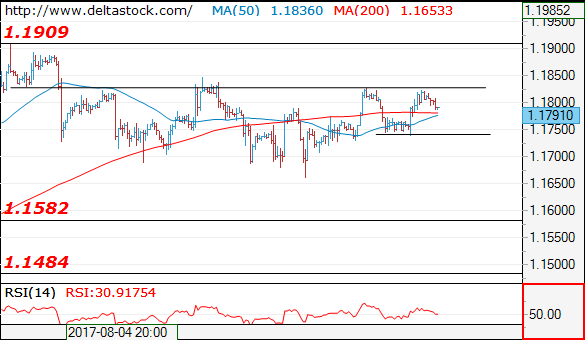
EUR/USD
Current level - 1.1791
Yesterday's low at 1.1740 is already a crucial one and a break through it will signal a renewal of the downtrend, towards 1.1580. Initial intraday resistance lies at 1.1830.
| Resistance | Support | ||
| intraday | intraweek | intraday | intraweek |
| 1.1830 | 1.1909 | 1.1740 | 1.1580 |
| 1.1850 | 1.2000 | 1.1580 | 1.1480 |
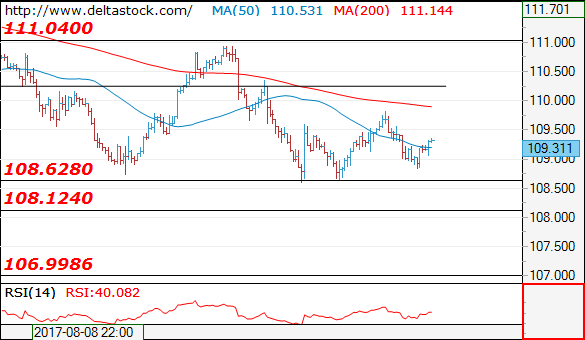
USD/JPY
Current level - 109.31
The overall outlook here remains bearish, for a break through 108.60, towards 108.10, en route to 107.00 area. Initial intraday hurdle lies at 109.80.
| Resistance | Support | ||
| intraday | intraweek | intraday | intraweek |
| 109.80 | 111.00 | 108.60 | 108.10 |
| 110.30 | 112.20 | 108.10 | 107.00 |
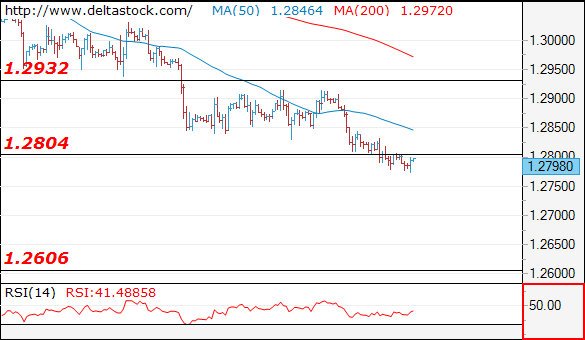
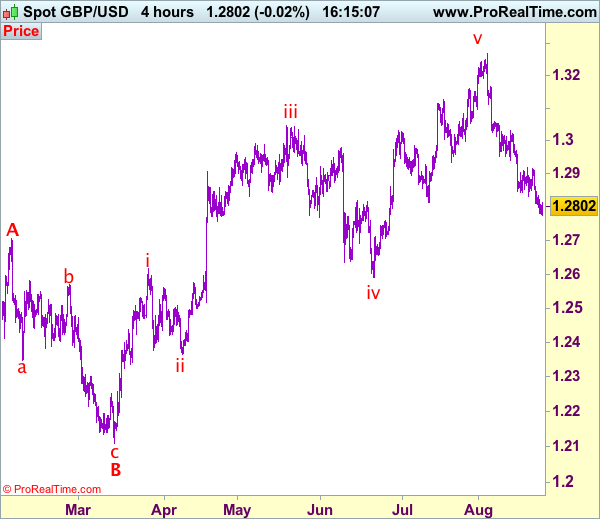
GBP/USD
Current level - 1.2798
The downtrend is intact, heading towards 1.2705, en route to 1.2600 area. Minor intraday resistance is projected at 1.2850 and crucial on the upside is 1.2915 high.
| Resistance | Support | ||
| intraday | intraweek | intraday | intraweek |
| 1.2850 | 1.3260 | 1.2705 | 1.2606 |
| 1.2930 | 1.3500 | 1.2606 | 1.2480 |
EUR/GBP Elliott Wave Analysis
EUR/GBP – 0.9216
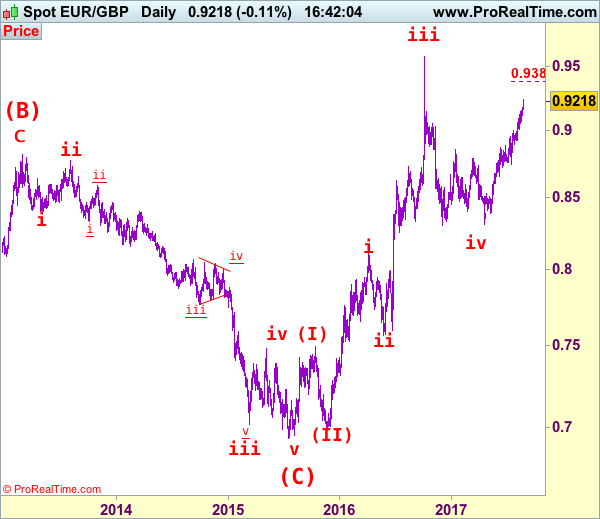
As the single currency has continued heading north, adding credence to our view that early retreat from 0.9576 (wave iii top) has ended earlier at 0.8304 and bullishness remains for the rise from there to extend further gain to 0.9290-00, then towards 0.9350, however, near term overbought condition should prevent sharp move beyond 0.9380-85 (100% projection of 0.8312-0.8950 measuring from 0.8743) and reckon 0.9400-10 would hold from here, risk from there is seen for a retreat due to near term overbought condition.
Our latest preferred count is that the wave V of a 5-wave series from 0.5682 ended at 0.9805 earlier and major from there has possibly ended at 0.8067 as A-B-C-X-A-B-C. We are keeping our view that the entire correction from 0.9805 has possibly ended at 0.7756 and as labeled as the attached daily chart and impulsive move from 0.9084 has ended at 0.6938 as a 5-waver which marked as the (C) wave, recent impulsive rise is labeled as (I) (II), (i) (ii) series, indicated upside target at 0.9084 had been met, the retreat from 0.9576 suggest wave iii ended there and next upside target for wave v of (III) should head towards 0.9700 but price should falter well below parity .
On the downside, whilst initial pullback to 0.9150, then 0.9105-10 cannot be rule out, reckon downside would be limited to 0.9060-65 and bring another rise later. A daily close below support at 0.9008 would defer and suggest a temporary top is possibly formed, risk correction to 0.8945-50, then 0.8920-25 but reckon downside would be limited to 0.8890-95 and bring another upmove later.
Recommendation: Buy at 0.9065 for 0.9265 with stop below 0.8965
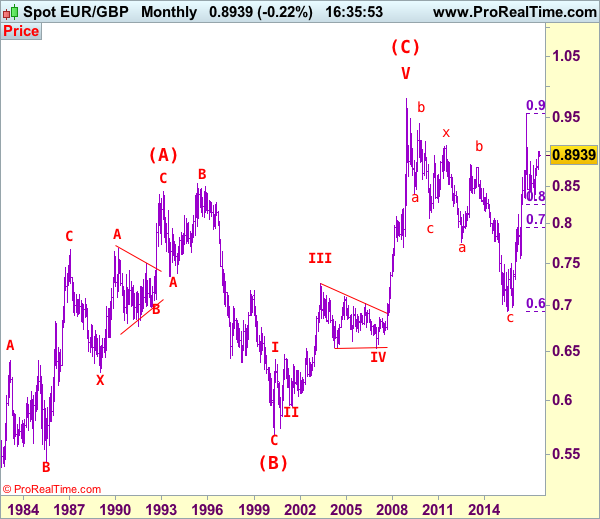
Euro's long term uptrend started in Feb 1981 at 0.5039 and is unfolding as a (A)-(B)-(C) move with (A): 0.8433 (Feb 1993), (B): 0.5682 (May 2000) and impulsive wave (C) should have ended at 0.9805 with wave III ended at 0.7254 (May 2003), triangle wave IV at 0.6536 (23 Jan 2007) and wave V as well as wave (C) has ended at 0.9805.
We are keeping an alternate count that only wave III ended at 0.9805 and the correction from there is the wave IV and has possibly ended at 0.6936, however, it is necessary to see a daily close above resistance at 0.9576 in order to change this to be the preferred count.
Investors Shaking Off Trump Concerns And Focused On Jackson Hole | Oil And Euro Lower
Markets move forward and it shows no concerns about Trump
US Government shutdown anxiety would resurface
Oil facing selling pressure due to inventory data
Euro lower against the dollar but up against Sterling
European markets have shaken off the anxieties of the US dysfunction and the focus has turned towards the Jackson Hole meeting. However, the days of Trump enacting his fiscal agenda are still looking darker. August is almost over and September could be the month of heightened volatility given the issues on hand.
Investors would remain highly sensitive to any new headlines around the US government shut down due to the debt ceiling hitting its boundary. This time the danger is real because the commander in chief is a completely unpredictable person and he has a capability to do anything. Traders are not responding positively to the US President's threats of shutting down the government.
He is using one of his tricks to get what he wants and does not seem to care about what could be the consequence of the US shutdown for the economy. The influence of such an event expands well beyond the US borders because it delivers the message that the country is not united. The investment community would respond even more adversely to that message. One can also say that such an event would leave its scar on the US debt ratings.
What matters the most for Mr Trump is to build the wall which he promised throughout his campaign. He seems to be determined on that in order to win more support of Americans and doesn't care about the message it delivers for the broader investment community.
Trump and his tweets would remain the focal point amid investors and a more adverse development could lead to a further collapse in the investor sentiment. He inserted another dose of uncertainty yesterday by menacing to pull out of NAFTA. Countries such as Canada and Mexico are leaving no stone unturned to make the agreement work. Basically, President Trump has up the ante on the tumultuous month which is full with tensions ranging from the geopolitics to shutting down the government.
The yellow metal is still struggling to move closer to the 1300 mark due to the dollar strength. An essential bullish signal would be if the price breaks the 1300 mark otherwise you can say that the uptrend has no energy. Janet Yellen could surprise the market with a less dovish approach however stagnant inflation should keep her in check. The reality is that you cannot fight the Fed or predict their action accurately every single time. The US new home sales data was underwhelming and this is the direct result of the higher interest rates. The focus will be on the existing new home sales and if we get the same message here, it would push the dollar lower and therefore the gold price could be vulnerable.
The oil price is still suffering from the crude inventory data print. Despite the fact that the headline number did show an inventory drawdown, investors are paying more attention to the fact that the drawdown was less deep as compared to the previous number and this is creating the selling pressure for the oil price.
The Euro didn't get much help from Mario Draghi's speech yesterday as it was carefully and colourlessly designed. Traders are hoping that they may get some juicy sauce during his speech. This could help them to see the internal frame work of the ECB's strategy as the bank is planning on to reduce its support for the market by curtailing its monthly purchase program.
USD/CAD Elliott Wave Analysis
USD/CAD – 1.2548
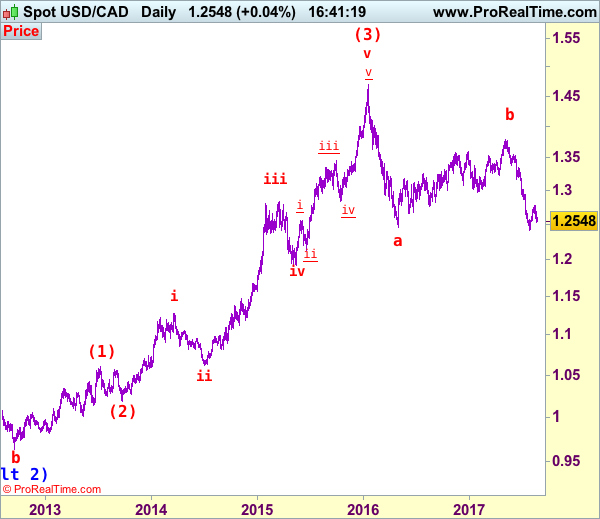
As the retreat from 1.2778 has kept price under pressure, suggesting the rebound from 1.2414 has possibly ended there and consolidation with downside bias is seen for weakness to 1.2490-00, then test of 1.2451, break of latter level would signal recent decline has resumed for retest of 1.2414. Having said that, break there is needed to confirm recent wave c decline is under way for weakness to 1.2350, then 1.2300 but loss of momentum should prevent sharp fall below 1.2200-10 and price should stay well above 1.2000 level, bring rebound later. We are keeping our bearish count that wave b ended at 1.3794 and wave c has commenced for further fall to aforesaid downside targets.
We are keeping our view that the wave b from 1.0657 (a leg top) has possibly ended at 0.9633 with (a): 0.9800, wave (b): 1.0447 and wave c at 0.9633, the subsequent rise from there is now treated as wave c exceeded indicated upside target at 1.3770-80 and 1.4000 and wave (3) has possibly ended at 1.4690 and wave (4) correction has commenced for retracement back to 1.2410-20, then towards 1.2200.
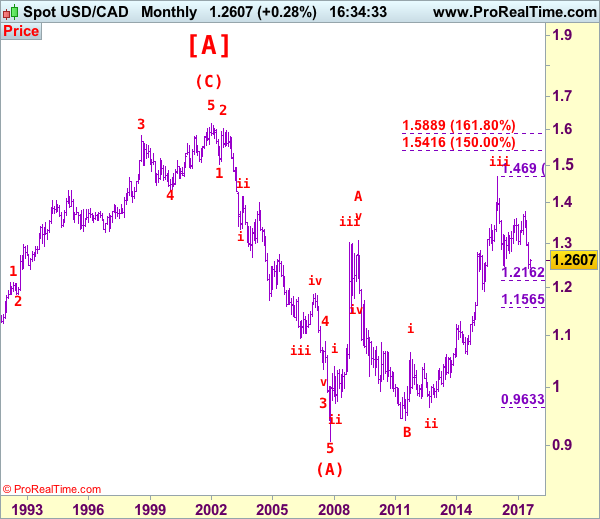
On the daily chart, our latest preferred count remains that the A of (B) rally from 0.9059 low (7 Nov 2007) unfolded into an impulsive wave with i: 0.9059-1.0380, ii ended at 0.9819, iii at 1.3019 followed by triangle wave iv at 1.2026 , then wave v formed a top at 1.3066 and also ended the wave A. The wave B is unfolding as an double three a-b-c-x-a-b-c and is sub-divided as a: 1.2192, b: 1.2716 and wave c at 1.0784, followed by wave x at 1.1725, another set of a-b-c unfolded with 2nd a at 0.9931, 2nd b at 1.0674. the 2nd c has possibly ended at 0.9407, therefore, consolidation with upside bias is seen for major correction, indicated target at 1.3900 had been met and gain to 1.4700 would follow.
On the upside, whilst initial recovery to 1.2590-00 cannot be ruled out, reckon upside would be limited to 1.2650–60 and renewed selling interest should emerge there, bring another decline to aforesaid downside targets. Above resistance at 1.2691 would signal the retreat from 1.2778 has ended instead, bring another corrective bounce to this level and later towards previous support at 1.2859 but upside should be limited to resistance at 1.2944 and upside should falter well below psychological resistance at 1.3000, bring another decline later.
Recommendation: Sell at 1.2650 for 1.2450 with stop above 1.2750.
Longer term - The selloff from 1.6194 (21 Jan 2002) to 0.9059 (07 Nov 2007) is viewed as (A) wave which is a 5-waver as labeled on the monthly chart as below, the subsequently rally is labeled as (B) with impulsive A leg of (B) ended at 1.3066, wave B of (B) is unfolding which has either ended at 0.9407 or would extend one more fall but downside should be limited to 0.9200 and 0.9000 should hold.
Technical Outlook: GBPUSD Remains Under Strong Pressure Ahead Of UK Data
Cable hit new low at 1.2773 on Thursday, in extension of strong fall in past two days that eventually broke below daily cloud and took out another strong support at 1.2811 (12 July trough), generating strong bearish signal for continuation of the downtrend from 1.3268 (03 Aug peak). Bearish studies maintain negative near-term outlook for extension towards next target at 1.2749 (Fibo 76.4% of 1.2588/1.3268), with 200SMA (1.2649) expected to come in focus on stronger bearish acceleration. Formation of 10/100SMA bear-cross (1.2883) adds on existing bearish pressure, with broken daily cloud base now acting as strong resistance (spanned between1.2857/1.2912). Broken cloud base offers initial resistance at 1.2857, followed by 10/100SMA bear-cross (1.2883) and falling Tenkan-sen at 1.2897. Only acceleration above daily cloud would sideline bearish pressure and signal correction. UK data are in focus today, with Q2 GDP expected to come in line with previous releases (0.3% q/q, 1.7% y/y), while business investments are expected at 0.4% vs 0.6% in Q1. Weaker releases could further hurt already weak pound, while stronger than expected releases would inflate sterling.
Res: 1.2813, 1.2833, 1.2857, 1.2883
Sup: 1.2773, 1.2749, 1.2715, 1.2649
Technical Outlook: EURUSD Holds Above Bullish Flag But Still Within The Range
The Euro edged lower in Asia / early Europe after Wednesday's rally probed above 1.1800 again but was capped under Monday's high at 1.1828. The price holds within 1.1.1731/1.1828 range for the fourth straight day, with the action being supported by daily Tenkan-sen (1.1750) and daily studies in bullish setup supportive for further advance through 1.1828/46 pivots. The price is holding above the upper boundary of bullish flag that was formed on daily chart and generated signal for bullish continuation. Broken flag's upper resistance line now turned to solid support at 1.1770, followed by daily Tenkan-sen at 1.1750. Corrective easing should be ideally contained above these supports to keep near-term bulls in play. Increased downside risk could be expected on violation of Tenkan-sen support which would expose lower pivots at 1.1724/1.1694 (rising 30SMA / daily Kijun-sen. Jackson Hole meeting starts today with markets awaiting the speech ECB President Draghi, looking for firmer signals of tightening of the ECB's policy and QE tapering. However, sources close to Mario Draghi said that he may not talk about these subjects in Jackson Hole symposium but focus on the theme of the meeting regarding global economy.
Res: 1.1823, 1.1828, 1.1846, 1.1889
Sup: 1.1770, 1.1740, 1.1724, 1.1708

Trade Idea: GBP/USD – Sell at 1.2910
GBP/USD – 1.2787
Original strategy :
Sell at 1.2910, Target: 1.2710, Stop: 1.2970
Position: -
Target: -
Stop: -
New strategy :
Sell at 1.2910, Target: 1.2710, Stop: 1.2970
Position: -
Target: -
Stop:-
Although cable has remained under pressure and weakness to 1.2750-60 cannot be ruled out, loss of downward momentum should prevent sharp fall below 1.2730-35 and previous support at 1.2706 should remain intact, bring rebound later, above 1.2840-45 would bring recovery to 1.2875-80, however, resistance at 1.2917-18 should limit upside and bring another selloff later.
In view of this, would not chase this fall here and would be prudent to sell cable on recovery as said resistance at 1.2917-18 should limit upside, bring another decline. Above 1.2970-80 would defer and risk a stronger rebound to 1.3000 and possibly test of resistance at 1.3032, however, only break of latter level would abort and signal the fall from 1.3269 has ended instead, bring a stronger rebound to 1.3059 and possibly towards 1.3100 but previous support at 1.3112 (now resistance) should remain intact.
Our preferred count on the daily chart is that cable's rebound from 1.3500 (wave (A) trough) is unfolding as a wave (B) with A ended at 1.7043, followed by triangle wave B and wave C as well as wave (B) has ended at 1.7192, the subsequent selloff is the larger degree wave (C) which is still unfolding with minor wave (III) of larger degree wave 3 ended at 1.1986, hence wave (IV) correction is in progress which could either be a triangle wave (IV) of a complex formation but upside should be limited to 1.3500 and price should falter well below 1.4000, bring another decline in wave (V) of 3 for weakness to 1.1500, then 1.1200.
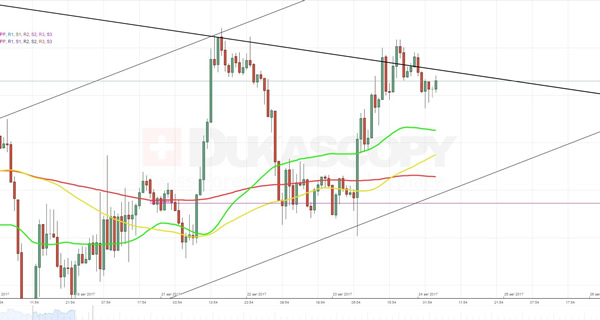
EUR/USD Analysis: Surges As Draghi Speaks
As it was expected, previous trading session the currency exchange rate spent in an upward movement that was inspired to some extent by a combination of the weekly PP together with the 100- and 200-hour SMAs, but mostly by a speech delivered by Mario Draghi in the early morning. The only unexpected thing was that the pair managed to cross the upper boundary of a senior descending channel.
On the other hand, this overstepping had a short-term effect, which means that the pair might return back into formation. However, an aggregate of technical indicators for the 5H and 1D timeframes suggests that the rate is going to continue the surge. In the meantime, market sentiment stays 70% bearish.
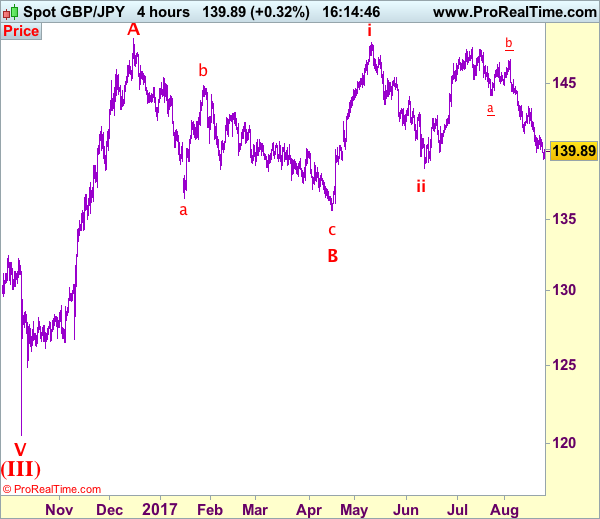
Trade Idea: GBP/JPY – Sell at 141.40
GBP/JPY - 139.90
Original strategy:
Sell at 141.40, Target: 139.40, Stop: 142.00
Position: -
Target: -
Stop: -
New strategy :
Sell at 141.40, Target: 139.40, Stop: 142.00
Position: -
Target: -
Stop:-
Although the British pound has remained under pressure after resuming recent decline, loss of downward momentum should prevent sharp fall below 139.00 and reckon previous support at 138.70 would hold on first testing, risk from there has increased for a corrective rebound to take place soon.
In view of this, would not chase this fall here and we are looking to sell sterling on subsequent recovery as 141.40-50 should limit upside and bring such a decline. Only a break of resistance at 142.05 would suggest low is possibly formed instead, bring a stronger rebound to 142.50-60 but resistance at 143.20 should remain intact and bring another decline later.
Our preferred count is that larger degree wave V with circle is unfolding from 251.12 with wave (I) 219.34, (II): 241.38 and wave (III) is subdivided into 1: 192.60, 2: 215.89 (23 Jul 2008) and wave 3 ended at 118.87 earlier in 2009. The correction from there to 162.60 is wave 4 which itself is a double three and is labeled as first a-b-c ended at 151.53, followed by wave x at 139.03, 2nd a ended at 162.60, 2nd b at 146.75 and 2nd c leg of wave 4 ended at 163.00. Therefore, the decline from 163.00 to 116.85 is now treated as wave 5 which also marked the end of larger degree wave (III), hence wave (IV) major correction has commenced for retracement of the wave (III) from 241.38 and upside target at 183.95-00 (50% Fibonacci retracement of the wave (II) from 241.38) had been met, a drop below 160.00 would suggest wave (IV) has ended at 195.85, bring decline in wave (V) for initial weakness to 130 (already met) and 120.
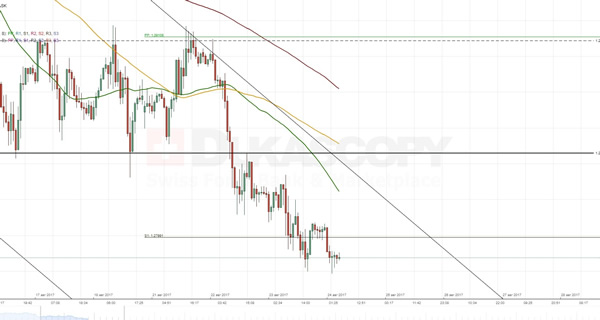
GBP/USD Analysis: Expectedly Passes 1.2799
As forecasted on Wednesday, the British Pound continued to lose value against the American Dollar and slipped right through the weekly S1, which is located at the 1.2199 level. Such outcome additionally confirms that the pair is moving in a clearly expressed downtrend.
As a result, the exchange rate has no technical indicators on its way that might force it to start moving in the opposite direction. For instance, the closest support level, which is set up by the weekly S2, is located only at the 1.2720 level. On the other hand, at 8:30 GMT there will be a release a Second Estimate GDP that might cause certain volatility and lead to a short-term recovery of the Sterling.