Sample Category Title
Canada’s employment rises 91k in Dec, unemployment rate down to 6.7%
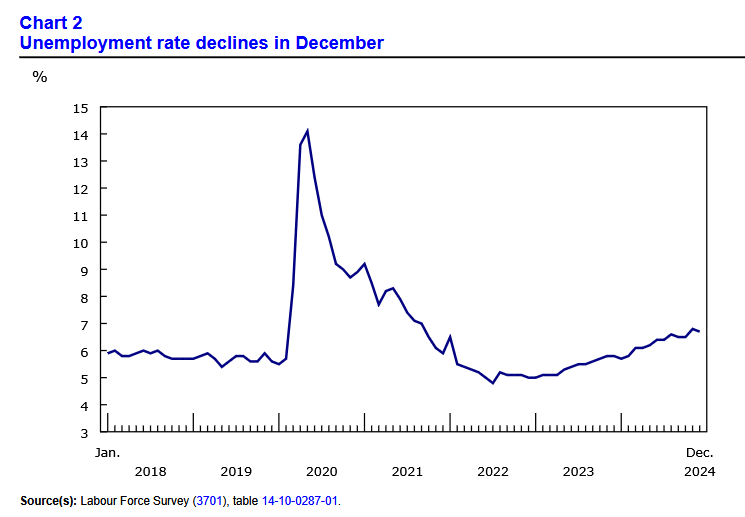
Canada's labor market closed 2024 on a strong note, with employment soaring by 91k in December, far exceeding expectations of 24.9k. Full-time positions accounted for a significant portion of the gains, with 56k new roles added.
Unemployment rate fell to 6.7%, defying expectations of an increase to 6.9%, and marked an improvement from the previous month's 6.8%. Employment rate also increased by 0.2 percentage points to 60.8%, marking the first uptick since January 2023.
Total hours worked rose 0.5% mom and were 2.1% higher than a year earlier. Meanwhile, average hourly wages grew 3.8% yoy, a deceleration from November’s 4.1% yoy.
US NFP grows 256k, unemployment rate ticks down to 4.1%
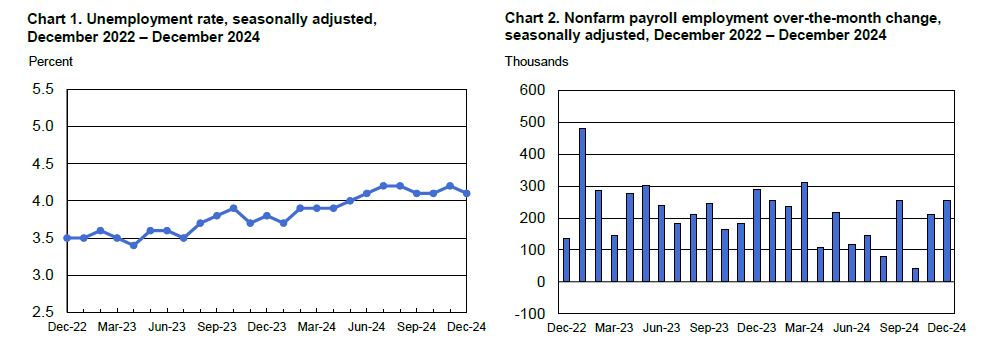
US labor market showcased its resilience in December, with non-farm payrolls surging by 256k, significantly outpacing expectations of 150k. This impressive figure also surpassed the average monthly gain of 186k for 2024.
Unemployment rate edged down to 4.1%, beating forecasts of remaining steady at 4.2%. This marks the seventh consecutive month where the unemployment rate has hovered within a tight range of 4.1% to 4.2%, reflecting a steady labor market. Meanwhile, the labor force participation rate held steady at 62.5%, a level consistent with its range since late 2023.
Wage growth showed a measured pace, with average hourly earnings rising by 0.3% mom, in line with market expectations. On a yearly basis, wage growth softened slightly to 3.9% from 4.0% yoy previously.
AUD/USD: Bears Pressure Key Support as Markets Await Release of US Labor Report
AUD/USD remains firmly in red and pressuring key support at 0.6170 (2022 low) after a brief recovery was repeatedly rejected above falling 20DMA and formed a double bull-trap on daily chart.
Bearish daily studies maintain downside pressure, though further headwinds in this zone should be anticipated as indicators are entering oversold territory.
On the longer run, the Aussie dollar may come under increased pressure if Trump’s administration proceeds with promised tariffs on China, while near-term focus is on US labor report (due later today) which would provide fresh direction signals.
Sustained break of 0.6170 trigger to open way for test of Fibo support at 0.6099 (76.4% retracement of 0.5509/0.8087) and expose psychological 0.60 level.
On the flip side, falling 10DMA offers immediate resistance at 0.6209, followed by more significant barriers at 0.6246 (20DMA) and 0.6302 (Jan 6 recovery spike), with break of the latter to sideline larger bears and allow for possible stronger correction.
Res: 0.6209; 0.6246; 0.6302; 0.6330.
Sup: 0.6170; 0.6099; 0.6040; 0.6000.
New Zealand Dollar Near Two-Year Low: USD and China are ‘to Blame’
The NZD/USD pair has fallen to 0.5590 as of Friday, marking a two-year low driven by a strong US dollar and concerns over China’s economic performance. The decline in the New Zealand dollar comes ahead of the release of the US jobs report for December, a critical data point that will shape market expectations for the Federal Reserve’s monetary policy trajectory. Investors largely anticipate that the Fed will maintain its cautious stance on rate adjustments, lending strength to the USD while pressuring other currencies.
US factors weighing on NZD/USD
The Federal Reserve’s December meeting minutes highlighted ongoing concerns about inflation. The minutes revealed the Fed’s reluctance to implement aggressive monetary policy easing considering persistent inflation risks. Adding to this cautious approach are fears that US President-elect Donald Trump’s proposed tariff policies could soon exacerbate inflationary pressures. As a result, the Fed is unlikely to ease monetary conditions quickly or extensively, providing robust support for the US dollar.
China’s economic challenges impacting the NZD
Weak inflation data from China, New Zealand’s largest trading partner, adds to the NZD’s troubles. The subdued inflation figures point to waning domestic demand in China, a worrying signal for global trade-dependent economies like New Zealand. Weak Chinese demand for goods and commodities directly threatens New Zealand’s exports, further pressuring the NZD/USD pair.
New Zealand’s domestic struggles
Domestically, New Zealand is grappling with a deep recession driving expectations of further monetary easing. The Reserve Bank of New Zealand (RBNZ) will meet in February, and the baseline scenario points to another 50-basis-point rate cut, reducing the official cash rate from the current 4.25% to 3.75%. By the end of 2025, the rate could decline to around 3.00% as the RBNZ seeks to support the struggling economy with more affordable credit.
To sum up, rising recessionary pressures, weak domestic demand, and limited external demand from China paint a challenging picture for the New Zealand dollar.
Technical analysis of NZD/USD
On the H4 chart, the NZD/USD continues its downward trajectory after breaking below the critical level of 0.5785. The market has formed a consolidation range around 0.5612, likely to resolve with a bearish breakout. The next target lies at 0.5530, where a brief correction to retest the 0.5612 level (from below) is possible. A sustained break below 0.5530 could pave the way for an extended decline towards 0.5200, the primary target for the ongoing downtrend.
This scenario is supported by the MACD indicator, with its signal line positioned below the zero mark and pointing downward, indicating strong bearish momentum.
On the H1 chart, the market shows a consolidation range around 0.5612, signalling indecision. However, a downward breakout is expected, paving the way for a continued drop to 0.5530. Following this, a corrective wave back to 0.5612 is possible before the pair resumes its descent toward 0.5200.
The Stochastic oscillator supports this outlook, with its signal line hovering near the 20 level. This reflects intense downside pressure and validates the continuation of the bearish trend.
Broader outlook
The outlook for NZD/USD remains bearish, driven by both domestic and global factors. The Fed’s cautious approach, coupled with a robust US dollar and weak Chinese demand, presents formidable challenges for the NZD. Domestically, New Zealand’s recessionary pressures and anticipated rate cuts by the RBNZ are likely to keep the currency under sustained pressure.
Unless there is a significant reversal in China’s economic conditions or a shift in the Federal Reserve’s policy stance, the NZD/USD pair is expected to remain downward, with 0.5200 emerging as a key level to watch.
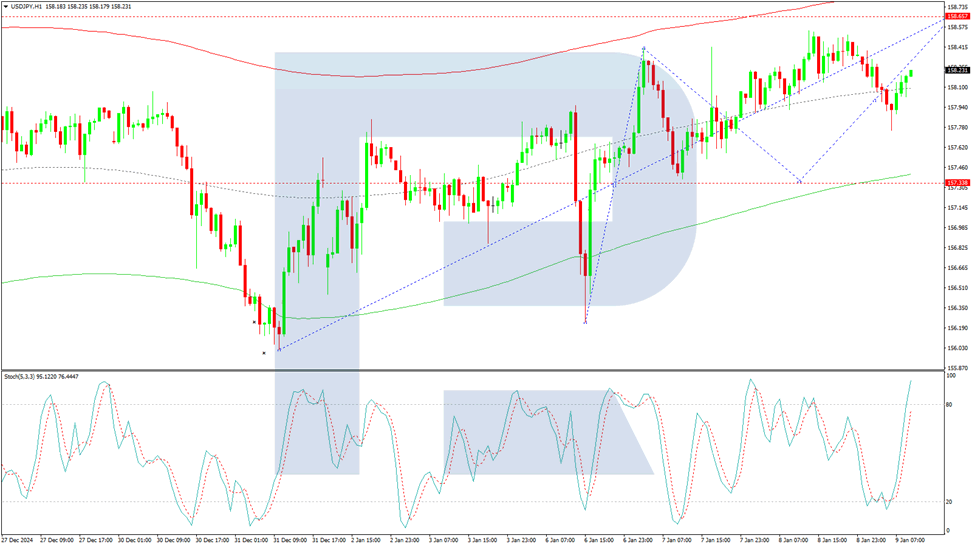
Japan’s Household Spending Declines, Yen Edges Higher
The yen is slightly higher on Friday. In the European session, USD/JPY is trading at 157.89, down 0.12% on the day.
Japan’s household spending continues to decline
Japanese consumers are holding tight on the purse strings and that could spell tr0uble for Japan’s fragile economy. Annually, household spending declined by 0.4% in November, following a 1.3% decline in October and above the market estimate of -0.6%. This marked a fourth straight decrease. Spending was weak in most categories, with the exceptions of housing and education. Monthly, household spending rose 0.4%, well below the October gain of 2.9%, which was a 14-month high. The reading easily beat the market estimate of -0.9%.
The household spending report comes on the heels of the November wage growth report, which was mixed. Nominal wages jumped 3% but real wages, which are adjusted for inflation, came in at -0.3%, marking a fourth consecutive month of negative real wage growth.
US nonfarm payrolls expected to decelerate
The US wraps up the week with nonfarm payrolls for December. With inflation largely in check, the Federal Reserve is keeping a close eye on the health of the labor market as the Fed reduces interest rates. The labor market has been cooling slowly but not deteriorating too quickly and the Federal Reserve would like to keep it that way. Nonfarm payrolls are expected at 160 thousand, after a gain of 227 thousand in November.
The Federal Reserve minutes had little impact on the movement of the US dollar but were significant in reiterating that the Fed plans to go slow on rate cuts in 2025. The minutes raised concern about the upside risk of inflation due to Trump’s pledges to enact tariffs and respond to illegal immigration with mass deportations. The Fed can be expected to gradually cut rates, which likely means increments of 25 basis points.
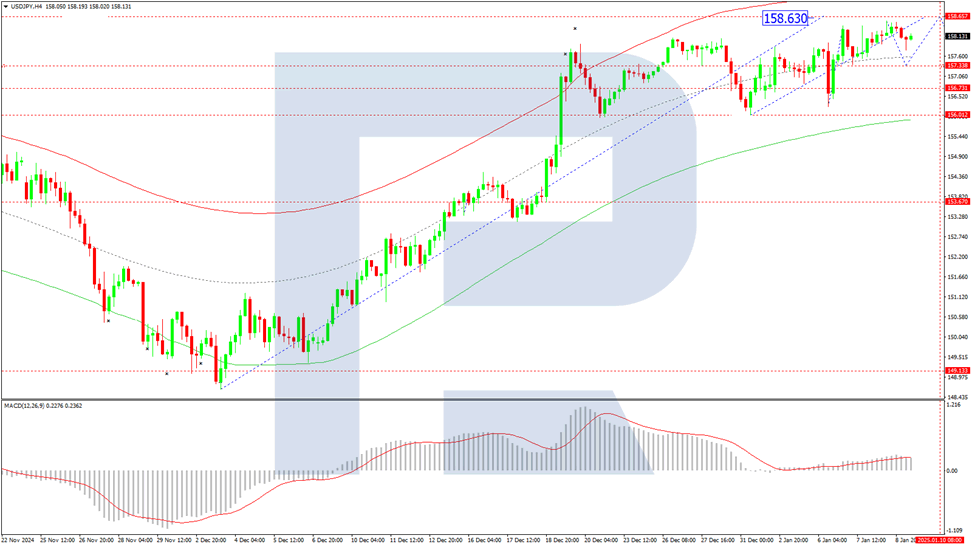
USD/JPY Technical
- USD/JPY is testing support at 158.04. Below, there is support at 157.69
- There is resistance at 158.51 and 158.86
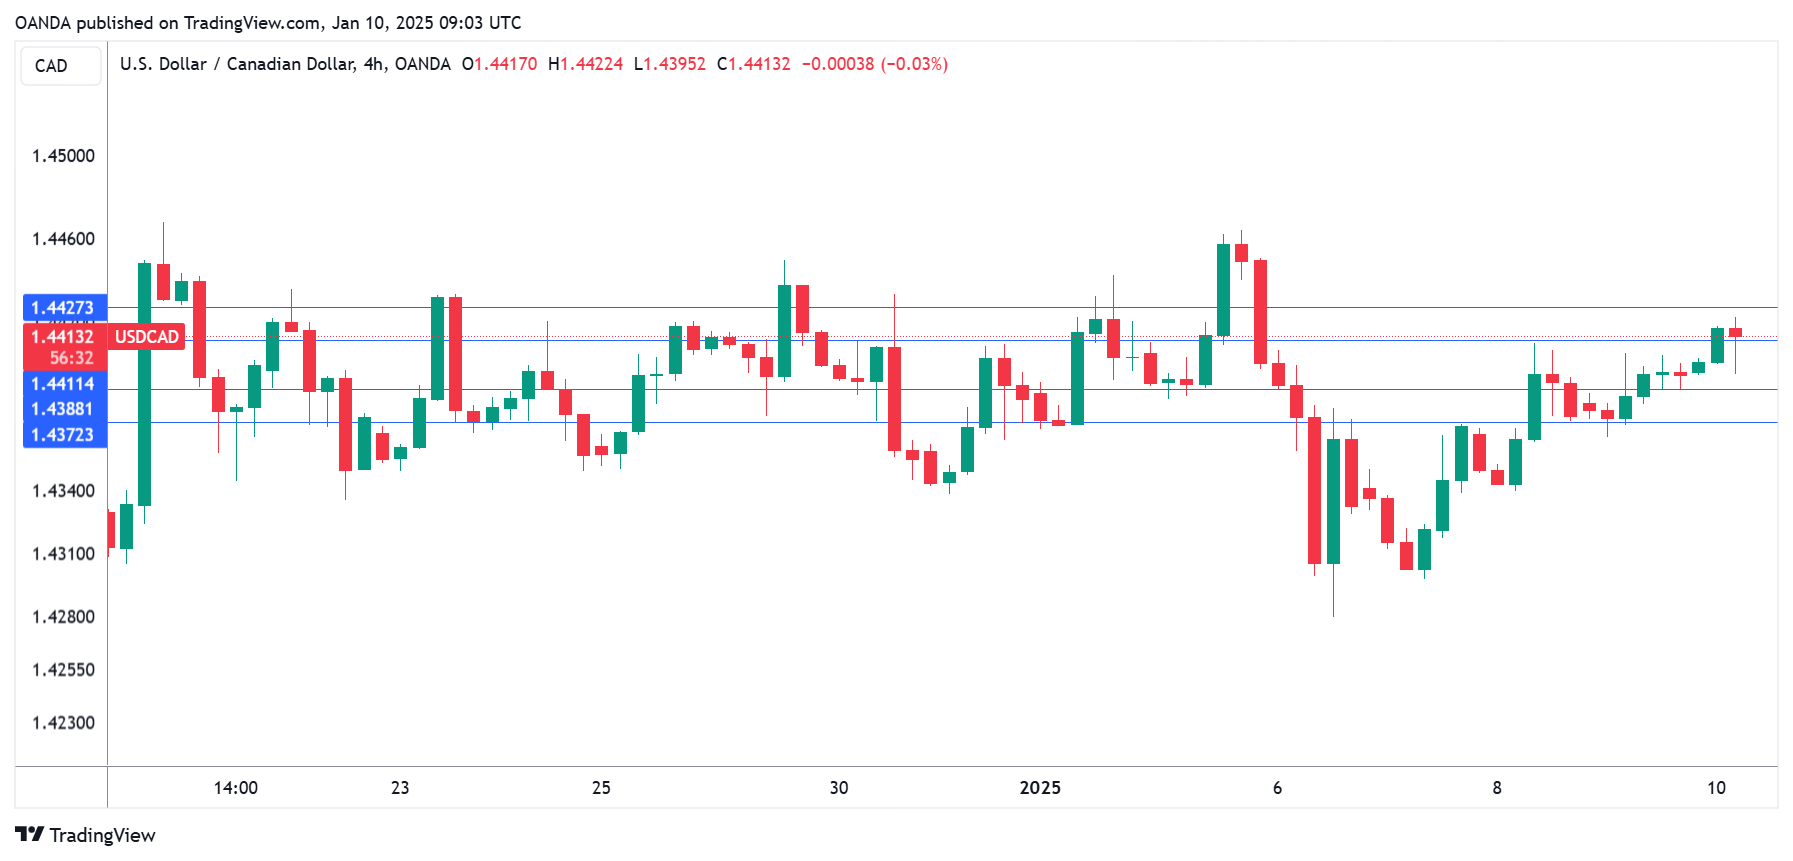
USD/CAD in Holding Pattern Ahead of US, Cdn. Jobs Data
The Canadian dollar started the week with strong gains but has shown little movement since then. In the European session, USD/CAD is trading at 1.4411, up 0.12% at the time of writing. We could see stronger movement from the Canadian dollar in the North American session, with the release of Canadian and US employment reports.
Canadian employment expected to ease in December
Canada’s economy may not be in great shape but the labor market remains strong. The economy added an impressive 50.5 thousand jobs in November and is expected to add another 24.9 thousand in December. Still, the unemployment rate has been steadily increasing and is expected to tick up to 6.9% in December from 6.8% a month earlier. A year ago, the unemployment rate stood at 5.8%. This disconnect between increased employment and a rising unemployment rate is due to a rapidly growing labor market which has been boosted by high immigration levels.
Another sign that the labor market is in solid shape is strong wage growth. Average hourly wages have exceeded inflation and this complicates the picture for the Bank of Canada as it charts its rate path for early 2025. The BoC has been aggressive, delivering back-to-back half point interest rate cuts in October and December 2024. Inflation is largely under control as headline CPI dipped to 1.9% in November from 2% in October. However, core inflation is trending around 2.6%, well above the BoC’s target of 2%. The central bank is likely to take a more gradual path in its easing, which likely means that upcoming rate cuts will be in increments of 25 basis points. The BoC meets next on Jan. 29.
In the US, all eyes are on today’s nonfarm payrolls report. The market estimate stands at 160 thousand for December, compared to 227 thousand in November. The US labor market has been cooling slowly and the Federal Reserve would like that trend to continue as it charts its rate cut path for the coming months. An unexpected reading could have a strong impact on the direction of the US dollar in today’s North American session.
USD/CAD Technical
- USD/CAD is testing resistance at 1.4411. Above, there is resistance at 1.4427
- 1.4388 and 1.4372 are the next support levels
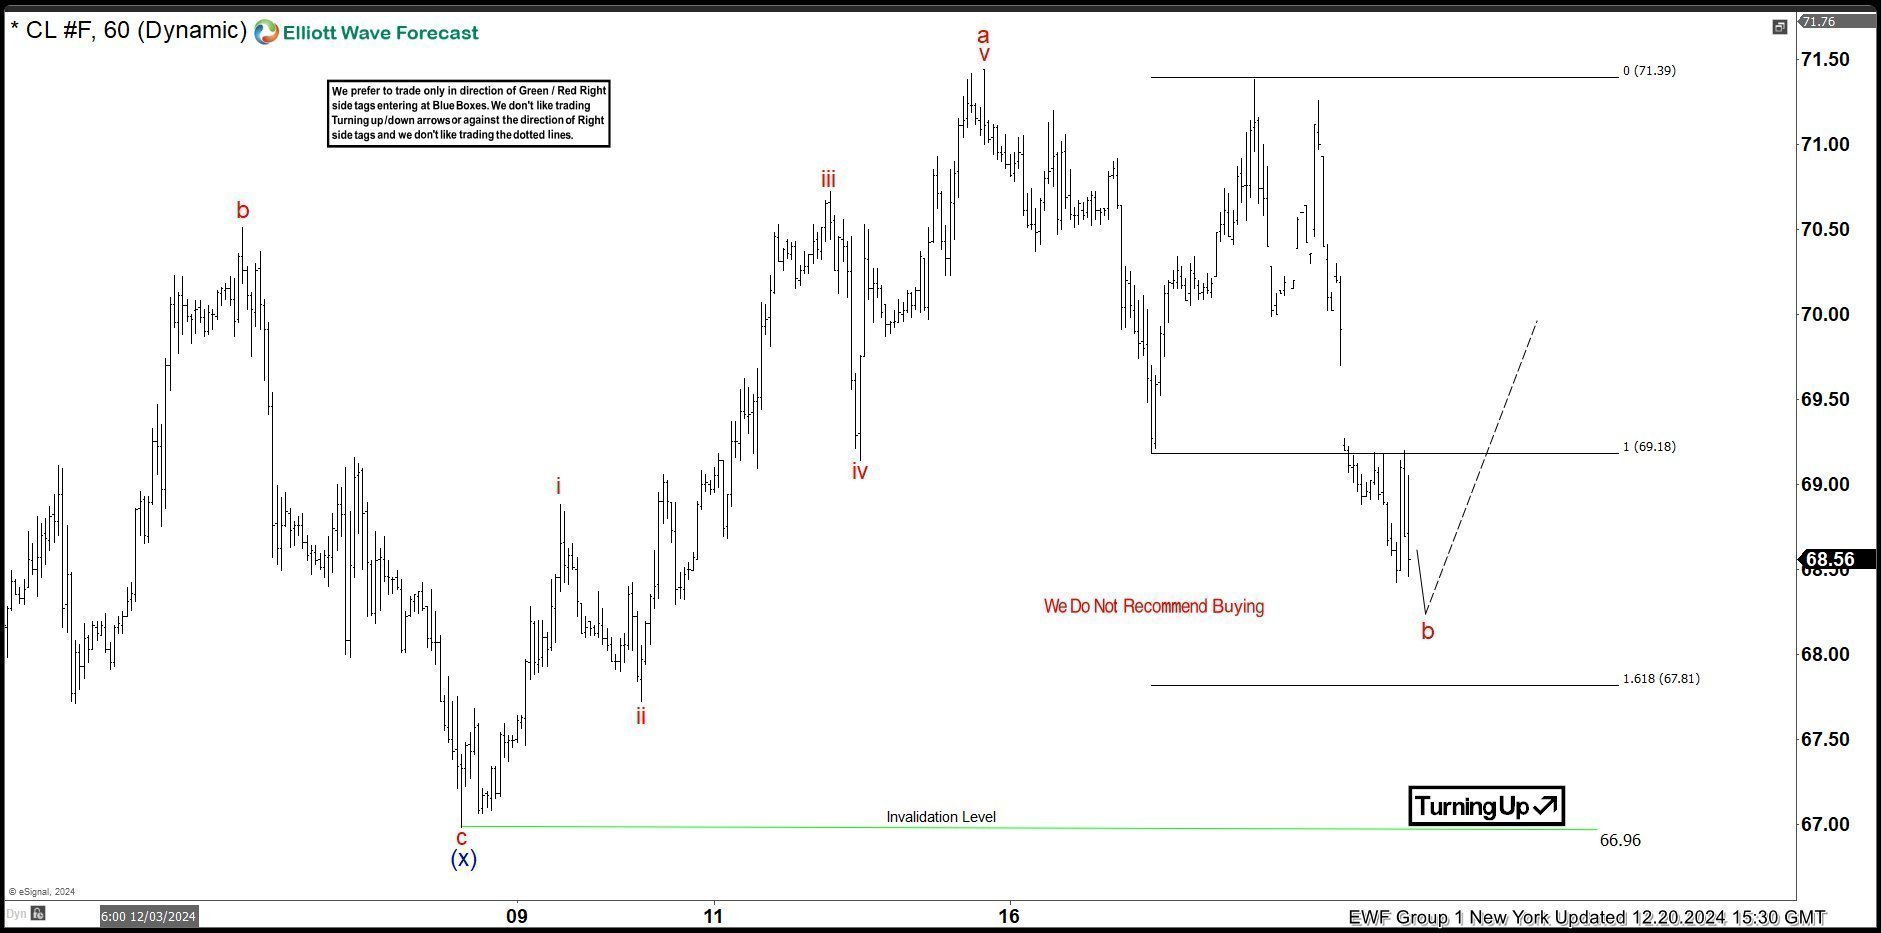
OIL (CL_F) Elliott Wave Forecasting the Rally After 3 Waves Pull Back
In this technical article we’re going to take a quick look at the weekly Elliott Wave charts of Oil Futures (CL_F) , published in members area of the website. As many of our members are aware, the commodity has given us decent rally recently. In the following sections, we’ll delve into the Elliott Wave pattern and explain the forecast.
OIL H1 Update 12.20.2024
The commodity is giving us correction against the 66.96 low. The pullback has already reached the extreme zone at 69.18-67.81, and we believe buyers should take the lead soon. At this stage, we advise against forcing trades in OIL . We expect buyers to push the price higher from the marked extreme zone, ideally toward new highs.
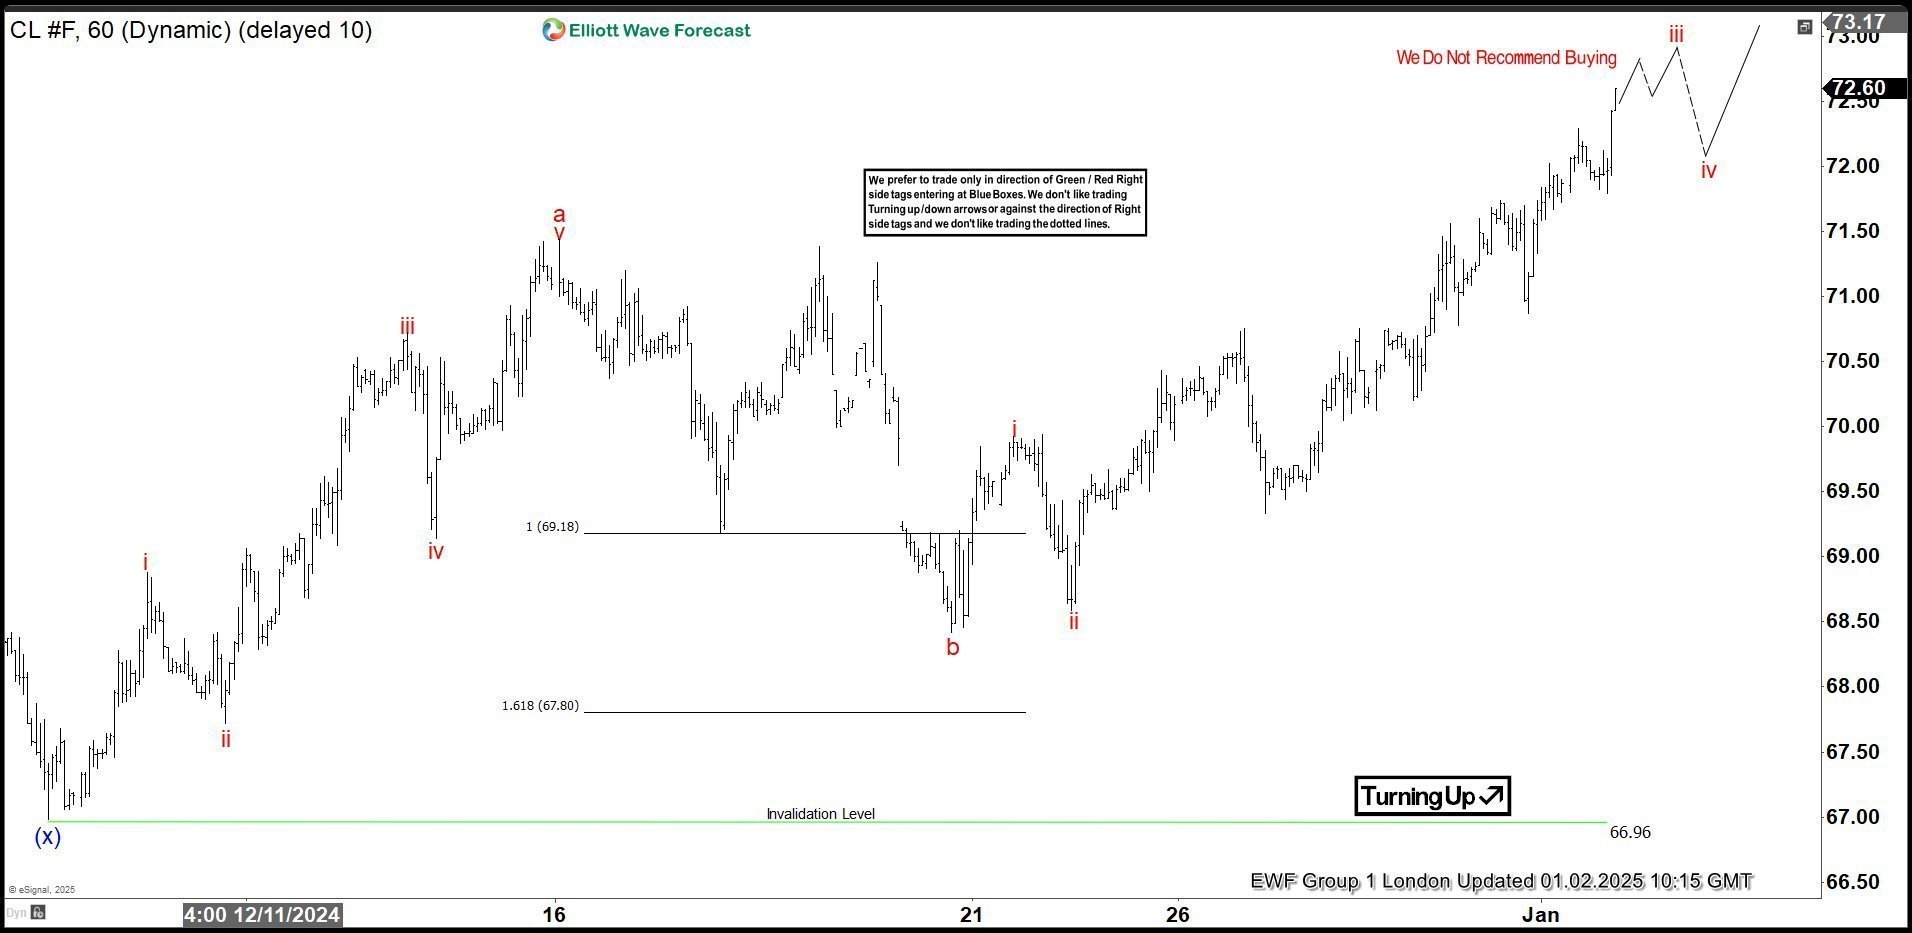
OIL H1 Update 01.02.2025
OIL responded exactly as expected. It found buyers at the Extreme Area ( 69.18-67.81) , making rally toward new highs. CL_F should ideally keep finding intraday buyers in 3,7,11 swings against the 66.96 pivot.
Bitcoin Fails to Hold Above $100k and Drops to a 2024 Low
According to the BTC/USD chart today, the price of the leading cryptocurrency has fallen below its 30 December 2024 low near the $91,800 level, thereby marking a new low for 2025.
Bearish sentiment may, in part, be driven by the US government’s reported intention to sell Bitcoin confiscated from Silk Road (an online marketplace operating on the anonymous Tor network, where illegal goods were sold for Bitcoin until its closure in 2013). This potential sale could introduce around $6.5 billion worth of Bitcoin into the market.
Meanwhile, CryptoQuant analysts, including Avocado Onchain, remain optimistic. In a publication titled "Bitcoin Price Correction: Short-Term Volatility Amid Long-Term Positive Outlook", they emphasised that short-term fluctuations do not necessarily overshadow Bitcoin’s long-term growth potential.
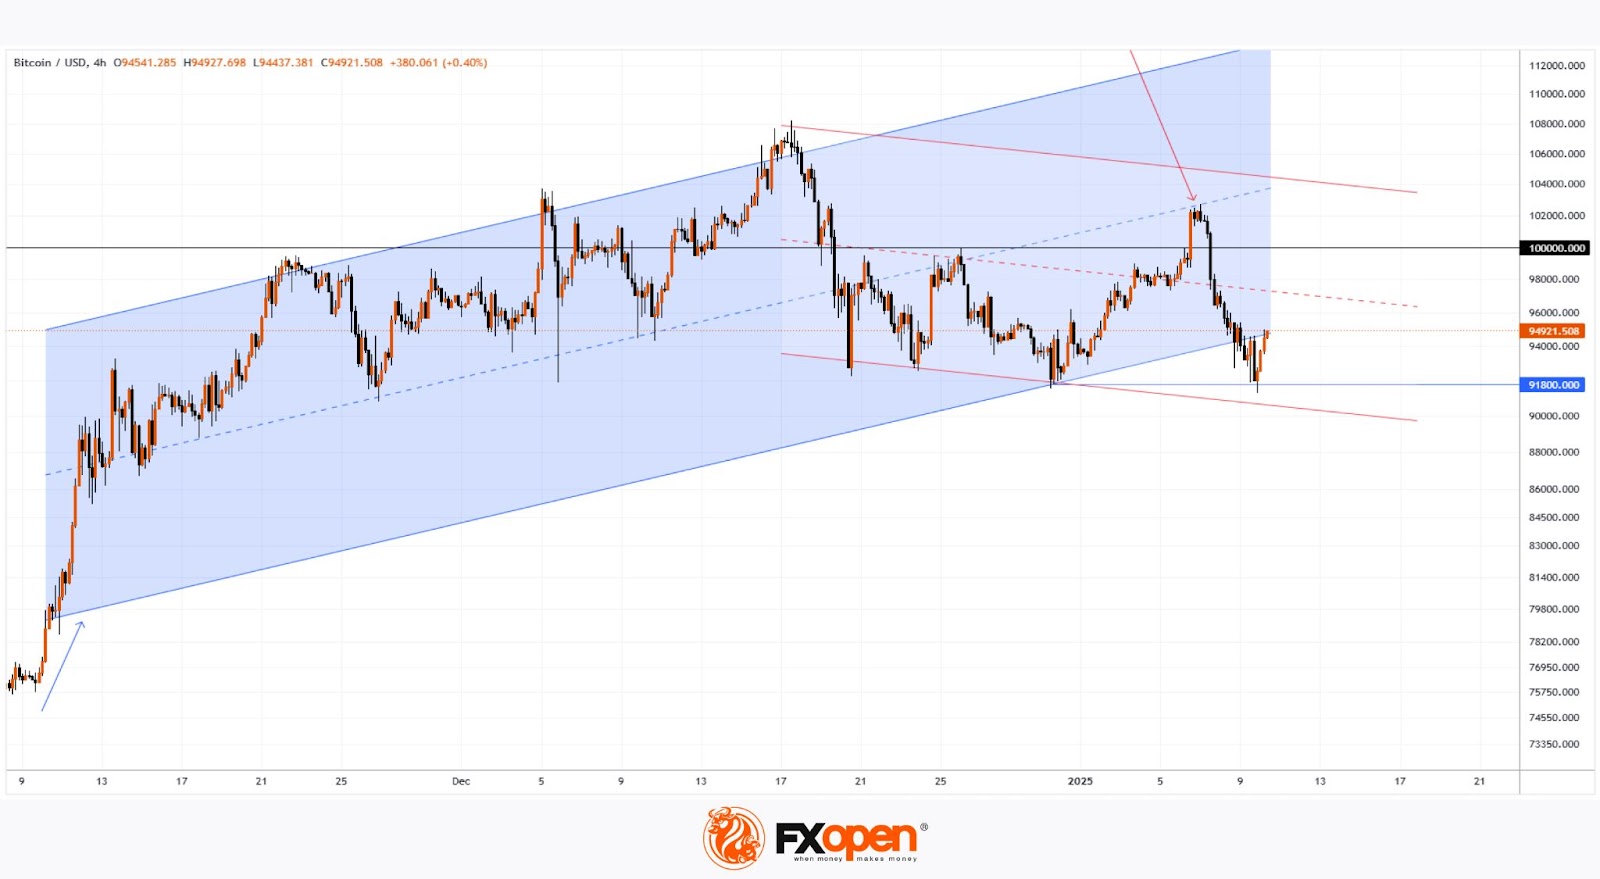
Technical analysis of the BTC/USD chart paints a concerning picture, as the price is currently hovering near the lower boundary of the upward channel that began forming in early November, driven by a surge in optimism following Trump’s victory (illustrated by a blue arrow). This suggests that bullish momentum may be waning.
Key observations include:
→ Bitcoin has failed to sustain levels above the critical psychological threshold of $100k.
→ The median line of the channel has already acted as resistance (marked by a red arrow).
→ The sharp rebound on 10 January, following a false breakout of the 30 December low, indicates strong demand around that level.
If the bulls are unable to restore BTC/USD’s trajectory within the ascending channel, this could pave the way for the development of a downward trend (potential contours marked in red).
FXOpen offers the world's most popular cryptocurrency CFDs*, including Bitcoin and Ethereum. Floating spreads, 1:2 leverage — at your service. Open your trading account now or learn more about crypto CFD trading with FXOpen.
*At FXOpen UK, Cryptocurrency CFDs are only available for trading by those clients categorised as Professional clients under FCA Rules. They are not available for trading by Retail clients.
This article represents the opinion of the Companies operating under the FXOpen brand only. It is not to be construed as an offer, solicitation, or recommendation with respect to products and services provided by the Companies operating under the FXOpen brand, nor is it to be considered financial advice.
AUD/USD Analysis: Exchange Rate Holds at a 56-Month Low
As seen on the AUD/USD chart, yesterday the exchange rate fell below the level of 0.618 Australian dollars per 1 US dollar. The last time the Australian dollar was this weak was in April 2020, during the global spread of the coronavirus.
The decline followed the release of inflation data from Australia earlier this week. According to Bloomberg:
→ Overall annual inflation accelerated to 2.3%, up from 2.1% previously.
→ The trimmed mean core inflation (which smooths volatile items and is closely monitored by the Reserve Bank) slowed to 3.2%, down from 3.5%.
→ Traders are pricing in a 70% chance of a 25 basis point rate cut in February from the current 4.35% (a 13-year high).
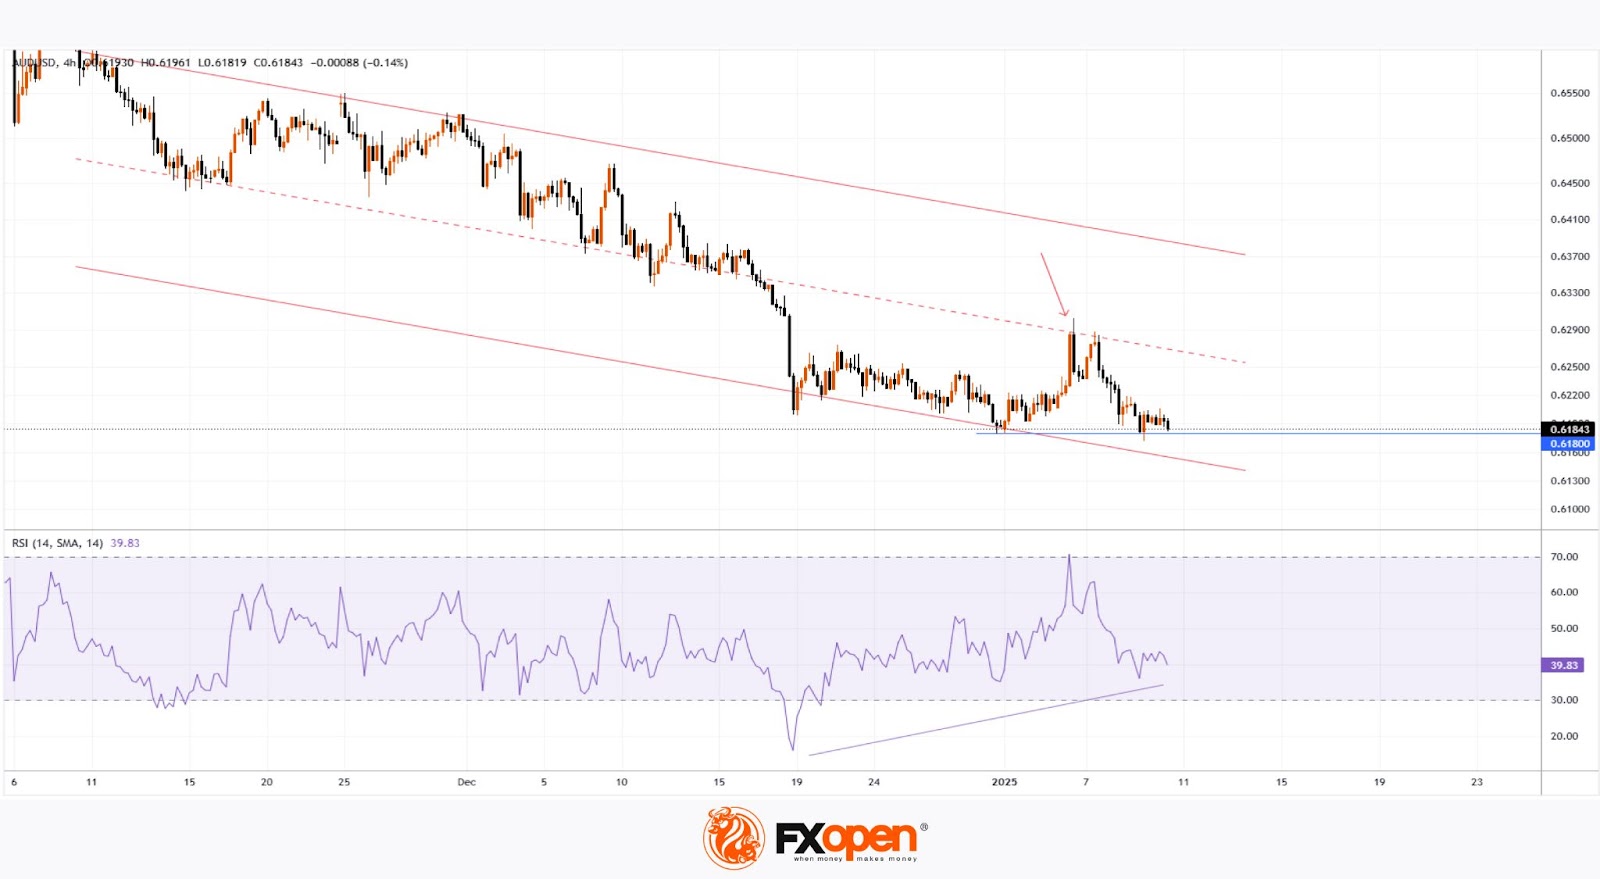
Technical analysis of the AUD/USD chart shows that, despite the exchange rate being within the current downtrend (shown in red on the chart), there are grounds for bulls to remain hopeful, as:
→ The RSI indicator points to a divergence, which can be interpreted as weakening selling pressure.
→ Although the median line of the channel has acted as resistance (marked by a red arrow), the sharp rise in the first days of 2025 suggests that demand forces are gaining momentum.
Thus, it’s possible that if the AUD/USD exchange rate falls back to the lower boundary of the red channel, this could attract buyers of the weakened Australian dollar.
Trade over 50 forex markets 24 hours a day with FXOpen. Take advantage of low commissions, deep liquidity, and spreads from 0.0 pips. Open your FXOpen account now or learn more about trading forex with FXOpen.
This article represents the opinion of the Companies operating under the FXOpen brand only. It is not to be construed as an offer, solicitation, or recommendation with respect to products and services provided by the Companies operating under the FXOpen brand, nor is it to be considered financial advice.
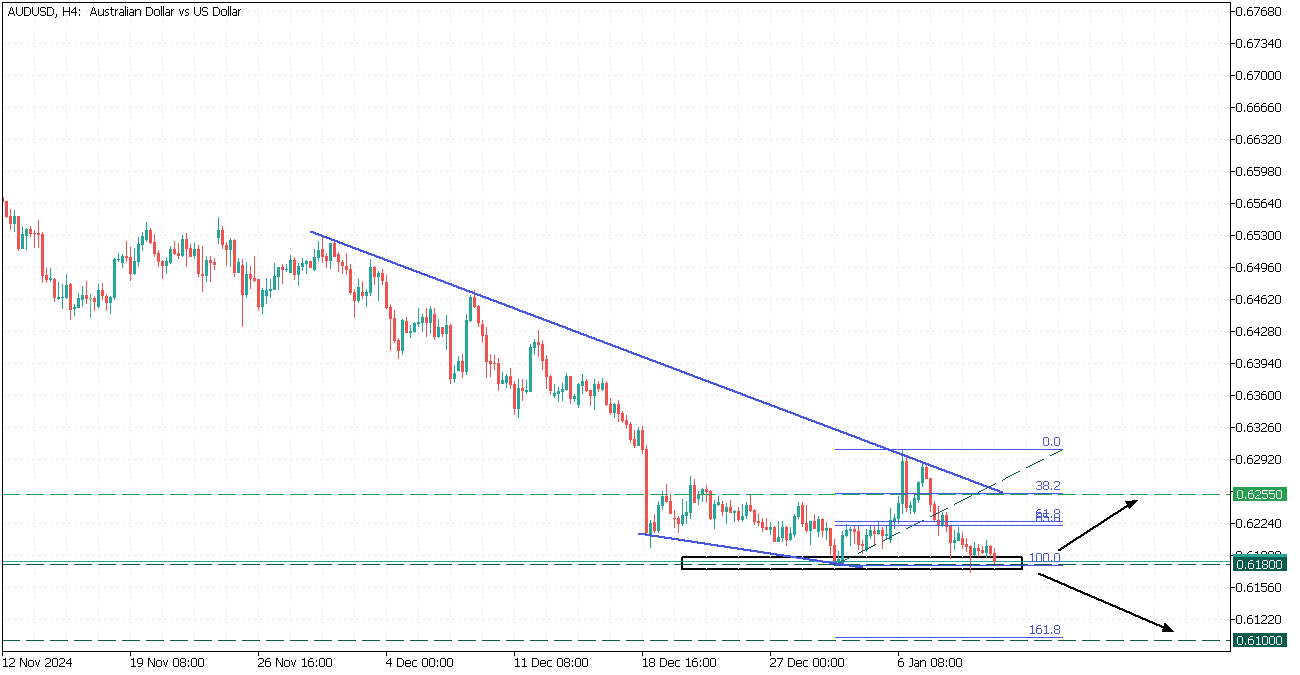
AUDUSD: Falling Wedge
AUDUSD, H4
AUDUSD is in the decline and currently navigating within a falling wedge.
The price is testing the crucial 0.6180 support zone, while the UsDollar strengthened, so two scenarios possible:
- If the price bounces from the 0.6180 support it may rise to the upper border at the 0.6255 level.
- However, breaking below the 0,6180 support will trigger a decline toward 0.6100