Sample Category Title
NFP Preview: US Jobs Report & Market Impact
- The NFP report will provide insights into the health of the US labor market and may influence the Federal Reserve’s interest rate decisions.
- The consensus forecast is 160,000 jobs added, with the unemployment rate expected to hold steady at 4.2% and average hourly earnings at 4.1% YoY.
- The Federal Reserve is closely monitoring wage growth as a key indicator of inflation, which could impact their policy decisions.
- US Dollar Index is trading at two-year highs, and the NFP report could act as a catalyst for further gains or a potential pullback.
The U.S. Nonfarm Payroll (NFP) report will give traders, analysts, and economists important clues about the strength of the U.S. job market. This report will also help predict what the Federal Reserve might do with interest rates in the coming months.
On Wednesday we got a glimpse into the meeting minutes of the Feds December meeting which showed policymakers concerns around inflation and the potential impact of President Elect Donald Trump’s proposed tariff hikes.
Not a surprise as this was discussed in our December NFP Preview. Since the December meeting it has become clear that market participants expect slower moves from the Federal Reserve as uncertainty remains a key factor.
US Non-Farm Payroll Data
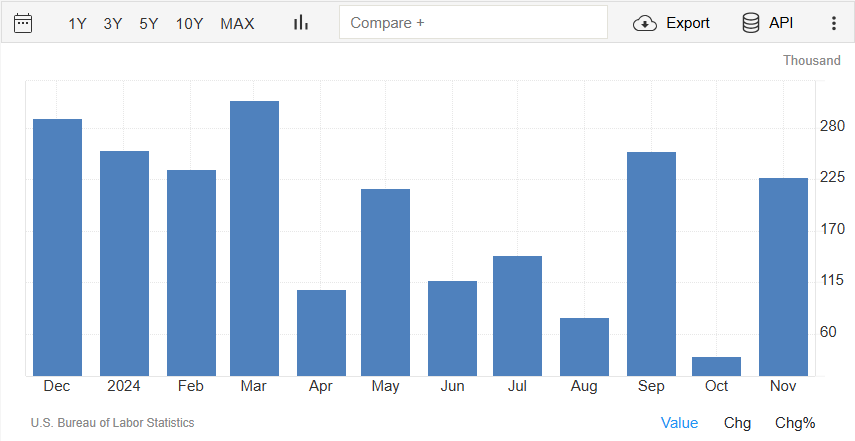
Source: TradingEconomics
Looking Back: The Current State of the US Job Market
To understand the potential implications of January’s NFP report, it’s critical to first review the most recent data and broader trends in the labor market.
November-December Job Market Recap
The December job report showed both good and bad news for the U.S. job market. November was strong, with 227000 jobs added, beating the 200000 expected. Jobs went up in health care (54,000), leisure and hospitality (53,000), government (33,000), and social assistance (19,000). Transportation equipment manufacturing also added 32,000 jobs because workers who were on strike returned to work.
However, retail lost 28,000 jobs, and there wasn’t much change in industries like mining, construction, wholesale trade, transportation, information, finance, and professional services.
Unemployment Rate, Participation Metrics and Average Hourly Earnings
The unemployment rate went up to 4.2% in November from a previous 4.1%. However, given the concern shown by the Fed meeting minutes around inflation, the average hourly earnings print may hold a lot of weight.
As things stand the expectation is for a print of 4% YoY in December which would be in line with the November print.
The US Labor Market became pivotal in the back end of 2024 as the Fed were concerned about a potential rise in unemployment following some downward revisions. However since then, data has been solid barring the interruptions by the Boeing strike and Hurricane Helene.
Moving into the New Year and given the Feds December minutes release, Labor data will remain important but the focus may likely shift back to inflation moving forward. This seems to be the key risk at least for the first quarter as President Trump assumes office and markets gauge his policies and their potential implications.
NFP Preview: What to Expect Today?
The January 2025 NFP report is forecast to show 160,000 jobs added, slightly higher than the average for the last four months of 2024 of 150000. The unemployment rate is expected to remain at 4.2%, while average hourly earnings is also expected to remain steady at 4.1% YoY.
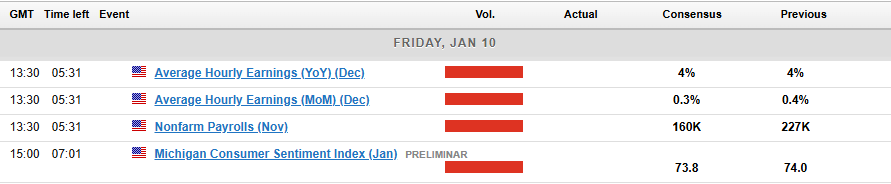
However, I would advise caution as surprises are still possible. Seasonal adjustments, delayed layoffs, and fragile consumer sentiment add complexity to forecasting this report.
Potential Impact and Scenarios
Markets will be eyeing the data which will have a knock on impact across various asset classes. US Yields are of particular interest given their recent rally while the US Dollar index is trading at two-year highs.
In my opinion there does need to be a significant deviation from consensus for any significant change to the rate probabilities for 2025. Without it, I expect rate cut expectations to remain rather steady ahead of the Trump inauguration on January 20, 2025.
Potential Impact on the US Dollar Based on the Data Released
| NFP Print | Wages Less Than 0.2% MoM | Wages Between 0.3-0.5% MoM | Wages Greater Than 0.5% |
| Less Than 150k | Bearish USD | Bearish USD | Neutral USD |
| 150k-170k | Bearish USD | Neutral USD | Bullish USD |
| Greater Than 170k | Neutral USD | Bullish USD | Bullish USD |
Source: LSEG, TradingEconomics. Table Created by Zain Vawda
Technical Analysis US Dollar Index (DXY)
Looking at the US Dollar Index and bulls are definitely in charge. The DXY continues to benefit from fears that US tariff policy will lead to an uptick in inflation, something which was confirmed by the Fed meeting minutes.
The meeting minutes showed that some members openly accepted that potential Trump policies impacted their dot plot decision making.
As things stand, the DXY is hovering around two-year highs with any selloffs off late being met by significant buying pressure.
For now the 109.52 handle appears to holding firm with markets eyeing the NFP as a potential catalyst.
The table above provides potential scenarios for the US Dollar depending on the data.
A strong NFP print and rise is earnings could propel the DXY beyond the 109.52 handle before the psychological 110.00 handle becomes the focus. A break beyond 110.00 and 111.00 may prove to be next key level market participants may keep an eye on.
A weak NFP print and a drop in hourly earnings could facilitate a move lower for the DXY and a test of the ascending trendline. However the issue is whether any such move will be sustainable moving forward. Key levels include 108.50, 108.00 and 107.26.
US Dollar Index (DXY) Daily Chart, January 10, 2024
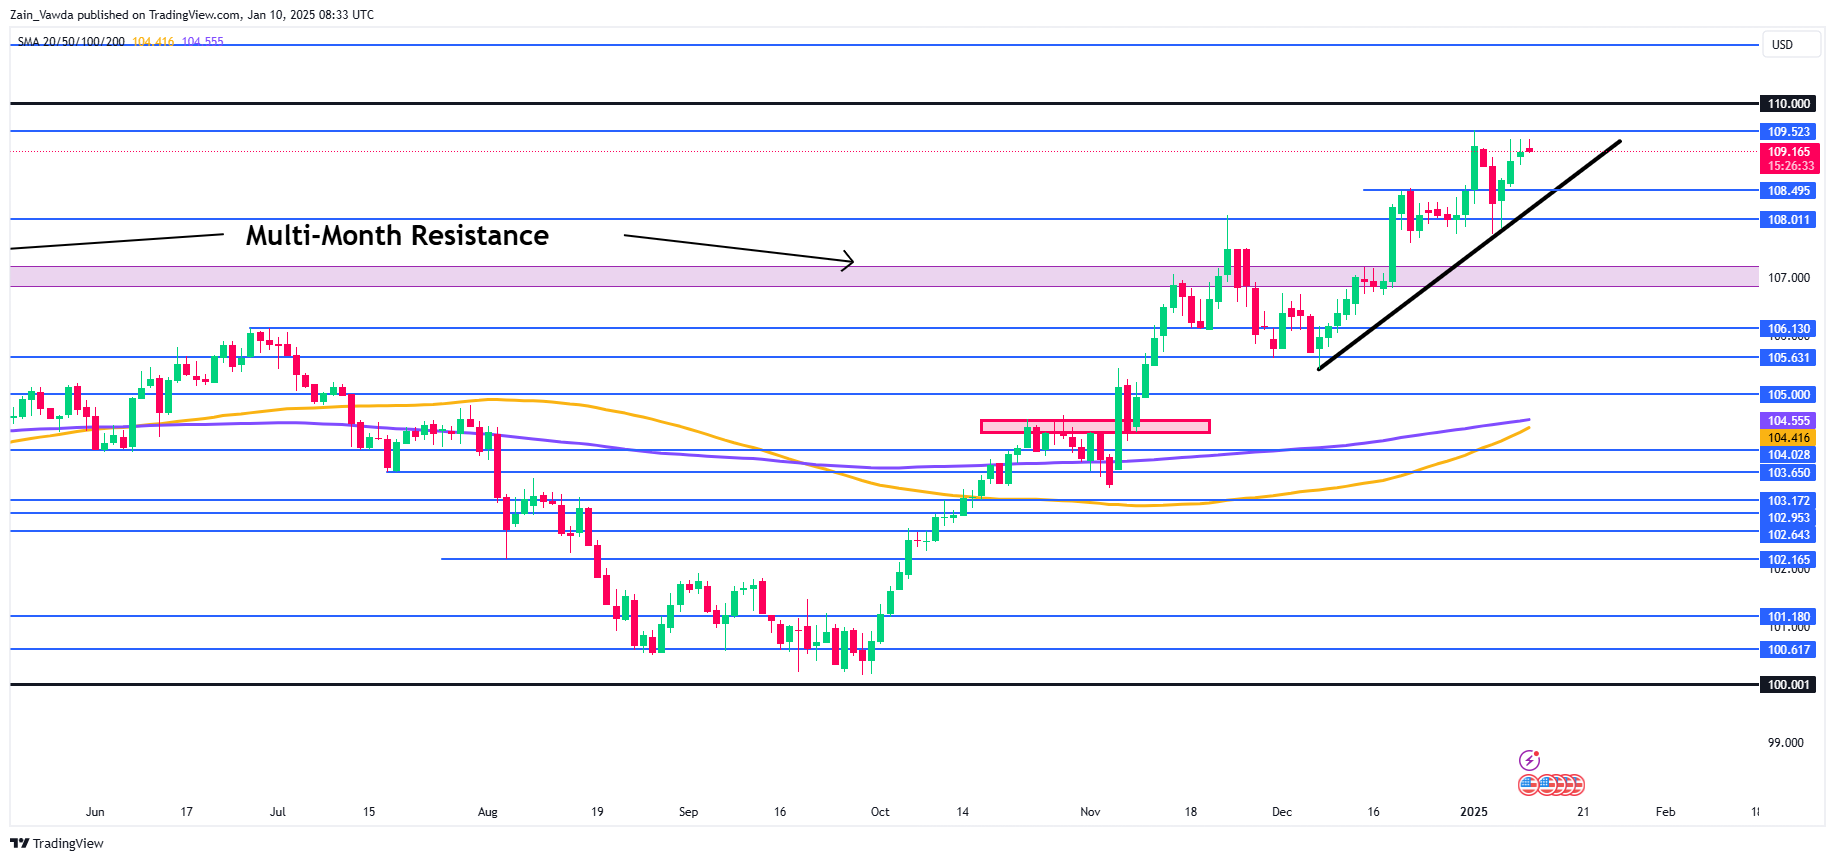
Source: TradingView (click to enlarge)
Support
- 108.50
- 108.00
- 107.26
Resistance
- 109.52
- 110.00
- 111.00
Dollar Resumes Its Rally After a Correction
At the start of the current trading week, there was a sharp pullback in major currency pairs. GBP/USD climbed to 1.2580, EUR/USD tested 1.0400 as resistance, and USD/CAD temporarily dropped below 1.4200. However, dollar sellers failed to fully capitalise on this movement, and the pairs have so far been unable to maintain their recent levels.
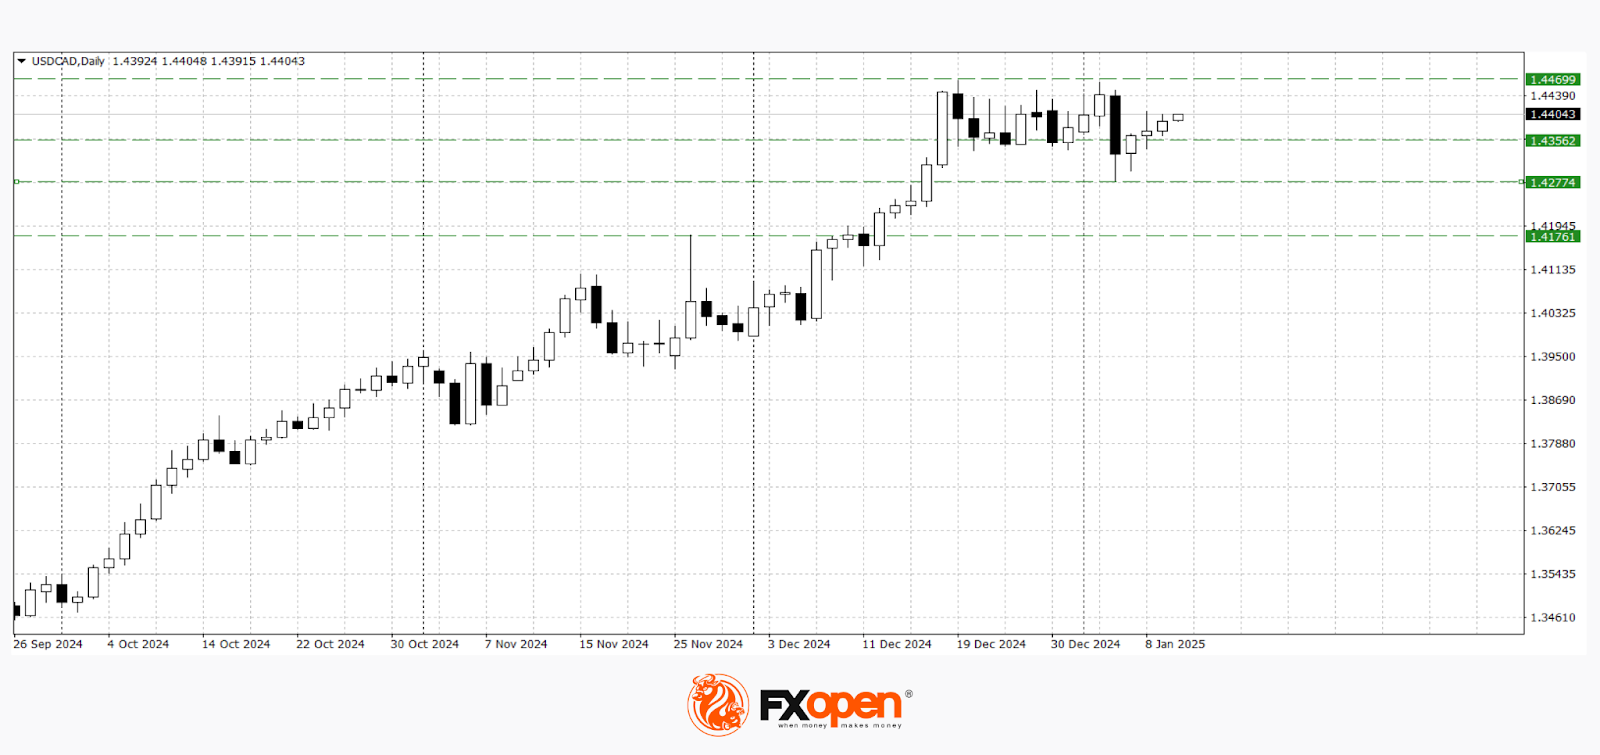
USD/CAD
The USD/CAD rally observed since mid-September paused following another test of the 1.4470 level. On the daily timeframe, a reversal pattern, the “double top,” was formed, and its partial completion concluded after the pair dropped to 1.4280. Currently, the pair is trading above 1.4350. With the right fundamental catalyst, the price could retest the 1.4470–1.4450 range. Conversely, if USD/CAD falls below the recent low of 1.4270, a further decline toward the 1.4200–1.4170 range may follow.
Key events that could influence USD/CAD dynamics today include:
16:30 (GMT+2): Average hourly earnings in the US
16:30: US non-farm payrolls
16:30: Canadian unemployment rate
16:30: Canadian employment change
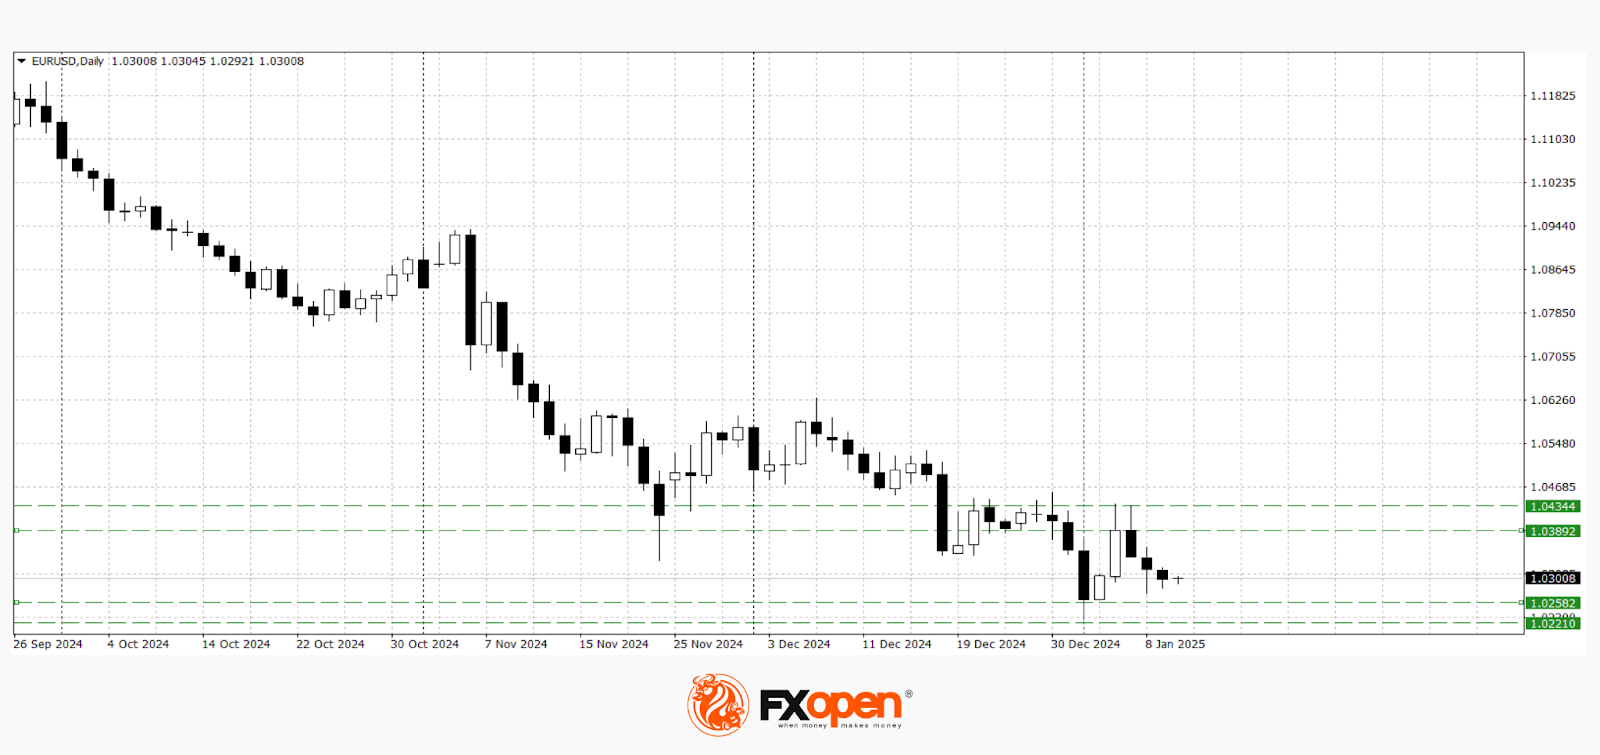
EUR/USD
As expected, after updating last year’s low, EUR/USD managed to correct toward the 1.0430–1.0400 range. However, a more significant recovery failed to materialise, and the pair is currently testing the 1.0300 level as support. Depending on today’s employment data, the pair may either rise above 1.0430 or retest the recent low at 1.0230.
In addition to US employment data, the following events may affect EUR/USD pricing today:
11:00 (GMT+2): Spanish industrial production
16:00: Germany’s current account balance (non-seasonally adjusted)
18:00: US 5-year inflation expectations index from the University of Michigan
This version retains all critical information while using British English terms and improving fluency.
Trade over 50 forex markets 24 hours a day with FXOpen. Take advantage of low commissions, deep liquidity, and spreads from 0.0 pips. Open your FXOpen account now or learn more about trading forex with FXOpen.
This article represents the opinion of the Companies operating under the FXOpen brand only. It is not to be construed as an offer, solicitation, or recommendation with respect to products and services provided by the Companies operating under the FXOpen brand, nor is it to be considered financial advice.
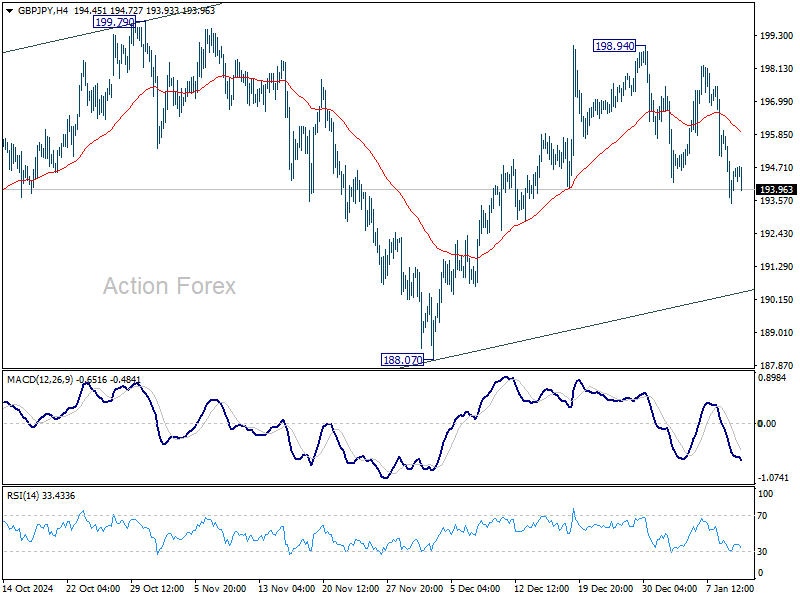
GBP/JPY Daily Outlook
Daily Pivots: (S1) 193.47; (P) 194.64; (R1) 195.81; More...
Intraday bias in GBP/JPY stays mildly on the downside for the moment. Rise from 188.07 might have completed at 198.84 already. Deeper fall would be seen to 188.07 support. Firm break there will argue that corrective pattern from 180.00 has already completed. Nevertheless, above 198.94 will target 199.79 resistance and above.
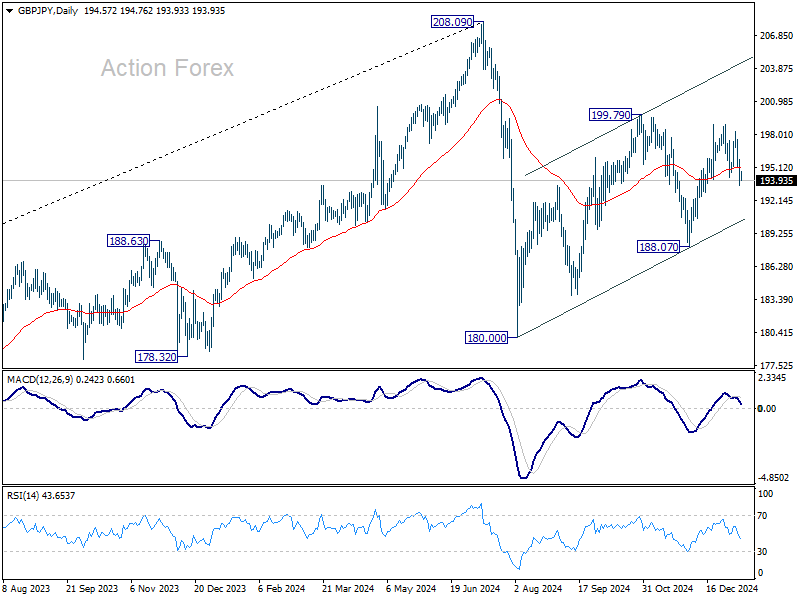
In the bigger picture, price actions from 208.09 are seen as a correction to whole rally from 123.94 (2020 low). The range of consolidation should be set between 38.2% retracement of 123.94 to 208.09 at 175.94 and 208.09. However, decisive break of 175.94 will argue that deeper correction is underway.
EUR/JPY Daily Outlook
Daily Pivots: (S1) 162.36; (P) 162.90; (R1) 163.42; More...
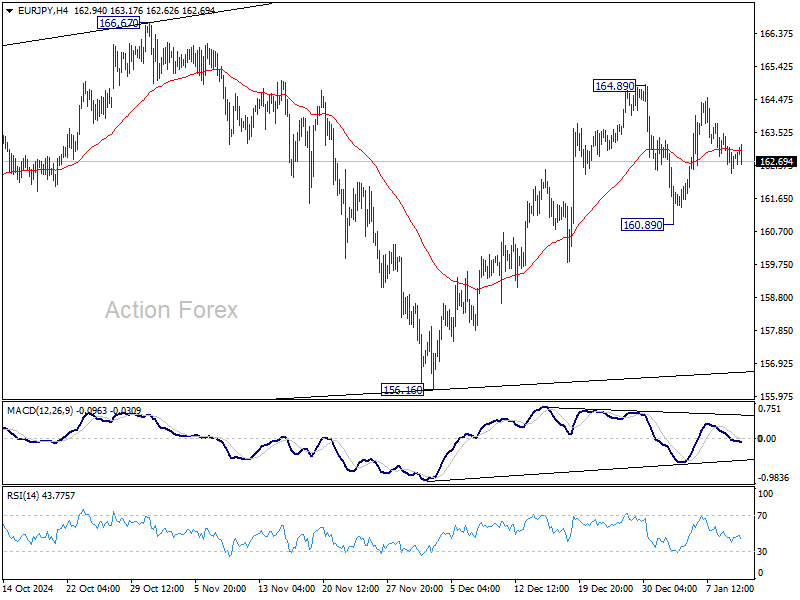
EUR/JPY is staying in consolidation below 164.89 and intraday bias remains neutral. Rise from 156.16, as a leg in the corrective pattern from 154.40, should continue as long as 160.89 support holds. On the upside, break of 164.89 will target 166.67, and above. However, firm break of 160.89 will turn bias back to the downside for 156.16 support instead.
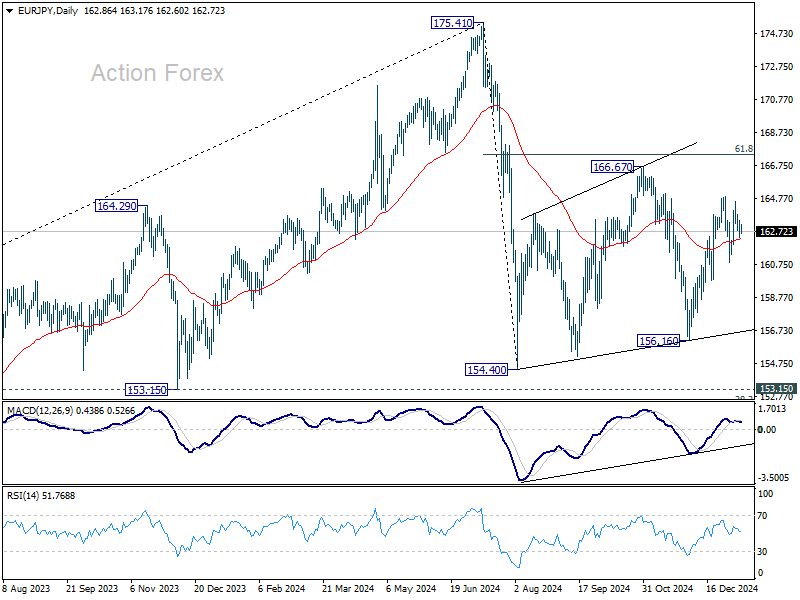
In the bigger picture, price actions from 175.41 are seen as correction to rally from 114.42 (2020 low). The range of consolidation should have been set between 38.2% retracement of 114.42 to 175.41 at 152.11 and 175.41 high. However, decisive break of 152.11 would argue that deeper correction is underway.
EUR/GBP Daily Outlook
Daily Pivots: (S1) 0.8338; (P) 0.8372; (R1) 0.8404; More...
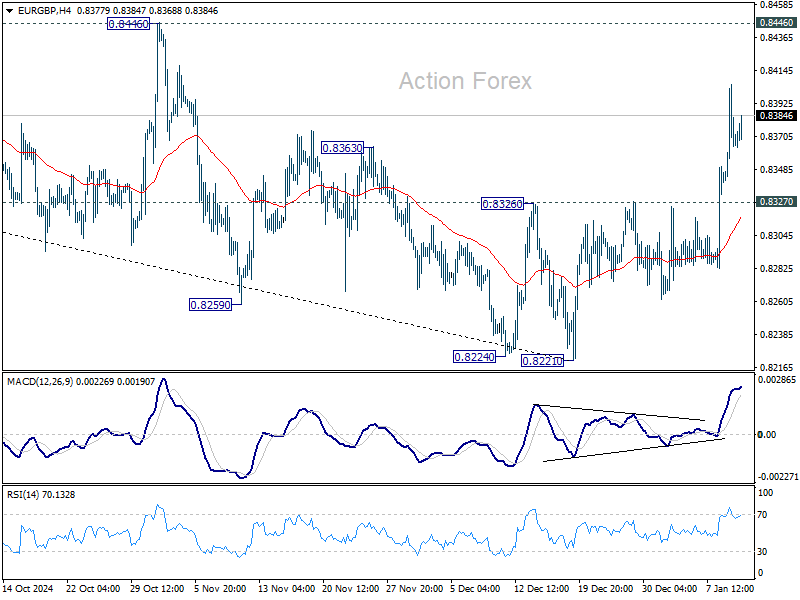
Intraday bias in EUR/GBP stays on the upside for the moment, as rally from 0.8221 short term bottom is in progress for 0.8446 key resistance. Strong resistance might be seen there to limit upside, at least on first attempt. But for now, further rally will remain in favor as long as 0.8327 resistance turned support holds, in case retreat. Decisive break of 0.8446 will carry larger bullish implications.
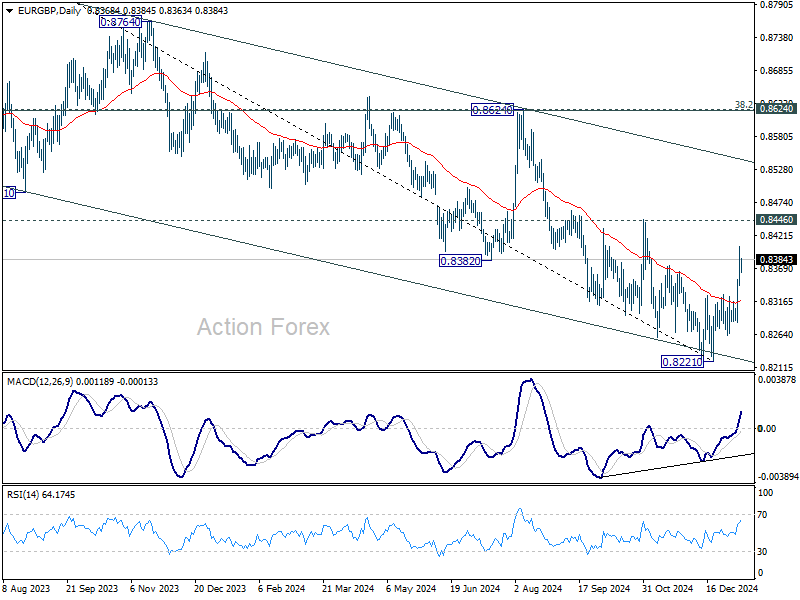
In the bigger picture, considering bullish convergence condition in D MACD, decisive break of 0.8446 resistance should confirm medium term bottoming at 0.8221, just ahead of 0.8201 key support (2022 low). Further rally should be seen towards 0.8624 key resistance, even as a correction to the down trend from 0.9267 (2022 high). Overall, however, medium term outlook will be neutral at best until decisive break of 0.8624 cluster zone (38.2% retracement of 0.9267 to 0.8221 at 0.8621). Risk will stay on the downside even in case of strong rebound.
EUR/AUD Daily Outlook
Daily Pivots: (S1) 1.6591; (P) 1.6628; (R1) 1.6661; More...
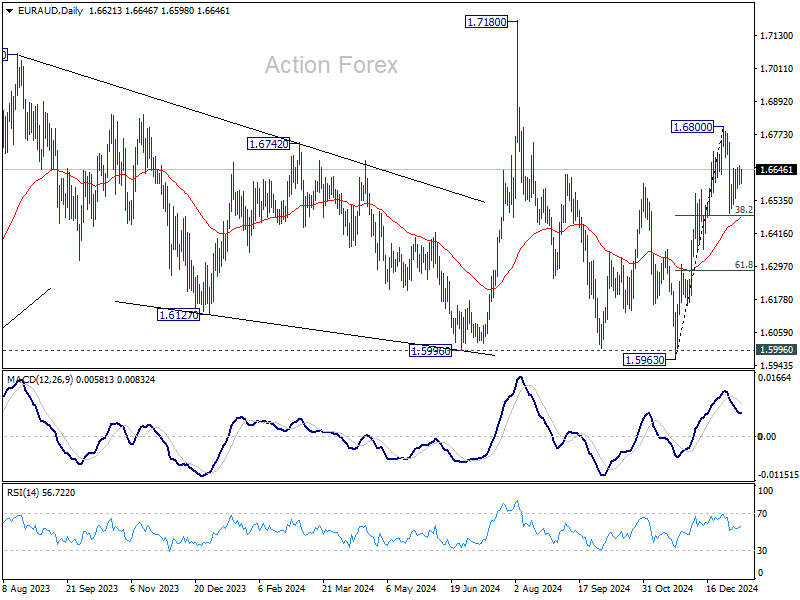
No change in EUR/AUD's outlook as range trading continues, and intraday bias stays neutral. Corrective pattern from 1.6800 could extend further. But strong support could be seen from 38.2% retracement of 1.5963 to 1.6800 at 1.6480 to bring rebound. Near term risk will stay mildly on the downside as long as 1.6800 resistance holds, in case of extended recovery. Firm break of 1.6480 will bring deeper correction 61.8% retracement at 1.6283.
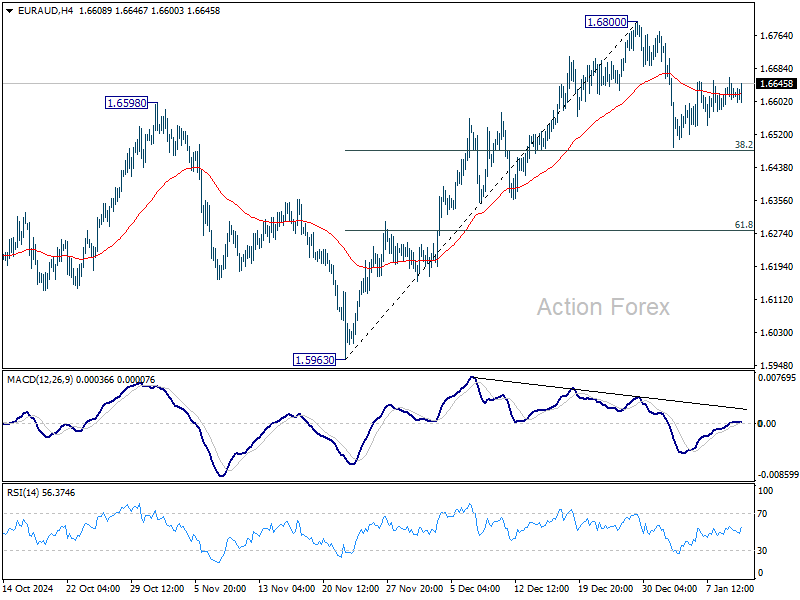
In the bigger picture, EUR/AUD is holding on to 1.5996 key support despite brief breach. Larger up trend from 1.4281 (2022 low) is still in favor to resume through 1.7180 at a later stage. Nevertheless, sustained break of 1.5995 will indicate that such up trend has completed and deeper decline would be seen.
EUR/CHF Daily Outlook
Daily Pivots: (S1) 0.9385; (P) 0.9394; (R1) 0.9405; More....
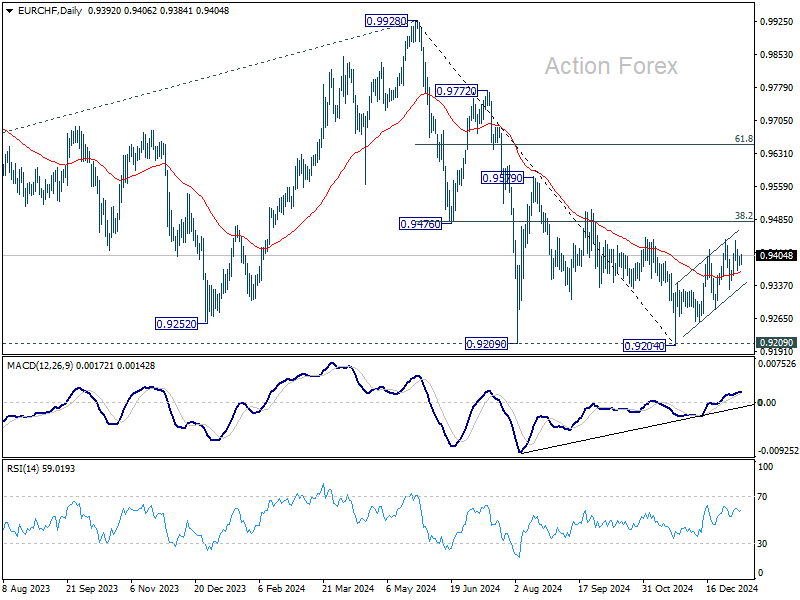
No change in EUR/CHF's outlook and intraday bias stays neutral. Corrective rebound from 0.9204 could still extend higher through 0.9440. But upside should be limited by 0.9481 fibonacci resistance. On the downside, firm break of 0.9329 support will argue that the correction has completed, and bring retest of 0.9204 low.
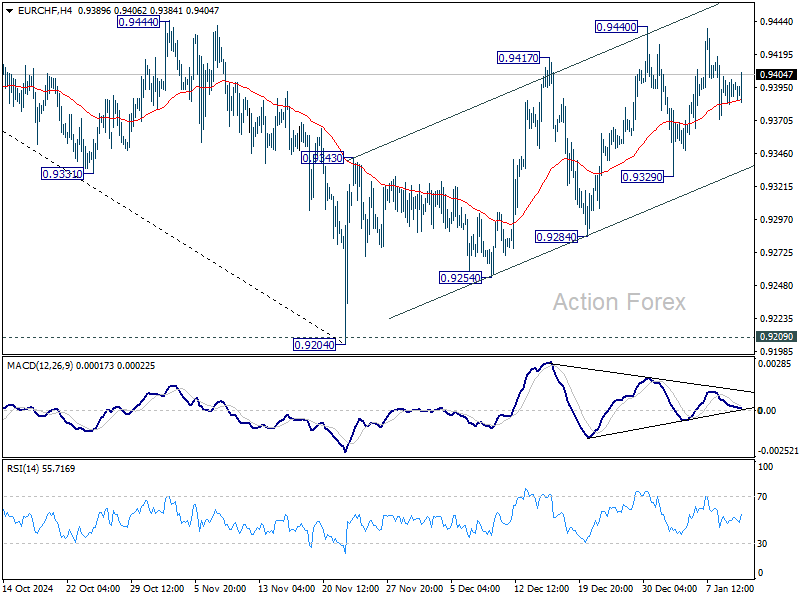
In the bigger picture, while rebound from 0.9204 might extend higher, strong resistance could be seen from 38.2% retracement of 0.9928 to 0.9204 at 0.9481 to limit upside. Down trend from 0.9928 (2024 high) is still in favor to resume through 0.9204/9 support zone at a later stage.
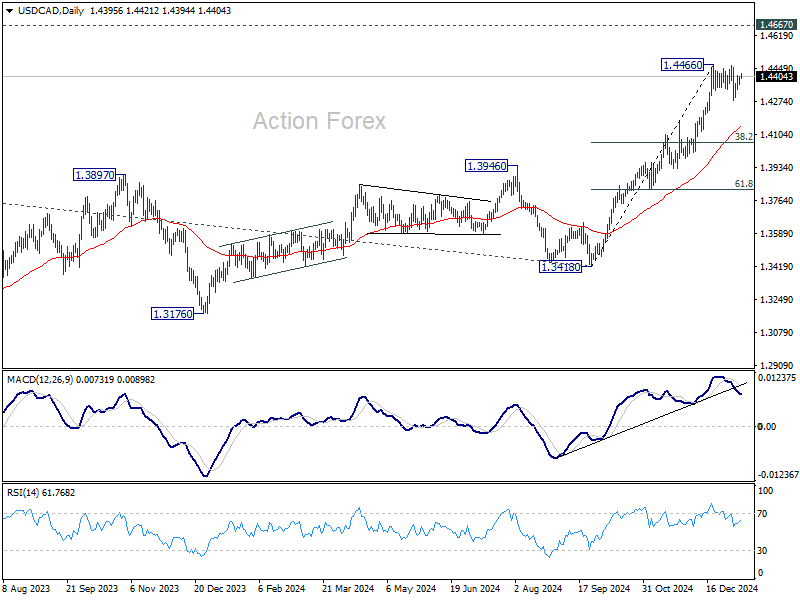
USD/CAD Daily Outlook
Daily Pivots: (S1) 1.4372; (P) 1.4388; (R1) 1.4411; More...
Intraday bias USD/CAD remains neutral for the moment, and consolidations from 1.466 could extend, probably with another fall. But downside should be contained above 38.2% retracement of 1.3418 to 1.4466 at 1.4066 to bring rebound. On the upside, break of 1.4466 will resume larger up trend to 1.4667/89 key resistance zone.
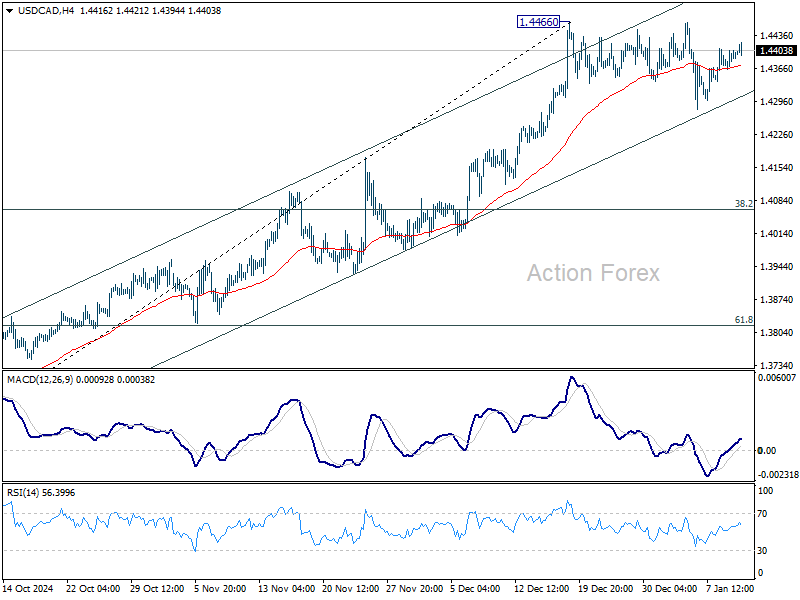
In the bigger picture, up trend from 1.2005 (2021) is in progress for retesting 1.4667/89 key resistance zone (2020/2015 highs). Medium term outlook will remain bullish as long as 1.3976 resistance turned holds (2022 high), even in case of deep pullback.
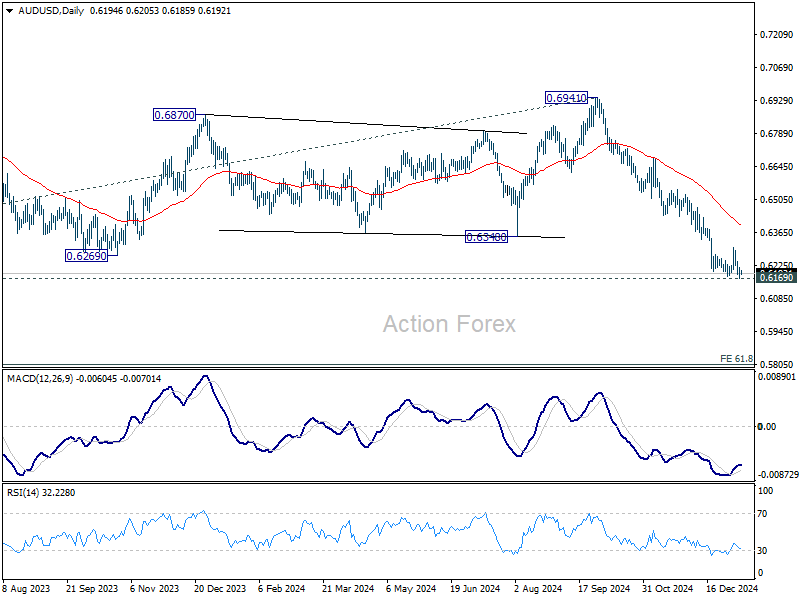
AUD/USD Daily Report
Daily Pivots: (S1) 0.6172; (P) 0.6196; (R1) 0.6219; More...
Intraday bias in AUD/USD remains neutral at this point, and further decline is expected as long as 0.6301 resistance holds. Firm break of 0.6169 key support will confirm larger down trend resumption. Nevertheless, break of 0.6301 resistance will turn bias back to the upside for stronger rebound to 55 D EMA (now at 0.6394).
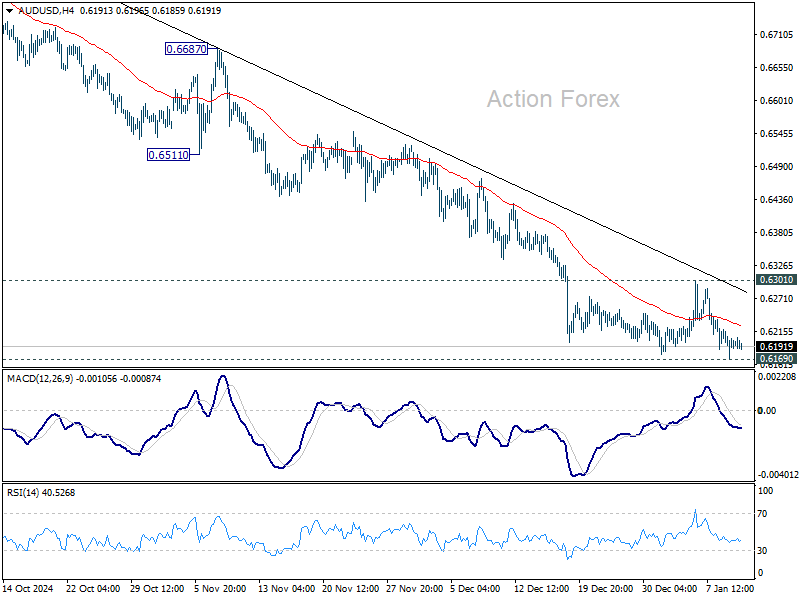
In the bigger picture, price actions from 0.6169 (2022 low) are seen as a medium term consolidation to the down trend from 0.8006, and could have completed at 0.6941 already. Firm break of 0.6169 support will confirm down trend resumption for 61.8% projection of 0.8006 to 0.6169 from 0.6941 at 0.5806 next. In any case, outlook will stay bearish as long as 55 W EMA (now at 0.6587) holds.
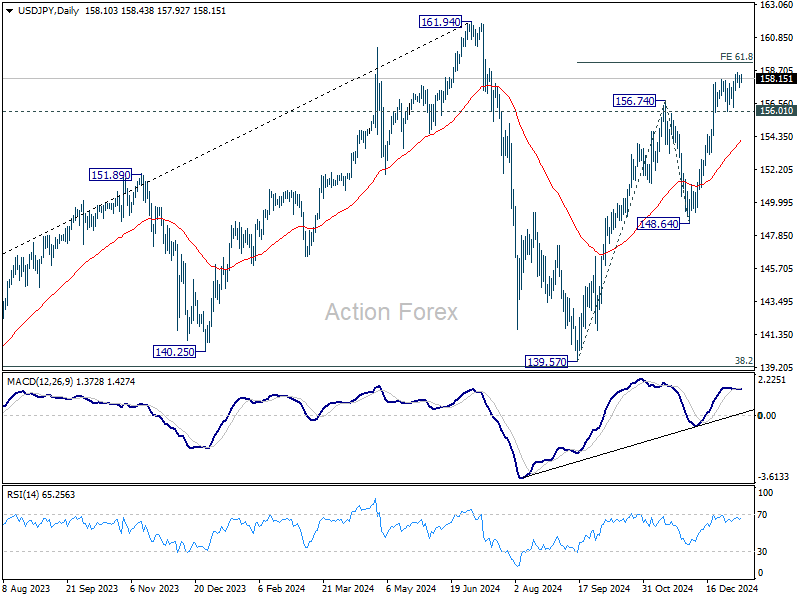
USD/JPY Daily Outlook
Daily Pivots: (S1) 157.69; (P) 158.04; (R1) 158.51; More...
Intraday bias in USD/JPY remains neutral for the moment, and further rally is in favor with 156.01 support intact. On the upside, firm break of 61.8% projection of 139.57 to 156.74 from 148.64 at 159.25 will extend the rally from 139.57 to retest 161.94 high. However, considering bearish divergence condition in 4H MACD, firm break of 156.01 support will indicate short term topping. Intraday bias will then be back on the downside for 55 D EMA (now at 154.13) instead.
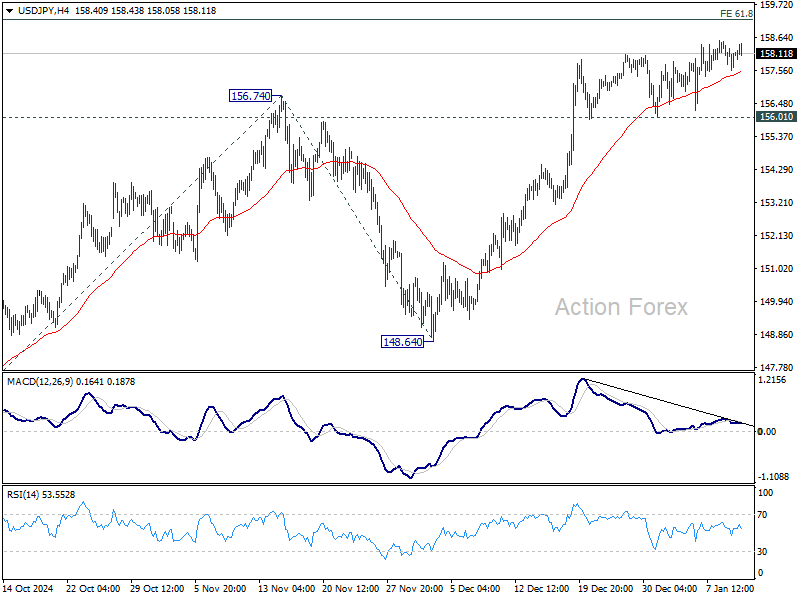
In the bigger picture, price actions from 161.94 are seen as a corrective pattern to rise from 102.58 (2021 low). The range of medium term consolidation should be set between 38.2% retracement of 102.58 to 161.94 at 139.26 and 161.94. Nevertheless, sustained break of 139.26 would open up deeper medium term decline to 61.8% retracement at 125.25.