
Sample Category Title
Elliott Wave View: USDCAD Flat Correction
Short term USDCAD Elliott Wave view suggests the decline to 1.2411 ended Intermediate wave (3) of an Elliott Wave impulse structure from 6/2 peak. Intermediate wave (4) bounce is in progress as a flat Elliott wave structure where Minor wave A ended at 1.2576 and Minor wave B ended at 1.2416. Minor wave C is subdivided as an impulse Elliott Wave structure. Up from 1.2416 low, Minute wave ((i)) ended at 1.253, Minute wave ((ii)) ended at 1.2443, Minute wave ((iii)) ended at 1.2593 and Minute wave ((iv)) ended at 1.2355. Near term focus is on 1.262 – 1.2683 to complete Intermediate wave (4) flat. Afterwards, pair should either resume to new low or at least pullback in 3 waves. We don’t like buying the proposed bounce.
USDCAD 1 Hour Elliott Wave Chart
Elliott Wave FLAT structure is a 3 waves corrective pattern and there are 3 different types of Flats:
- Regular flat.
- Expanded flat
- Running flat.
The flat seen in USDCAD above is the Regular flat type. A Regular flat is a 3 waves corrective pattern which could often be seen in the market nowadays. The internal subdivision of Flat is labeled as A,B,C with 3-3-5 structure. Waves A and B are subdivided in corrective structures such as zigzag, flat, double three or triple three. Third wave C is always 5 waves structure, either as a motive impulse or an ending diagonal pattern. It’s important to notice that in a Regular Flat, wave B completes slightly above the starting point of wave A. Wave B usually ends at 50%, 61.8%, 76.4%, or 85.4% of wave A and Wave C of regular flat usually ends close to 100% -1.236% Fibonacci extension of A related to B.
Daily Technical Outlook And Review: EUR/USD, GBP/USD, AUD/USD, USD/JPY
A note on lower timeframe confirming price action...
Waiting for lower timeframe confirmation is our main tool to confirm strength within higher timeframe zones, and has really been the key to our trading success. It takes a little time to understand the subtle nuances, however, as each trade is never the same, but once you master the rhythm so to speak, you will be saved from countless unnecessary losing trades. The following is a list of what we look for:
- A break/retest of supply or demand dependent on which way you're trading.
- A trendline break/retest.
- Buying/selling tails ... essentially we look for a cluster of very obvious spikes off of lower timeframe support and resistance levels within the higher timeframe zone.
- Candlestick patterns. We tend to only stick with pin bars and engulfing bars as these have proven to be the most effective.
We typically search for lower-timeframe confirmation between the M15 and H1 timeframes, since most of our higher-timeframe areas begin with the H4. Stops are usually placed 1-3 pips beyond confirming structures.
EUR/USD
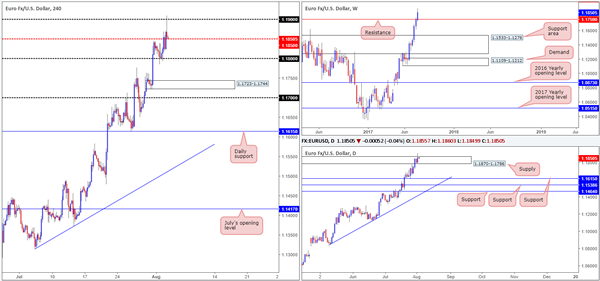
Using a top-down approach this morning, we can see that weekly bulls continue to reassert their dominance above weekly resistance at 1.1759. Should the major conclude the week closing beyond this line, further buying could take shape up to a weekly resistance planted at 1.2044. Down on the daily picture, the supply pegged at 1.1870-1.1786 suffered a breach during yesterday’s segment. Whether this move is enough to clear shorts from the zone is difficult to judge at this time, as ideally we like to see a decisive close form to confirm consumption.
Across on the H4 timeframe, the 1.18 handle remained a strong support, forcing the single currency to break and eventually close beyond the mid-level resistance at 1.1850. It was only in the later hours, however, did we witness the unit edge higher and challenge the 1.19 band, which, as you can see, held firm and formed a bearish selling wick going into the closing bell.
Our suggestions: While it is clear that this market is in a robust position right now, we are reluctant to consider buying until the noted daily supply has been consumed. In addition to this, our desk is still short the GBP/USD!
Data points to consider: US Weekly unemployment claims at 1.30pm, US Non-manufacturing PMI at 3pm GMT+1.
Levels to watch/live orders:
- Buys: Flat (stop loss: N/A).
- Sells: Flat (stop loss: N/A).
GBP/USD
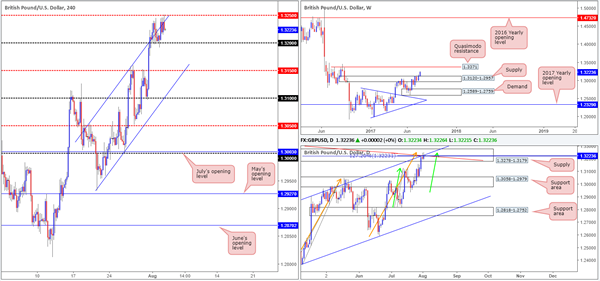
For those who follow our reports on a regular basis, you may recall that our desk recently took a short position from 1.3209, with conservative stops planted at 1.3280. While our trade has yet to move in to a profit, our reasoning behind executing a short position here is strong: the daily structure surrounding daily supply at 1.3278-1.3179 (our stops are positioned two pips above this zone). Currently in play, we have a daily trendline resistance taken from the high 1.3477, a daily channel resistance drawn from the high 1.2903 and two converging daily AB=CD (green/orange arrows) 127.2 Fib extensions at 1.3222/1.3223 (taken from the lows 1.2811/1.2365). Also, for you RSI fans, there is daily divergence in motion, as well.
On the H4 timeframe, the 1.32 handle is proving to be a durable support, despite the H4 channel resistance (extended from the high 1.3053) capping upside moves. Although the confluence seen on the daily chart is attractive, we still have concerns above weekly price trading above weekly supply at 1.3120-1.2957, which may end up pulling price higher and eventually filing our stop-loss order.
Our suggestions: Ultimately, we are looking for H4 price to cross below the 1.32 boundary today as this will not only confirm bearish strength from the noted daily supply, but also open up the path south down to the mid-level base 1.3150. This is where we’ll look to reduce risk to breakeven and take partial profits.
Data points to consider: UK Services PMI at 9.30am, UK BoE Inflation report and monetary policy decisions at midday, followed closely by BoE Gov. Carney taking the stage at 12.30pm. US Weekly unemployment claims at 1.30pm, US Non-manufacturing PMI at 3pm GMT+1.
Levels to watch/live orders:
- Buys: Flat (stop loss: N/A).
- Sells: 1.3209 ([live] stop loss: 1.3280).
AUD/USD
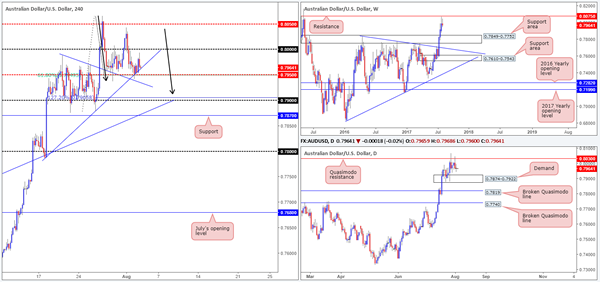
As can be seen from the H4 timeframe this morning, the mid-level support at 0.7950 elbowed its way back into the spotlight yesterday. With this level seen fusing closely with a H4 trendline support taken from the high 0.7987, a H4 trendline support drawn from the low 0.7786 and also a H4 61.8% Fib support at 0.7950 etched the low 0.7877, we are not surprised to see this level holding firm. Why did we not take a long position from here then? Well, this was due to the surrounding landscape, as both the weekly and daily timeframes show room to extend lower, with the closest support seen at daily demand drawn from 0.7874-0.7922. Further adding to this, it’s clear to see that the H4 candles are in the process of chalking up a potential D-leg to an AB=CD bullish formation (black arrows) that completes just ahead of the 0.79 handle (the 127.2% ext. at 0.7905).
Our suggestions: In the long run, we still believe that the Aussie is heading lower. However, selling this market is awkward. Not only do we have the nearby H4 supports in play, but beyond here we’re unfortunately left with little space for a reasonable sell given that the top edge of the daily demand area is located nearby at 0.7922!
Therefore, we feel placing this pair on the sidelines may be the way to go since neither a long nor short seems attractive right now.
Data points to consider: Australian Trade balance at 2.30am GMT+1. US Weekly unemployment claims at 1.30pm, US Non-manufacturing PMI at 3pm GMT+1.
Levels to watch/live orders:
- Buys: Flat (stop loss: N/A).
- Sells: Flat (stop loss: N/A).
USD/JPY
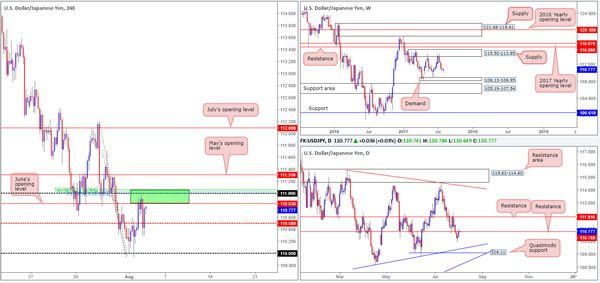
In Wednesday’s report, you may recall our team highlighting the 111.07/110.83 neighborhood as a potential sell zone (marked in green on the H4 chart). Comprised of a H4 Fibonacci resistance cluster (50.0%/61.8%/78.6% taken from the highs 112.19/111.71/111.28), June’s opening level at 110.83 and a psychological band at 111, the pair managed to find a pocket of offers here during yesterday’s segment. Well done to any of our readers who managed to take advantage of this move.
Although H4 price aggressively sold off from the noted sell zone and even dug itself below the mid-level support at 110.50, we’ve seen the couple make a complete U-turn in recent candles. The question is will this green zone be able to hold the market lower for a second time?
Our suggestions: From the weekly timeframe, the market looks as though it could continue to press lower until we reach the small demand base seen at 108.13-108.95. Zooming in and looking at the daily picture, we can see that price is in contact with resistance at 110.76. With the higher-timeframe picture suggesting that further selling could be on the cards, we do believe H4 sell zone may hold for a second round.
However, as we mentioned in Wednesday’s analysis, there’s a risk of price faking beyond the sell zone to test May’s opening level seen nearby at 111.31. As such, we would strongly advise waiting for lower-timeframe confirming action (see the top of this report for details), before pulling the trigger.
Data points to consider: US Weekly unemployment claims at 1.30pm, US Non-manufacturing PMI at 3pm GMT+1
Levels to watch/live orders:
- Buys: Flat (stop loss: N/A).
- Sells: 111.07/110.83 ([Waiting for a lower-timeframe confirming signal to form is advised before pushing the sell button here] stop loss: dependent on where one confirms the area).
Market Morning Briefing: Aussie Continues Its Corrective Mode
STOCKS
Dow (22016.24, +0.24%) is moving up slowly and could test 22100-22250 in the near term from where a short corrective dip is possible. Immediate trend is up.
Dax (12181.48, -0.57%) lost most of the gains seen in the previous session but is trading above 12080 just now. Near term trade could possibly continue in the 12450-12080 region for a few more sessions.
Shanghai (3285.26, +0.01%) is trading below the near term resistance at 3300. While that holds, we may expect some sideways consolidation if not an immediate fall towards 3250. Some downward correction is preferred just now before it resumes its rally.
Nikkei (20004.00, -0.38%) looks choppy just now and is almost ranged sideways unable to decide on which direction to take. We will have to wait for more clarity while the sideways consolidation continues.
Nifty (10081.50, -0.33%) closed below 10100, after facing rejection from resistance at levels just below 10150. While the correction continues, we could see a test of 9950 before again heading towards 10100 levels.
COMMODITIES
Gold (1263) is trading within the range of 1245-75. It has a crucial Support at 1245. If that holds, we can see a rise towards 1275. Recent sideways move had helped Gold to get out of its short term overbought territory but it has to close above 1275 regions to keep the bullish momentum intact. Silver (16.55) somehow manages to hold above 16.50 levels, but a close below 16.50 could open up 16.20 and 15.90 levels respectively. As of now, Silver has been well supported by the recent surge in copper prices but we might see drastic fall in Silver if there will be any short term price correction in Copper.
Copper (2.89) looks on a firm footing while it is trading above 2.78 levels. Immediate resistance poised at 2.92-95 levels and the midterm resistance comes at 3.12 regions from where we may see some correction due to profit taking.
6th consecutive week of fall (-1.5M B) in U.S oil inventory, which could be supportive for the entire energy pack. Brent (52.20) is out of its midterm bearish channel as it is trading above 51.30 regions. Immediate resistance comes at 53 levels and a close above that could open up 56 as well. WTI (49.46) is also moved higher and a close above 51 could be the end of midterm bearish trend in WTI too. We will remain bullish on Brent and WTI, while they are trading above 48.70 and 45.50 levels on a weekly closing basis.
FOREX
Fed speakers reiterating caution over further interest rate hikes keeps Dollar weak while Rupee crashes below the 4-month floor of 64.
Dollar Index (92.96) has been declining in a very narrow channel and despite the minor recovery following the fresh low at 92.54; it needs a break above 93.20-50 to signal at least a pause. The downside target of 92.00 remains unchanged. Euro (1.1845) has hit a high above 1.19 already and the target of 1.20 looks just like matter of time with the current momentum. If the US NFP data comes weak on Friday, Dollar may decline towards 92 and Euro may surge towards 1.20.
Dollar-Yen (110.67) has tested tour resistance of 111.00-10 but failure to rise above it can drag the pair down towards 109.50 once more.
Pound (1.3217) has not moved in the last session at all waiting for the BOE decision today. View remains unchanged. Repeat - if the current pause phase stays limited to 1.3170 to the downside, the bullish momentum remains intact which may take it to 1.3330 and even 1.3420.
Aussie (0.7932) continues its corrective mode. While it may be too early to say but a consolidation in the form of a Triangle in the range of 0.7875-0.8050 for a few sessions looks like a fair possibility. Higher targets of 0.8100-70 will be negated only on a break below 0.7875.
As a result of the RBI meet, Dollar Rupee (63.70) crashed below 64.00, exactly in line with our expectations. 64.00-10 may limit any corrective bounce now as Dollar Rupee may decline to 63.55 and then 63.30-25 in the next few sessions.
INTEREST RATES
The US yields continue to fall. The 5Yr (1.82%), 10Yr (2.26%) and the 30Yr (2.85%) are all trading lower from previous levels of 1.83%, 2.29% and 2.87% respectively. There could be some recovery in the coming sessions.
The US-Japan 10YR (2.19%) is testing near term support at current levels and could bounce back towards 2.31% soon.
The German-Us 10Yr (-1.78%) could come down towards -1.84% in the near term before again bouncing back to current levels while the German-Us 2Yr (-2.05%) is testing support at current levels and could bounce back just now.
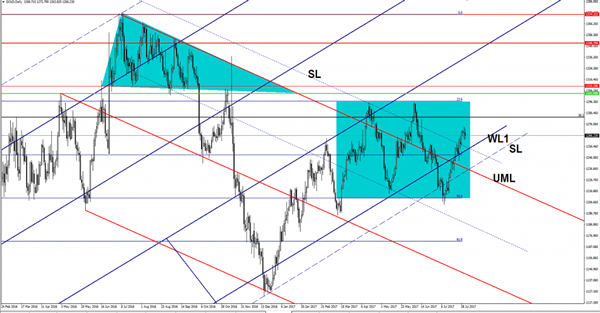
GOLD More Upside In View
The yellow metal continues to move in range, is trapped between the 23.6% and the 50% retracement levels. Could come down to retest the warning line (WL1) of the ascending pitchfork before will resume the upward movement. We could go long if the mentioned support will hold, the next important target is near the $1295 per ounce.
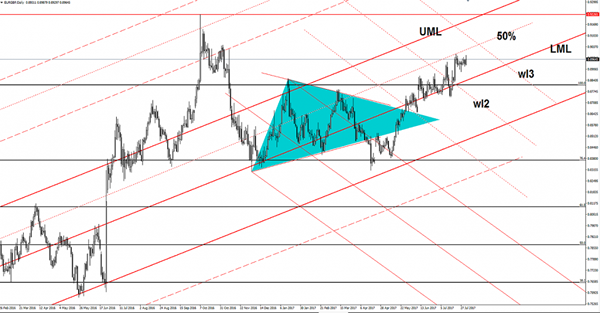
EUR/GBP Poised For Further Gains?
Price is narrowing and is struggling to resume the upside movement as it is located in the buyer’s territory. Has somehow expected to decrease on the short term to retest the median line (ML) of the major ascending pitchfork, but the buyers are very strong and have kept the rate higher.
Is trading above the 0.8950 level and is approaching the 0.8976 previous high, could reach also the 0.9000 psychological level as the Euro is strongly bullish and the Cable looks tired.
EUR/USD At New Highs
EUR/USD jumped much higher on Wednesday deleting the Tuesday’s losses and now needs to stabilize above the broken dynamic resistance if will want to resume the upside movement. Price rallied today and the USDX plunged and resumed the bearish movement, but the index has failed to reach the 92.49 static support.
USDX squeezed a little in the last hours and forced the EUR/USD to slip lower, but unfortunately, the dollar index maintains a bearish bias on the Daily chart. Personally, I believe that the USDX could find strong support at the 92.49 downside obstacle and could increase again.
The price action could be influenced by the fundamental factors today, the economic calendar is filled with important economic reports. You should keep an eye on the calendar to see what will move the rate.
Price has managed to resume the upside movement and to jump much above the upper median line (uml) of the minor ascending pitchfork and above the 1.1845 previous high. Will increase further if will close above the upper median line (uml). Only a false breakout above the uml will signal an overbought and a potential drop.
I want to remind you that the next upside target will be at the 50% Fibonacci line (ascending dotted line), a failure to reach this level will send the rate tumbling on the short term. I want to remind you that the bias is bullish, only an impressive USDX’s rally will force the pair to turn to the downside.

FX Markets Sputter Along
FX markets are a bit messy as summer market liquidity is not helping matters but currency markets stammer along.
EURO
A very choppy overnight session void of any particular catalyst but the eye opening interest in the EUR crosses has percolated through to EURO strength once again. With the EURUSD downside appearing very limited at this stage traders are left mulling the decision to either flatten up and hope for a dip buying opportunity or throw all caution to the wind and jump in at the top of the current cycle hoping for a test of 1.2000.
Overnight volumes were dominated by investors clamouring for high side EUR exposure, but the greenback in general remains under the microscope as the market is itching for some clarity on both the US economic landscape and the muddled US political panorama.
Friday's NFP is shaping up to be a majorly significant event.With summer setting in and holiday liquidity upon us, Friday's jobs report could be the last hurrah before what is shaping up to be a very interesting Septemeber for Fed watchers. I suspect the street will be locked and loaded
Australian Dollar
The Aussie continues to give way as President Trump prepares to dig his heels in and intensify US scrutiny into Beijing's trade practices. Since Australia is a major player in the APAC supply chain, the idea of an escalating trade war between the world's two major super powers is not sitting well with AUD investors this morning.
USD/CAD Canadian Dollar Lower On Trade Concerns Despite Oil Surge
The Canadian dollar is trading lower against the US dollar on Wednesday. The loonie failed to capitalize on the US private payrolls slip and the rise in oil prices after a surprise gasoline demand surge. The Trump Administration has turned its focus on immigration and trade putting pressure on the Canadian currency.
The ADP private payrolls report disappointed in the early North American session by showing a gain of 178,000 jobs instead of the anticipated 187,000. The miss still leaves US employment with a solid gain, but creates some anxiety about the U.S. non farm payrolls (NFP) to be released on Friday. Investors and the U.S. Federal Reserve will be looking more closely at the wage growth numbers than the jobs added, as low inflation could force the central bank to leave interest rates unchanged for the remainder of the year.
The Canadian dollar is still one of the most solid currencies this year and got a boost form the Bank of Canada (BoC) as the central bank hiked rates in July after a short signalling campaign that started in mid June. The Canadian benchmark interest rate sit at 75 basis points with another 25 basis points hike expected in October. The monetary policy gap between the Fed and the BoC should not grow beyond that, but concerns about the Trump administration’s tough stance on trade could spell trouble for Canada ahead of the NAFTA renegotiation talks.
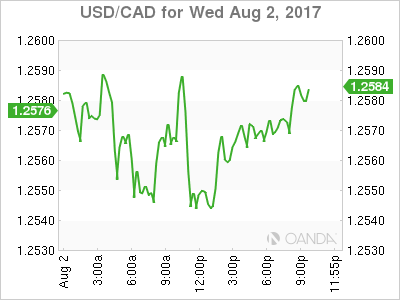
The USD/CAD rose 0.17 percent on Wednesday. The currency pair is trading at 1.2553 with the CAD losing ground to the USD ahead of employment data for both nations on Friday. The USD has climbed back from weekly lows although it is still struggling with non-commodity based currencies. Oil prices failed to lift the loonie against the USD as political risks once again took center stage.
The USD/CAD has gained 0.629 percent in the past five days. Political uncertainty has hurt the USD against most majors, but the CAD due to its close trade relationship has been under pressure. Three quarters of Canadian products are sold to the United States and while the Trump administration has failed to get traction on big policy reforms, trade is something where he could have a big impact. The problem for the market is trying to forecast which kind of impact it will be. With winners and losers on all three NAFTA nations the worst case scenario would be to scrap the deal, but that is still one of the possible outcomes if Trump’s rhetoric is to be believed.
NAFTA renegotiations talks will begin in two weeks. Mexico and the US have said they favour a quick resolution to avoid further politicizing the negotiations with upcoming elections in 2018.
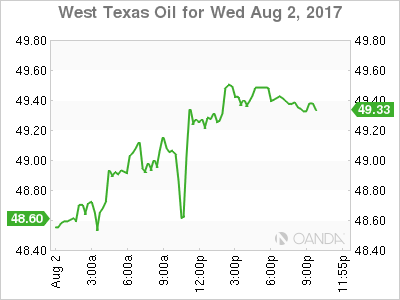
Oil prices rose 1.202 percent in the last 24 hours. West Texas Intermediate is trading at $49.24 after the release of US weekly inventories showed a larger than expected growth in demand. The Energy Information Administration (EIA) reported a lower than forecasted drawdown of crude stocks. Weekly figures dropped 1.5 million barrels instead of the 3.2 million expected. The surprise came in gasoline demand with a record high 9.842 barrels. Given that appetite for gasoline and other energy products was seen as stagnant the rise in demand at the seasonal driving season boosted oil prices.
US producers are signalling in slowdown in rig counts citing profitability concerns and Saudi Arabia is rumoured to be limiting output to US destinations to impact oil pricing through US crude stocks weekly reports. The winners have been Canadian producers that are filing in to cover the gap in demand. The Organization of the Petroleum Exporting Countries (OPEC) and other major producers partnered in a production cut agreement last year which they have extended until March 2018.
Even with this deal diminishing the supply glut there were few signs of rising demand until this week’s EIA report. It remains to be seen if this was an outlier or a part of a larger trend.
Market events to watch this week:
Thursday, August 3
4:30 am GBP Services PMI
7:00 am GBP BOE Inflation Report
7:00 am GBP MPC Official Bank Rate Votes
7:00 am GBP Monetary Policy Summary
7:00 am GBP Official Bank Rate
7:30 am GBP BOE Gov Carney Speaks
8:30 am USD Unemployment Claims
10:00 am USD ISM Non-Manufacturing PMI
9:30 pm AUD RBA Monetary Policy Statement
9:30 pm AUD Retail Sales m/m
Friday, August 4
8:30 am CAD Employment Change
8:30 am CAD Trade Balance
8:30 am USD Average Hourly Earnings m/m
8:30 am USD Non-Farm Employment Change
Will BoE Divisions Remain as Inflation Cools?
Super Thursday in the UK is rarely a dull event and this week is certainly going to be no different, as policy makers at the Bank of England grow increasingly divided on the topic of interest rates.
Uncertain BoE Outlook Could Spur Volatility on Thursday
The job of the Monetary Policy Committee has been made increasingly difficult since the EU referendum, with inflation having surpassed its 2% target at a time when the economy is slowing and the uncertainty over the outcome makes forecasting extremely difficult.
This has created divisions within the committee over whether to raise interest rates to keep a lid on inflation and risk hurting the economy, or allow inflation to run a little higher in the short term and support the economy through this tough period. With the committee split, things could get quite volatile in the markets as we try to establish what all this means for interest rates in the coming years.
At the last meeting, the committee voted 5-3 in favour of leaving interest rates unchanged, the closest the vote has been for such a move since May 2011. This happened despite people only expecting one vote in favour of a hike and showed that the committee was far more divided than markets had anticipated.
Not only that, Andy Haldane - Chief Economist at the BoE - voted in favour of keeping rates unchanged at the last meeting but has since suggested he could vote for a hike if data comes in as expected.
Source - The Telegraph
While one dissenter - Kirstin Forbes - has since left the committee, the vote remains too close to be in any way certain about what action the central bank will take.
What is the Market Expecting?
Still, the market is only pricing in an 8% chance of a 25 basis point rate increase on Thursday. The drop in inflation last month from 2.9% to 2.6% (2.6% to 2.4% for core) is likely the reason for this, with the cooling in price pressures alleviating the pressure on policy makers to raise rates.
This all assumes that the inflation data was in fact the main reason behind the decision to favour a rate hike and that similar noises coming from other central banks in recent months in just a mere coincidence. While a rate hike on Thursday seems unlikely, it may well be the case that the desire among some policy makers to raise interest rates hasn't actually faded as much as you'd think.
The fact that the pound isn't too far below the levels it traded at prior to the latest inflation data - as are yields on UK debt - may suggest that traders still expect the BoE to maintain a more hawkish stance than it did earlier this year and stand ready to hike. This may all become clearer on Thursday.
Not only do we have the monetary policy decision and the minutes to contend with, but as it's Super Thursday a press conference with Governor Mark Carney and his colleagues, and the quarterly inflation report will also accompany them. Needless to say, an uncertain monetary policy outlook combined with all of this should ensure we have plenty of volatility in GBP, UK Bonds and the FTSE on Thursday.
Gold Edges Higher as ADP Nonfarm Payrolls Misses Expectations
Gold has posted slight gains in the Wednesday session. In North American trade, spot gold is trading at $1271.84, up 0.24% on the day. On the release front, ADP Nonfarm Employment Change rebounded with a reading of 178 thousand, but this was short of the forecast of 187 thousand. Thursday will be busy, as the US releases two key events – unemployment claims and ISM Non-Manufacturing PMI. On Friday, we'll get a look at Nonfarm Employment Change, which should be treated as a market-mover. The indicator is expected to slow to 181 thousand, compared to 222 thousand a month earlier.
Gold enjoyed a good month of July, as XAU/USD jumped 2.0%. The US dollar has softened, and even a solid Advance GDP last week failed to stem the greenback's slide. The first GDP report for the second quarter came in at impressive 2.6%, beating the estimate of 2.5%. This strong expansion should put to rest concerns of a second straight quarter of weak growth – Final GDP came in at just 1.4%. Still, EUR/USD soared in July, gaining 3.5%. Investors remain concerned that low inflation in the US could mean that the Fed will balk and not raise interest rates in December, despite all but promising to increase rates three times in 2017. In June, Fed Chair Janet Yellen dismissed low inflation as "transient", but she has since changed her tune, as economists remain at a loss to explain why a red-hot economy has not translated into stronger wage growth, and hence higher inflation. The markets are skeptical about a December hike, with the odds at just 42%, according to the CME Group.