
Sample Category Title
Dow E-mini Future Elliott Wave Calling Upside
In this Technical blog we are going to take a quick look at the past 1 hour Elliott Wave performance of Dow E-Mini Future (YM_F ) cycle from June 19 peak, which we presented to our clients at elliottwave-forecast.com. We are going to explain the structure from that cycle.
Dow E-mini Future 1 Hour Elliott Wave Chart from June 29
The cycle from May low April 19,2017 low has ended in the index at June 19 peak (21494). Below from there index was correcting the April cycle & expected to find buyer's in 3 or 7 swings for further upside in the index. The structure from the peak looks to be overlapping, hence suggested that it's a corrective structure from the peak. Where First leg lower ended i.e. Minute wave ((w)) at (21297) & Minute wave ((x)) ended at (21497) and 21235-21185 100%-123.6% extension area was expected to find buyer's in the index for more upside or for a 3 wave bounce at least.
Dow E-mini Future 1 Hour Elliott Wave Chart from July 12
Then the index found the dip again at 21225 low in Minute wave ((x)) as expected in 3 swings and resume the next leg higher in the index towards 21600-21688 100%-123.6% fibonacci extension area of previous ((w))-((x)) to end the cycle from June 29 low (21137) and to start the Minor wave X correction. ( Note we adjusted some degree of labeling on the chart to align with higher degree time frames).
Dow E-mini Future 1 Hour Elliott Wave Chart from July 25
The index ended the cycle from June 29 low in Minor wave W higher at 21676 peak and also finished correcting that cycle in Minor wave X at 21442 low as Regular flat structure and above from there and more importantly as far as the pivot from June 29 low stayed intact was expected to resume the upside in Minor Y leg higher to complete the 7 swings structure from June 29 low (21137).
Dow E-mini Future 1 Hour Elliott Wave Chart from July 27
As the dips remained above 21444 low index broke to new highs suggesting the next leg higher has started in the index & so the near term focus remained towards 21719-21769 area to start the 3 waves back in the index within Minutte wave (x) before further upside was seen.
Dow E-mini Future 1 Hour Elliott Wave Chart from July 28
Then the index did a shallow connector in Minutte wave (x) pullback at 21632 and resume higher as expected and now has already reached the 100%-123.6% fibonacci extension area at 21933-22049 target area from June 29 low in 7 swings target area from the longs we had from June 29 low.
Brent Oil Struggling to Stay Higher
Brent Oil plunged in the yesterday's session, but failed to retest the sliding parallel line (descending dotted line) of the descending pitchfork, signaling that he could climb higher again. Is trading right above the $52.00 per ounce, should approach the 53.03 major static resistance again if will stay above this level. We could have a consolidation before will approach the near term targets, a retest of the uptrend line (ascending dotted line) will bring us a good buying opportunity.
AUD/USD Trading Within an Ascending Channel
AUD/USD is trading within an ascending channel, is trapped between the upper median line (uml) and the first warning line (wl1) of the minor ascending pitchfork. Could increase again as long as stays above the upper median line (uml), only a drop below this dynamic support will open the door for more declines.
GBP/USD Breakout Favored
The GBP/USD is trading in the green on the daily chart and now is pressuring a strong dynamic resistance. A valid breakout will confirm a further increase on the short term, the perspective is bullish because is located in the buyer's territory.
USD is still weak as the dollar index maintains a bearish perspective, the index has decreased today, but failed to drop below the 92.80 previous low. USDX could start a minor accumulation above the 92.49 major static support and could start another shy upside movement.
Right now the dollar index looks too oversold to drop much below the 92.49 static support, but we cannot sat for sure that we'll have another leg higher in the upcoming weeks because the US data could ruin everything if will come in worse.
We'll see what will happen later as the US is to release the ADP Non-Farm Employment Change, the economic indicator could increase from 158K to 187K in July, a positive report will help the greenback to bounce from the lows, but another disappointment could ruin the minor upside perspective.
You can see that is pressuring the upside line of the ascending channel, a valid breakout will send the rate towards the lower median line (lml) of the ascending pitchfork and higher towards the 1.3527 static resistance.
However a rejection from here will push the rate down again and could reach the warning line (wl1) again, where he could find support. The perspective is bullish after the retest of the upper median line (UML) of the major descending pitchfork.
A minor decrease could bring us a good buying opportunity, so right now we should stay away to see if we'll have a breakout or not.
USD/JPY Mid-Day Outlook
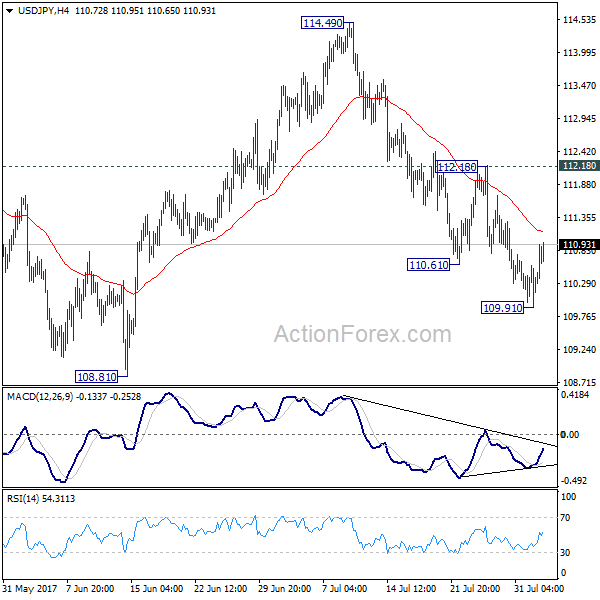
Daily Pivots: (S1) 110.00; (P) 110.29; (R1) 110.67; More....
Intraday bias in USD/JPY remains neutral as the recovery from 109.91 is still in progress. Overall near term outlook remains bearish as long as 112.18 resistance holds and another fall is expected. Below 109.91 will target 108.81 support first. Break there will resume whole correction from 118.65 and target 61.8% retracement of 98.97 to 118.65 at 106.48. Nonetheless, break of 112.18 resistance will dampen this bearish view and turn focus back to 114.49 resistance instead.
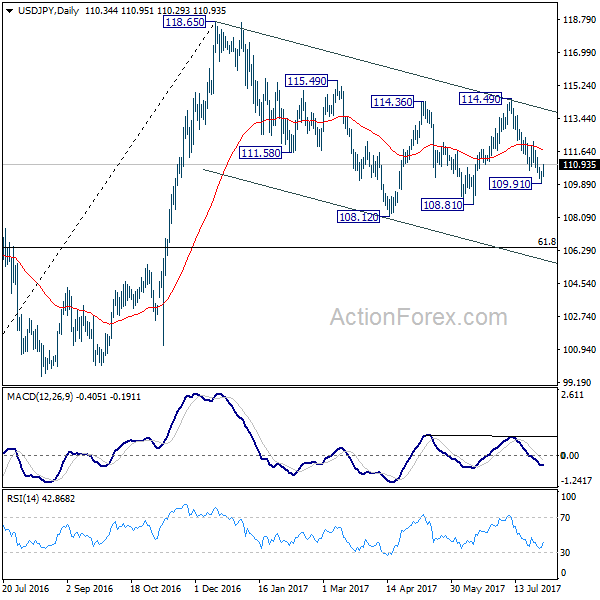
In the bigger picture, the corrective structure of the fall from 118.65 suggests that rise from 98.97 is not completed yet. Break of 118.65 will target a test on 125.85 high. At this point, it's uncertain whether rise from 98.97 is resuming the long term up trend from 75.56, or it's a leg in the consolidation from 125.85. Hence, we'll be cautious on topping as it approaches 125.85. If fall from 118.65 extends lower, down side should be contained by 61.8% retracement of 98.97 to 118.65 at 106.48 and bring rebound.
USD/CHF Mid-Day Outlook
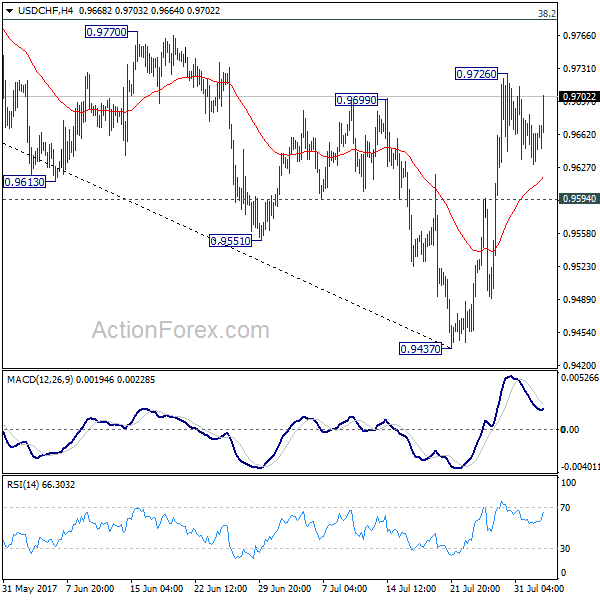
Daily Pivots: (S1) 0.9630; (P) 0.9657; (R1) 0.9682; More...
USD/CHF rebounds strongly today but stays below 0.9726 so far. Intraday bias remains neutral for first. Overall, another rise is expected as long as 0.9594 support holds. Prior break of 0.9699 resistance suggests near term reversal after defending 0.9443 key support. Above 0.9726 will target 38.2% retracement of 1.0342 to 0.9437 at 0.9783 first. Break will target channel resistance (now at 0.9899). However, firm break of 0.9594 will dampen this bullish view and turn bias back to the downside for 0.9437.
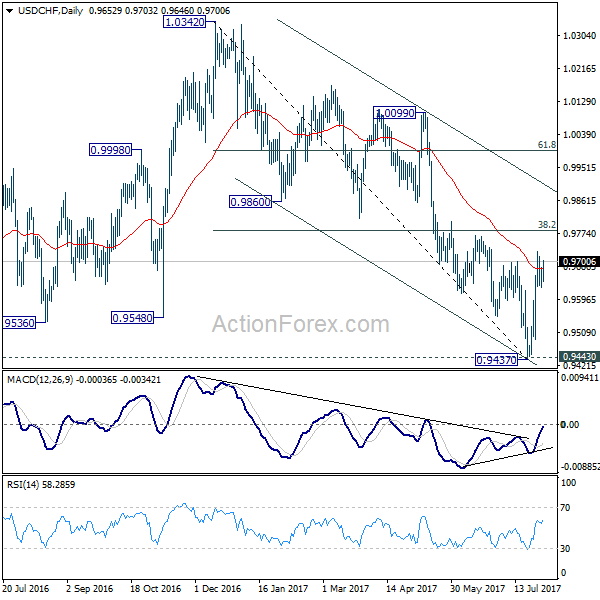
In the bigger picture, current development argues that USD/CHF has successfully defended 0.9443 key support level. And long term range trading in 0.9443/1.0342 is extending with another rise. At this point, there is no sign of an up trend yet. Hence, while further rise is expected in USD/CHF, we'll start to be cautious on loss of momentum above 61.8% retracement of 1.0342 to 0.9437 at 0.9996.
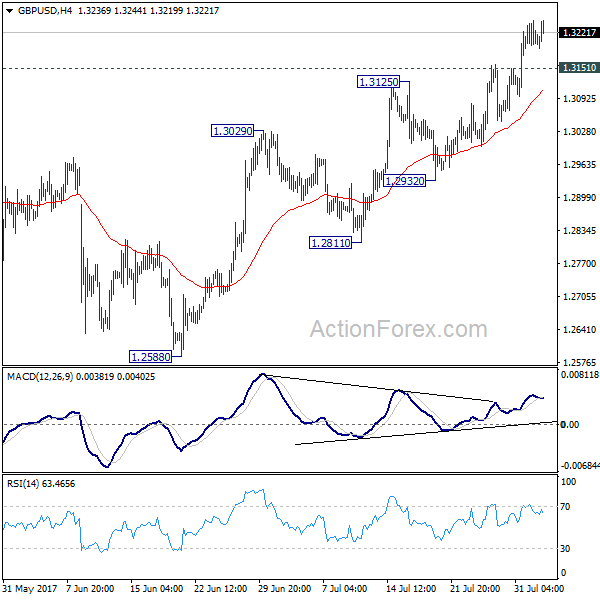
GBP/USD Mid-Day Outlook
Daily Pivots: (S1) 1.3181; (P) 1.3213; (R1) 1.3235; More...
Intraday bias in GBP/USD remains on the upside for the moment. Current rise could extend towards 1.3444 key resistance. But still, price actions from 1.1946 are viewed as a corrective pattern. Hence, we'll look for topping signal again around 1.3444. On the downside, below 1.3151 minor support will turn bias neutral first. Further break of 1.2932 support will indicate reversal and will turn bias to the downside to target 1.2588 key support next.
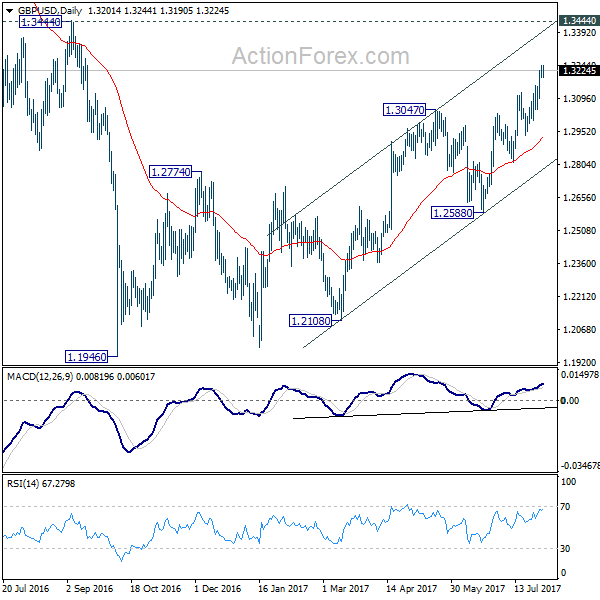
In the bigger picture, overall, price actions from 1.1946 medium term low are seen as a corrective pattern that is still in progress. While further upside is expected, larger outlook remains bearish as long as 1.3444 key resistance holds. Down trend from 1.7190 (2014 high) is expected to resume later after the correction completes. And break of 1.2588 will indicate that such down trend is resuming.
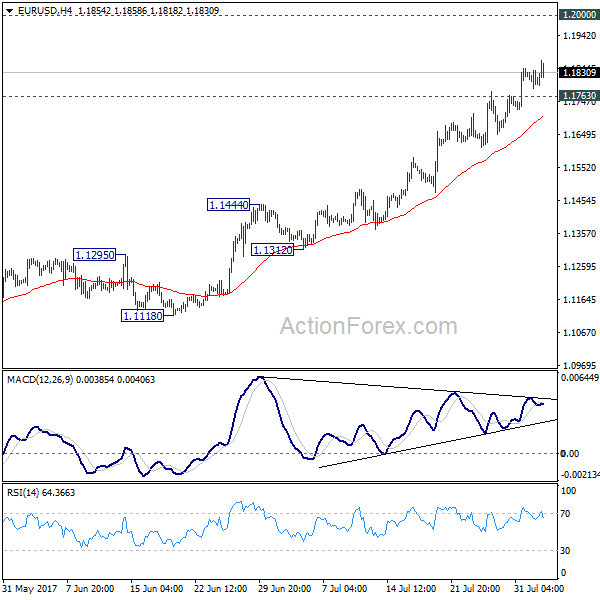
EUR/USD Mid-Day Outlook
Daily Pivots: (S1) 1.1775; (P) 1.1810 (R1) 1.1835; More...
Intraday bias in EUR/USD remains on the upside as the rise from 1.0339 is still in progress. Such rally would target 1.2 handle next. Firm break there will pave the way to next key fibonacci level at 1.2516. On the downside, below 1.1763 minor support will turn intraday bias neutral and bring consolidation before staying another rally.
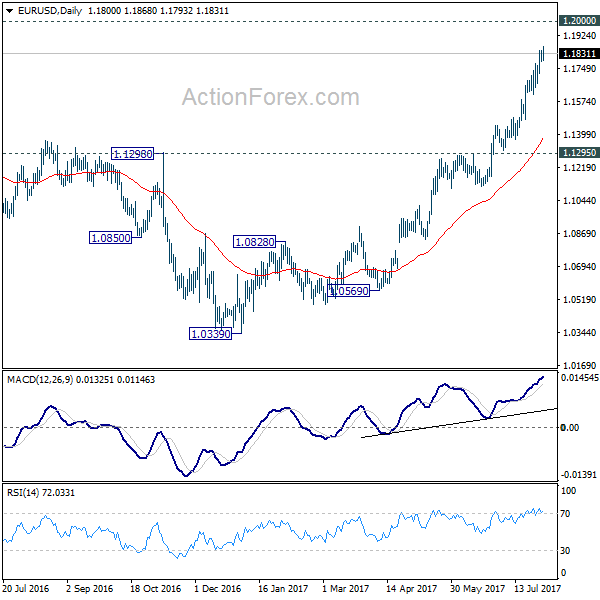
In the bigger picture, an important bottom was formed at 1.0339 on bullish convergence condition in weekly MACD. Sustained break of 55 month EMA (now at 1.1760) will pave the way to key fibonacci level at 38.2% retracement of 1.6039 (2008 high) to 1.0339 (2017 low) at 1.2516. While rise from 1.0339 is strong, there is no confirmation that it's developing into a long term up trend yet. Hence, we'll be cautious on strong resistance from 1.2516 to limit upside. But for now, medium term outlook will remain bullish as long as 1.1295 support holds, in case of pull back.
Dollar Steady Despite ADP Employment Missed Expectations, Euro Remains the Strongest One
Dollar is steady in early US session and is little affected by job data miss. The ADP employment report showed 178k growth in private sector jobs in July, below expectation of 190k. DOW futures also stay steady and the index could have a go at 22000 handle today as recent rally extends. Non-farm payroll to be released on Friday is a key event to watch. And it's expected to show 180k growth overall in July. But the fate of dollar will rely heavily on what fiscal policy US President Donal Trump can push through. It's widely known that no the healthcare bill collapsed, tax reform is the next priority. Trump and the Republicans are targeting to complete it by year end. But so far, there is no details on it and there are reports of griefs from Republicans on the issue. Staying in the forex markets, Euro remains the strongest one after PPI data beat expectation. Sterling comes second but it could be vulnerable on tomorrow's BoE super Thursday. New Zealand Dollar extends the post job data weakness. Canadian Dollar is trading softer as WTI is unable to regain 50 handle yet.
UK construction PMI dropped to 11 month low
UK construction PMI dropped sharply to 51.9 in July, down from 54.8 and missed expectation of 54.0. That's also the lowest level in 11 months. Markit noted that "the combination of weaker order books and sharply rising construction costs provides a concern that an extended soft patch for the construction sector may be on the horizon." Nonetheless, UK PMI manufacturing released yesterday beat expectation and rose to 55 in the same month. Also from UK, BRC shop price index dropped -0.4% yoy in July. BoE rate decision and quarterly inflation report tomorrow will be the main focus for UK.
Swiss SVME PMI hit six year high
Swiss SVME PMI rose to 60.9 in July, up from 60.1 and beat expectation of 58.8. That's the highest level in six years since February 2011. It's also way above long term average of 53.89. Credit Suisse which compiles the index together with the Swiss SVME, said that "this pleasing development points towards dynamic industrial output in the months to come." Also from Swiss, retail sales rose 1.5% yoy in June, above expectation of 1.3% yoy. SECO consumer confidence improved to -3 in July, meeting consensus.
Also released from Europe, Eurozone PPI dropped -0.1% mom, rose 2.5% yoy in June.
Kiwi pressured after job data
New Zealand Dollar remains the weakest one today as selloff started after worst than expectation job data. New Zealand employment dropped -0.2% qoq in Q2, much weaker than expectation of 0.7% qoq rise. Unemployment rate dropped to 4.8%, down from 4.9%. Private sector labor cost rose 0.4% qoq, in line with consensus. The data affirmed RBNZ's stance to stand pat in the environment of global policy stimulus exit.
Also released earlier in Asian Pacific, Australia building approvals rose 10.9% mom in June. Japan monetary base rose 15.6% yoy in July. Japan consumer confidence rose to 43.8 in July.
Oil lost 50 on supply worries
Crude oil prices retreated after a 6-day rally, and failed to sustain above 50 handle, upon receiving some hard data pointing to abundant supply. The industry-sponsored API estimated that crude oil inventory increased 1.8 mmb in the week ended July 28. For refined oil products, gasoline and distillate stockpiles fell -4.8 mmb and -1.2 mmb respectively. Separately, a Reuters survey estimated that OPEC output increased 0.09M bpd in July to a 2017 high of 33M bpd. With an output cut compliance level climbing to 84% from 77% in June, the rise was contributed by Libya and Nigeria. The survey suggested that the biggest rise came from Libya, where output rose to an average of more than 1M bpd.
EUR/USD Mid-Day Outlook
Daily Pivots: (S1) 1.1775; (P) 1.1810 (R1) 1.1835; More...
Intraday bias in EUR/USD remains on the upside as the rise from 1.0339 is still in progress. Such rally would target 1.2 handle next. Firm break there will pave the way to next key fibonacci level at 1.2516. On the downside, below 1.1763 minor support will turn intraday bias neutral and bring consolidation before staying another rally.
In the bigger picture, an important bottom was formed at 1.0339 on bullish convergence condition in weekly MACD. Sustained break of 55 month EMA (now at 1.1760) will pave the way to key fibonacci level at 38.2% retracement of 1.6039 (2008 high) to 1.0339 (2017 low) at 1.2516. While rise from 1.0339 is strong, there is no confirmation that it's developing into a long term up trend yet. Hence, we'll be cautious on strong resistance from 1.2516 to limit upside. But for now, medium term outlook will remain bullish as long as 1.1295 support holds, in case of pull back.
Economic Indicators Update
| GMT | Ccy | Events | Actual | Forecast | Previous | Revised |
|---|---|---|---|---|---|---|
| 22:45 | NZD | Unemployment Rate Q2 | 4.80% | 4.80% | 4.90% | |
| 22:45 | NZD | Employment Change Q/Q Q2 | -0.20% | 0.70% | 1.20% | 1.10% |
| 22:45 | NZD | Labor Cost Private Sector Q/Q Q2 | 0.40% | 0.40% | 0.40% | |
| 23:01 | GBP | BRC Shop Price Index Y/Y Jul | -0.40% | -0.30% | ||
| 23:50 | JPY | Monetary Base Y/Y Jul | 15.60% | 16.60% | 17.00% | |
| 01:30 | AUD | Building Approvals M/M Jun | 10.90% | 1.00% | -5.60% | -5.40% |
| 05:00 | JPY | Consumer Confidence Index Jul | 43.8 | 43.5 | 43.3 | |
| 05:45 | CHF | SECO Consumer Confidence Jul | -3 | -3 | -8 | |
| 07:15 | CHF | Retail Sales (Real) Y/Y Jun | 1.50% | 1.30% | -0.30% | |
| 07:30 | CHF | SVME PMI Jul | 60.9 | 58.8 | 60.1 | |
| 08:30 | GBP | Construction PMI Jul | 51.9 | 54 | 54.8 | |
| 09:00 | EUR | Eurozone PPI M/M Jun | -0.10% | -0.10% | -0.40% | -0.30% |
| 09:00 | EUR | Eurozone PPI Y/Y Jun | 2.50% | 2.40% | 3.30% | 3.40% |
| 12:15 | USD | ADP Employment Change Jul | 178K | 190K | 158K | 191K |
| 14:30 | USD | Crude Oil Inventories | -7.2M |
CAC Unchanged As Eurozone PPI Matches Estimate
In the Wednesday session, the CAC index is almost unchanged. Currently, the index is at 5,123.30, down 0.04% on the day. On the release front, Eurozone PPI declined 0.1%, matching the forecast. On Thursday, France and the Eurozone releases Final Services PMI. We’ll also get a look at consumer spending, with the release of Eurozone Retail Sales.
Eurozone inflation remains mired at low levels, and there was no relief from Eurozone PPI in June. The index declined 0.1%, its second straight decline. The indicator has not managed to post a gain since January. Elsewhere, Eurozone Preliminary Flash GDP posted a respectable gain of 0.6% in the second quarter, the highest gain since the first quarter of 2016. With the German locomotive leading the way, the eurozone economy is showing solid consumer consumption and higher business confidence. Unemployment continues to drop, and the June release of 9.1% marked the lowest unemployment level since 2009. The French economy is also showing improvement and expanded 0.5% in the second quarter, compared to 0.3% in the first quarter.
With the eurozone economy finally flexing some muscle in 2017, there has speculation that the ECB would tighten policy, and this has led to some frenzied buying of euros, much to the consternation of the ECB. At a conference of central bankers in June, ECB President Mario Draghi said that the reflationary forces could result in the bank 'adjusting the parameters' of current stimulus. The comments did not appear to mark a change in ECB policy, but investors seized on the remarks and the euro soared. The ECB was caught off guard, and resorted to the unusual step of stating that the markets had misinterpreted Draghi’s comments. Given that fiasco, it’s a safe bet that the ECB will be ultra-cautious in upcoming statements in order to avoid any repeat convulsions in the markets. At the same time, as we approach the December timeline for winding up QE, the ECB would do well to act in a transparent fashion and let the markets know if the QE program will indeed wind up in December. A lack of transparency could trigger market volatility, which is precisely what ECB policymakers wish to avoid.