Sample Category Title
Dollar Weakness Unfolds; Sterling Gains on Manufacturing Rebound
Today's busy schedule of economic data releases kept forex traders active, following significant dollar moves last night. The US currency retraced some of the losses against most of its peers during the early European trading, but those gains were short lived as the greenback's weakness unfolded ahead of the construction spending and PMI data releases.
The European session kicked off with a set of PMIs out of the eurozone and its member countries, followed by the eurozone GDP figures for the second quarter and German unemployment data. In the UK, figures pointing to a manufacturing recovery were of main interest. The eurozone economy accelerated slightly to 0.6% quarter-on-quarter in the three months ending June, in line with analysts' expectations. In the previous quarter, growth was revised down however, from 0.6% to 0.5%. On a 12-month basis, GDP growth edged up from 1.9% to 2.1%, also in line with forecasts and the highest since the final quarter of 2015. Among the released PMI numbers, highly watched figures out of Germany showed that the manufacturing sector there recorded a solid gain last month, though at a slower rate than in June as new orders came in more slowly. The index fell to 58.1 in July's final reading from 59.6 in June, remaining above the 50-expansion mark.
The euro traded above the 1.18 mark against the greenback for most of the day, with the pair last trading at 1.1830, following yesterday's rally on the back of dollar weakness.
Sterling rose to an 11-month high against the greenback, as today's manufacturing data eased concerns of an economic slowdown. The PMI survey for July recovered from a seven-month low as it rose to 55.1 from a downwardly revised 54.2 in June and above expectations of 54.4. The rebound was helped by the biggest influx of new export orders since 2010, which offset tempered growth in manufacturing output. Investors are hoping that the upbeat figures will hearten policymakers at the Bank of England, which will make a policy decision and release its latest quarterly Inflation Report on Thursday. Pound/dollar surged following the survey release to 1.3233 to last trade at about the same level as the US session was under way.
The US morning session was similarly busy with an ample of data releases. Consumer spending barely rose, up 0.1%, in June as personal income stagnated for the first time in seven months due to a decline in dividend payments. Modest growth in consumer spending, which accounts for more than two-thirds of US economic activity, could signal a disappointing third quarter expansion. The personal consumption expenditures (PCE) price index, excluding food and energy, rose 0.1% in June m/m after a similar gain in May. Annually, the PCE index increased 1.5%, mirroring the prior month's gain. The PCE index is the Federal Reserve's preferred inflation measure. Meanwhile, the ISM report showed that US manufacturing expansion cooled in July to 56.3 from a reading of 57.8 the prior month, and narrowly missed expectations of 56.4.
Following all the released US figures, the greenback fell against the yen, last trading just below the 110-mark, while the dollar index hit a 15-month low of 92.77.
Looking at commodities, oil prices pulled back from their two-month high. WTI was last trading at $49.55 a barrel while Brent was at $51.95. Gold gained as demand for the precious metal rose on the back of dollar weakness. Gold was last trading at $1,272.70 an ounce.
U.S. Manufacturing Decelerates in July, But Remains Well in Expansionary Territory
The Institute for Supply Management (ISM) manufacturing index edged down to 56.3 in July, from 57.8 in June. This was a hair below consensus expectations for 56.4.
Most subcomponents were lower on the month, with the exception of inventories which edged up to 50.0 (from 49.0).
In general, most subcomponents indicate healthy growth in activity. Production and new orders both edged down to 60.2 (from 62.4) and 60.4 (from 63.5), respectively. The employment sub-index pulled back 2 points, but at 55.2 remains well in expansionary territory.
Export orders moved down 2 points, while the imports subindex moved up by the same amount. Still, both remain in the 56 to 58 range, indicating healthy growth in international shipments.
Prices paid bucked the downward trend, moving up strongly to 62.0 (from 55.0 in June).
The spread between new orders and inventories pulled back a little, but at 10.6 remains supportive of future growth in the sector. This notion was also corroborated by 15 of the 18 manufacturing industries reporting growth this month, while only petroleum, apparel and textiles reporting contraction.
Key Implications
The U.S. manufacturing sector continues to show healthy growth. The slight deceleration in July is not surprising, following on the heels of June's strong performance.
A rebounding global economy, a relatively steady oil price, and the lower U.S. dollar should continue to support U.S. manufacturing. Assuming a relatively stable political backdrop and little disruption on the trade front, there is little reason not to remain optimistic about manufacturing's prospects. This is corroborated by the forward looking indicators in today's ISM report and relatively optimistic industry views.
The uptick in the price sub-index is a welcome development and should provide some evidence for the Fed that the recent slowdown in inflation will prove transitory.
Spot Gold Accelerated Higher and Hit Fresh Session High
Spot Gold accelerated higher and hit fresh session high (also the highest since 14 June), receiving fresh boost from lower than expected US ISM Manufacturing PMI numbers which pressured the dollar.
Strong uptrend from $1204 (10 July low) approached its next target at $1274 (Fibo 76.4% of $1296/$1204 descend), with $1280 (14 June spike high) also being in focus.
Past three weeks action was shaped in three long bullish weekly candles, with monthly performance being also positive in July (bullish monthly candle with long tail) which is seen as strong bullish signal, along with firm bullish setup of daily technical studies.
Overbought conditions so far did not affect gold's bulls but corrective action should be anticipated in the near term, as daily cloud is twisting later this week and may attract for pullback.
Today's strong downside rejection at $1262, which is the session low, marks initial support, along with broken Fibo 61.8% barrier at $1261, followed by rising 10SMA (1257) and daily Tenkan-sen ($1254) which guard key support at $1249 (weekly cloud top).
US labor data due on Friday will be closely watched for fresh signals.
Res: 1274; 1280; 1288; 1296
Sup: 1262; 1257; 1254; 1249
Can DAX Join A US Stocks “Mania Cycle”?
Good day traders!
German Dax and S&P500 are in negative correction for the last few weeks; with US market trading at all-time high while DAX lost nearly 7% since June 20th high. Technically we see US markets entering into bullish mania phase with DJIA breaking above the upper trendline of an Elliott Wave channel. We may see fifth wave rally to continue up to 24000-25000. Mania cycle is also confirmed by Charles Schwab reports that clients opened the highest number of brokerage accounts in the first half of 2017 since 2000 as highlighted in article by ZeroHedge. Keep in mind that from 2000 peak DJIA lost nearly 40% in two years and S&P500 fell nearly 50%. However, I don't think that top is near yet, as Elliott Wave model appears incomplete; it suggests more upside in coming months.
So if we go back to DAX and US markets correlation, I think that Dax can see more upside and join the mania phase as well while DJIA is trading towards projected levels. In fact Dax came down in three waves to fill the gap around 12000, which can prove out to be a good support area. Break above the upper channel resistance line can be an important evidence that European and US markets are going back into positive correlation. Higher DAX should also impact the EURUSD moves.
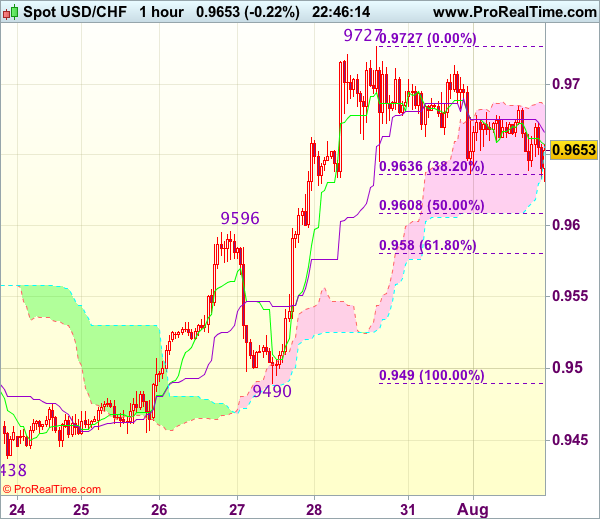
Trade Idea Wrap-up: USD/CHF – Buy at 0.9600
USD/CHF - 0.9655
Most recent candlesticks pattern : N/A
Trend : Near term up
Tenkan-Sen level : 0.9657
Kijun-Sen level : 0.9665
Ichimoku cloud top : 0.9689
Ichimoku cloud bottom : 0.9658
Original strategy :
Buy at 0.9600, Target: 0.9700, Stop: 0.9565
Position : -
Target : -
Stop : -
New strategy :
Buy at 0.9600, Target: 0.9700, Stop: 0.9565
Position : -
Target : -
Stop : -
Dollar’s retreat after faltering below resistance at 0.9727 (last week’s high) has retained our view that further consolidation below this level, hence risk of another retreat to remains, however, previous resistance at 0.9596 should turn into support and contain downside, bring another rise later, above said resistance at 0.9727 would extend recent rise to 0.9750-60, then 0.9780 but reckon 0.9800 would hold from here.
In view of this, would not chase this rise here and would be prudent to buy dollar on subsequent pullback as previous resistance at 0.9596 should turn into support and contain dollar’s downside. Below 0.9580 (61.8% Fibonacci retracement of 0.9490-0.9727) would defer and suggest a temporary top is formed instead, bring correction to 0.9540-50 but price should stay well above support at 0.9490, bring another rise later.
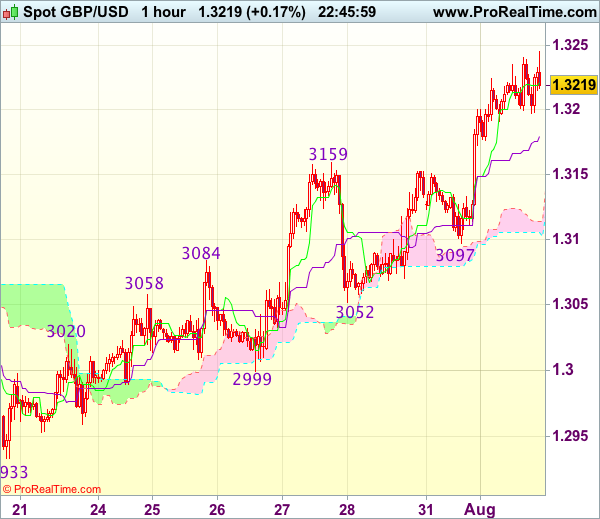
Trade Idea Wrap-up: GBP/USD – Buy at 1.3130
GBP/USD - 1.3216
Most recent candlesticks pattern : N/A
Trend : Near term up
Tenkan-Sen level : 1.3221
Kijun-Sen level : 1.3180
Ichimoku cloud top : 1.3114
Ichimoku cloud bottom : 1.3106
Original strategy :
Buy at 1.3130, Target: 1.3230, Stop: 1.3095
Position : -
Target : -
Stop : -
New strategy :
Buy at 1.3130, Target: 1.3230, Stop: 1.3095
Position : -
Target : -
Stop : -
Yesterday’s rally above previous resistance at 1.3159 confirms recent upmove has resumed and upside bias is seen for further gain to 1.3250, however, near term overbought condition should prevent sharp move beyond 1.3275-80 and reckon 1.3300-10 would hold from here, risk from there has increased for a retreat to take place later.
In view of this, would not chase this rise here and would be prudent to buy cable on pullback as the upper Kumo (now at 1.3114) should contain downside, bring another upmove later. Only below indicated support at 1.3097 would abort and signal a temporary top is possibly formed, bring further fall towards previous support at 1.3052.
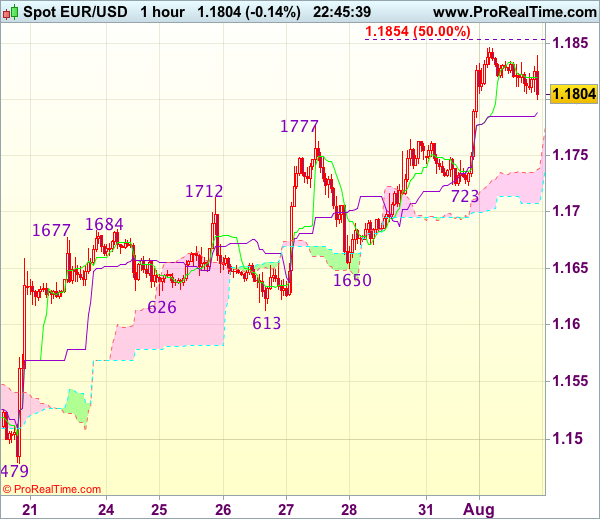
Trade Idea Wrap-up: EUR/USD – Buy at 1.1725
EUR/USD - 1.1793
Most recent candlesticks pattern : N/A
Trend : Near term up
Tenkan-Sen level : 1.1812
Kijun-Sen level : 1.1789
Ichimoku cloud top : 1.1738
Ichimoku cloud bottom : 1.1707
Original strategy :
Buy at 1.1750, Target: 1.1850, Stop: 1.1715
Position : -
Target : -
Stop : -
New strategy :
Buy at 1.1725, Target: 1.1840, Stop: 1.1690
Position : -
Target : -
Stop : -
As the single currency has maintained a firm undertone after yesterday’s rally above last week’s high at 1.1777, adding credence to our bullish view that recent upmove from 1.0340 low is still in progress and upside bias remains for further gain to 1.1850-55 (50% projection of 1.1370-1.1777 measuring from 1.1650) but loss of near term upward momentum should prevent sharp move beyond 1.1875-80 and price should falter below 1.1900-05 (61.8% projection), risk from there has increased for a retreat later.
In view of this, would not chase this rise here and would be prudent to buy euro on pullback as support at 1.1723 should limit downside. Below the lower Kumo (now at 1.0707) would defer and suggest top is possibly formed, bring retracement of recent rise to 1.1680-85 first but indicated support at 1.1650 should hold.
US Personal Income Growth Stalls in June; Dollar Falls after ISM Data
Personal income in the United States was flat in June as a drop in incomes from personal dividends and interest following a big jump in May contributed to the weakest reading in seven months. Expectations were for incomes to rise by 0.4% month-on-month, following a downwardly revised 0.3% gain in May. Disposable income, when accounting for inflation, fell by 0.1% m/m after increasing by 0.5% in the previous month.
Personal spending grew in line with analysts' estimates, rising by 0.1% m/m in June, and there was an upward revision from 0.1% to 0.2% in the prior month's figure. This was the third consecutive month of a slowdown in consumption, and could potentially be a sign of softer consumer spending going into the third quarter.
Growth in the US economy rebounded from an annualized rate of 1.2% to 2.6% in the second quarter of the year on the back of stronger consumer spending and exports. Consumption accounts for around 70% of the US economy and any evidence of weaker spending could add to already declining expectations of a third rate hike by the Fed this year.
It wasn't all gloom however in today's data release. Wages and salaries picked up to 0.4% m/m in June after rising by just 0.1% in May. This could potentially indicate that personal incomes will bounce back in the coming months, supporting further increases in consumption.
In addition, the Fed's preferred measures of inflation - the personal consumption expenditure (PCE) price index and the core PCE price index - were both revised higher in May. The PCE price index was revised from 1.4% to 1.5% in May, though it eased to 1.4% in June. The core measure, which excludes food and energy components, was also revised up from 1.4% to 1.5% and was unchanged in June, suggesting the decline in the index since February wasn't as marked as initially estimated.
The US dollar held on to its modest rebound from a 6½-week low of 109.98 yen touched in Asian trading to around 110.50 yen in the European session after the PCE data came out. However, the greenback came under pressure to once again test the key 110 level after the release of the ISM manufacturing PMI.
The closely-watched index fell to 56.3 in July from 57.8 in the prior month, missing estimates of 56.5. Traders appeared to focus more on the ISM's headline figure and less so on the ISM manufacturing prices sub-index which rose sharply to 62.0 from 55.0, as well as the ISM manufacturing employment index, which fell to 55.2 but this was above expectations of 55.1.
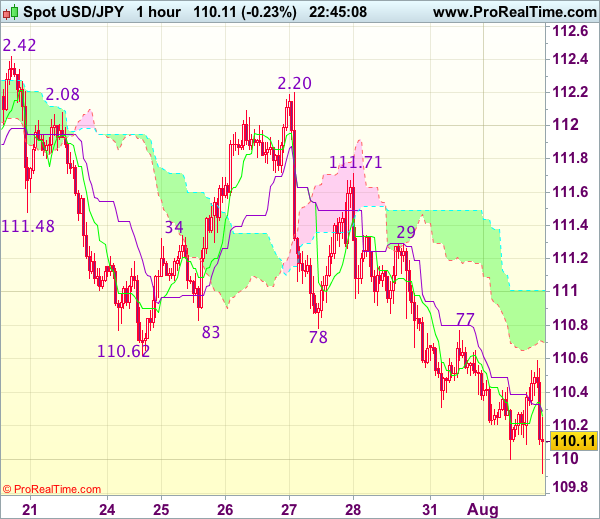
Trade Idea Wrap-up: USD/JPY – Sell at 110.90
USD/JPY - 110.13
Most recent candlesticks pattern : N/A
Trend : Near term down
Tenkan-Sen level : 110.26
Kijun-Sen level : 110.29
Ichimoku cloud top : 111.01
Ichimoku cloud bottom : 110.70
Original strategy :
Sell at 110.90, Target: 109.90, Stop: 111.25
Position : -
Target : -
Stop : -
New strategy :
Sell at 110.90, Target: 109.90, Stop: 111.25
Position : -
Target : -
Stop : -
As the greenback has remained under pressure, suggesting recent selloff from 114.50 top is still in progress and bearishness remains for this move to extend weakness to 109.75-80 but loss of downward momentum should limit downside to 109.50 and reckon 109.20-25 would hold.
In view of this, would not chase this fall here and would be prudent to sell dollar again on subsequent recovery as resistance at 110.77 should limit upside. Above the upper Kumo (now at 111.01) would defer and risk test of 111.29 resistance but only break there would signal a temporary low is formed instead, bring rebound to 111.50-55 first.
Weak End of the Quarter for Income and Spending
Personal income was basically unchanged in June, down $3.5 billion, while personal consumption expenditures were up slightly, by 0.1 percent. However, in real terms, these measures were even weaker.
Personal Income Receipts on Assets Plunge in June
Personal income was almost flat in June, declining $3.5 billion after an increase of $53.2 billion in May. However, the details were not as weak, especially in terms of wages and salaries. Wages and salaries increased $30.8 billion during the month with both goods-producing industries as well as services-producing industries recovering somewhat compared to the previous month. Wages and salaries in the goods sector were up $4.2 billion while they were up $22.9 billion in the services sector. However, all this effort by the producing side of the economy was more than reversed by personal receipts on assets. That is, personal interest income came down another $13.9 billion in June, the third consecutive $13.9 billion decline, while personal dividend income declined $29.9 billion after increasing $45.6 billion in May. This meant that personal income receipts on assets were down $43.9 billion during the month.
Meanwhile, disposable personal income was flat in June while real disposable personal income was even weaker, down 0.1 percent. After a strong showing during the first five months of the year disposable personal income was, perhaps, one of the biggest changes for the June personal income and spending release.
Personal Spending Was Also Weak
At the same time, both nominal and real personal spending were revised up in May but were almost flat in June. Nominal personal spending was up 0.1 percent after an upwardly revised 0.2 percent increase in May, while real personal spending was flat in June after an upwardly revised 0.2 percent in May.
Overall spending was up $8.1 billion after increasing $20.1 billion in May. Goods consumption was down $16.3 billion with the largest decline in nondurable goods consumption, down $11.0 billion versus a decline of $5.3 billion for durable goods. Meanwhile, spending on services was up $24.4 billion during the month, down from $31.1 billion in May, all seasonally adjusted at annual rates.
Second Quarter Ends on a Low Note
Although the quarterly numbers were released last week and both GDP as well as PCE recovered compared to the first quarter of the year, this release shows that both income as well as consumption ended the quarter relatively weak. Furthermore, we saw in last week's release that the revisions to the national account numbers showed a much lower personal saving rate than what the BEA had been reporting. That is, there has been a marked lowering of the personal saving rate compared to what we had previously. May's saving rate was originally reported at 5.5 percent. Now, it is only 3.9 percent while June's rate was 3.8 percent.