
Sample Category Title
EUR/USD Daily Outlook
Daily Pivots: (S1) 1.1315; (P) 1.1352 (R1) 1.1414; More....
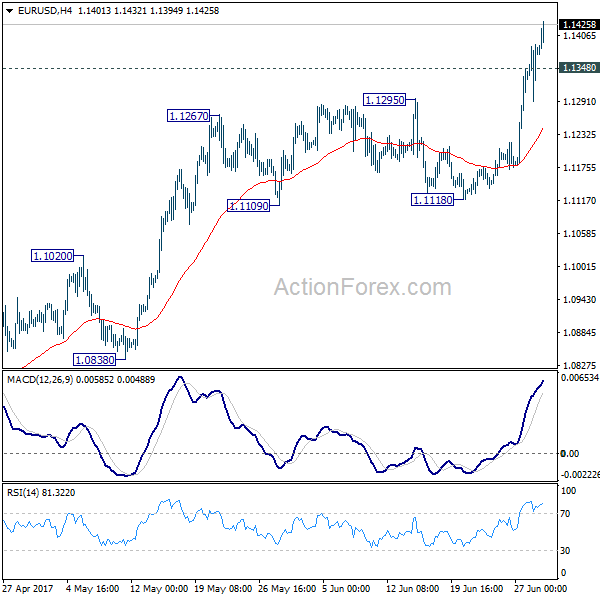
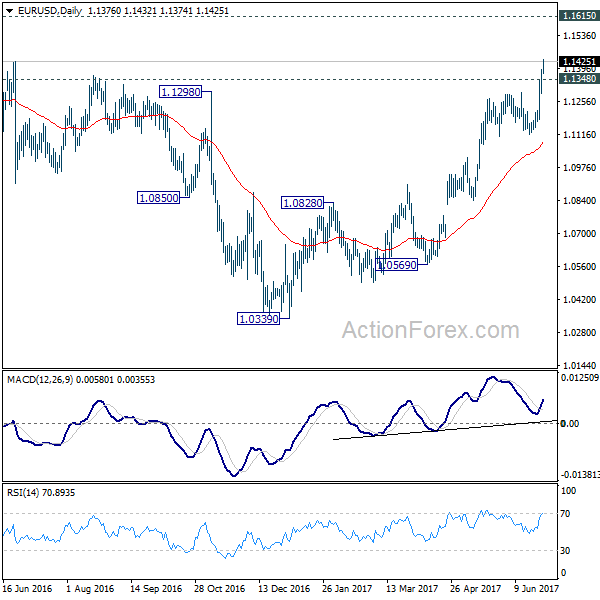
EUR/USD's rally resumed after brief retreat and reaches as high as 1.1432 so far. Intraday bias is back on the upside. Current rally from 1.0339 should target 1.1615 medium term resistance next. On the downside, below 1.1348 minor support will turn intraday bias neutral and bring retreat. But downside should be contained above 1.1118 support and bring rise resumption.
In the bigger picture, the break of 1.1298 resistance further affirm medium term reversal. That is an important bottom was formed at 1.0339 on bullish convergence condition is seen in weekly MACD. Further rise would be seen to 55 month EMA (now at 1.1776). Sustained break there will pave the way to 38.2% retracement of 1.6039 (2008 high) to 1.0339 (2017 low) at 1.2516 next. This will now remain the favored case as long as 1.1118 support holds.
Daily Technical Outlook And Review: EUR/USD, GBP/USD, AUD/USD, USD/JPY, USD/CAD, USD/CHF, DOW 30, GOLD
A note on lower timeframe confirming price action...
Waiting for lower timeframe confirmation is our main tool to confirm strength within higher timeframe zones, and has really been the key to our trading success. It takes a little time to understand the subtle nuances, however, as each trade is never the same, but once you master the rhythm so to speak, you will be saved from countless unnecessary losing trades. The following is a list of what we look for:
- A break/retest of supply or demand dependent on which way you're trading.
- A trendline break/retest.
- Buying/selling tails ... essentially we look for a cluster of very obvious spikes off of lower timeframe support and resistance levels within the higher timeframe zone.
- Candlestick patterns. We tend to only stick with pin bars and engulfing bars as these have proven to be the most effective.
We typically search for lower-timeframe confirmation between the M15 and H1 timeframes, since most of our higher-timeframe areas begin with the H4. Stops are usually placed 1-3 pips beyond confirming structures.
EUR/USD
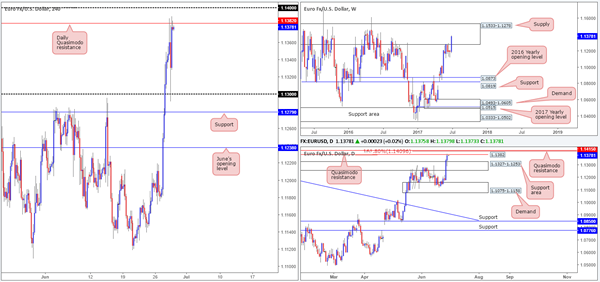
In recent trading, the single currency gravitated north and found resistance around the daily Quasimodo formation pegged at 1.1382. This was a noted level to look for shorts due to this barrier being positioned within the walls of a weekly supply at 1.1533-1.1278. In addition to this, we liked the fact that the Quasimodo was (and still is) located just below a daily AB=CD 161.8% ext. at 1.1409 and the psychological band 1.14. Well done to any of our readers who managed to pin down a short from here. The move from 1.1382 provided at least 80 pips of profit and considering the stop-loss order should have been positioned at 1.1415 (33 pips), this would have been a worthwhile trade.
Moving forward, we can see that the unit is now back within striking distance of the aforementioned daily Quasimodo resistance. Selling from here again, of course, is a possibility, but not something we would advise. The main reason being is that the daily support area at 1.1327-1.1253 was tested yesterday and the sell orders from 1.1382 may be weak.
Our suggestions: The next area of interest for the desk is the daily Quasimodo resistance seen planted a little higher on the curve at 1.1415. Again, we know that this level is fresh, is positioned just above the daily AB=CD 161.8% ext. at 1.1409 and the psychological band 1.14, as well as still being located within the current weekly supply. To that end, we feel a bounce, at the very least, will be seen from 1.1415. Stops can be placed above the Quasimodo pattern’s apex at around 1.1430, and the first take-profit target will be the 1.1382 region: the previous daily Quasimodo pattern.
Data points to consider: German Prelim CPI. US Final GDP q/q figures, as well as the US weekly unemployment claims at 1.30pm GMT+1.
Levels to watch/live orders:
- Buys: Flat (stop loss: N/A).
- Sells: 1.1415 (stop loss: 1.1430).
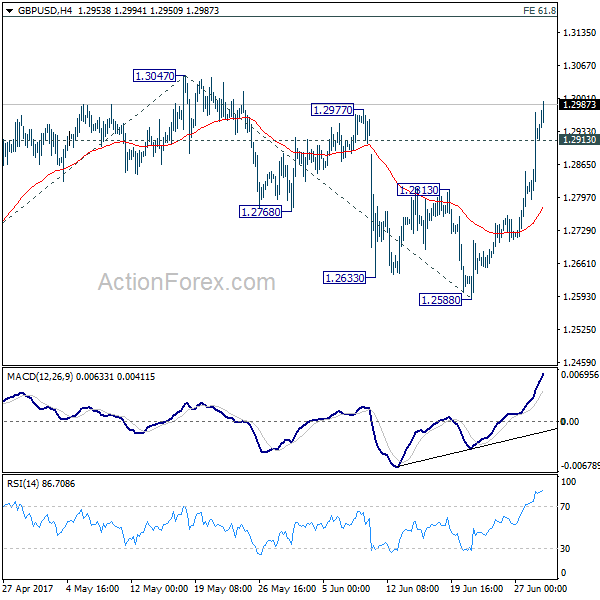
GBP/USD
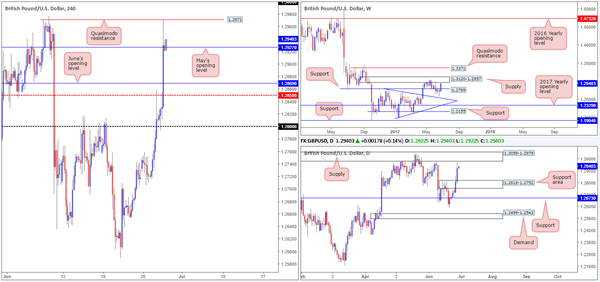
In response to Mark Carney’s comments regarding monetary stimulus, the GBP/USD aggressively rose north. The H4 mid-level resistance at 1.2850 and June’s opening level at 1.2869 were consumed, which, as you can see, left price free to violently whipsaw through May’s opening level at 1.2927.
With H4 bulls looking strong just a few pips above May’s opening level right now, is this a good time to be thinking about buying this market? Let’s take a peek at what the higher timeframes are up to…
Weekly price recently shook hands with supply formed at 1.3120-1.2957. This area has already proven that it has some grit given that it held the unit lower in May. By the same token, daily action came within a cat’s whisker of clipping the underside of supply seen at 1.3058-1.2979. Considering that this area is positioned within the walls of the aforementioned weekly zone, this area is just as significant, in our opinion.
Our suggestions: Entering long therefore, despite H4 bulls demonstrating strength at the moment, is not something we would recommend. Instead, what we’re looking for is H4 price to retest the Quasimodo resistance at 1.2971 and hold firm. Should the reaction manage to produce a bearish candle, preferably a full-bodied candle, our team would consider selling, with an overall take-profit target being set around the top edge of the daily support area at 1.2818.
Data points to consider: US Final GDP q/q figures, as well as the US weekly unemployment claims at 1.30pm GMT+1.
Levels to watch/live orders:
- Buys: Flat (stop loss: N/A).
- Sells: 1.2971 region ([waiting for a reasonably sized H4 bear candle to form – preferably a full-bodied candle – following the retest is advised] stop loss: ideally beyond the candle’s wick).
AUD/USD
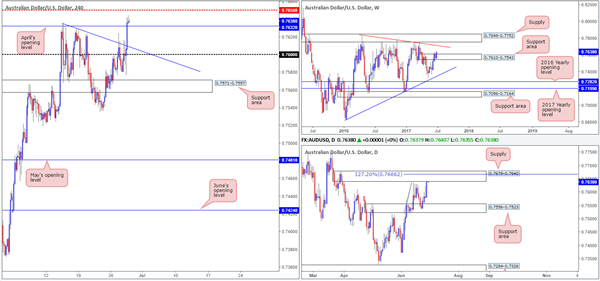
Beginning from the top this morning, the weekly chart shows supply at 0.7610-0.7543, at least in our view, is now well and truly consumed. The next area of interest on this scale can be seen around the trendline resistance extended from the high 0.7835.
Despite the somewhat bullish tone being seen on the weekly chart at the moment, daily price is currently teasing the underside of a supply area coming in at 0.7679-0.7640. This area also happens to hold an AB=CD 127.2% ext. at 0.7666.
Looking over to the H4 chart, we can see that price is now hovering above April’s opening level coming in at 0.7632, and also just ahead of the H4 mid-level resistance barrier drawn from 0.7650. A few pips above this level is a H4 Quasimodo formation (not seen on the chart) seen at 0.7676.
Our suggestions: Buying this market, despite what the weekly timeframe is telling us, is not something we’d label as high probability right now given the current daily supply and nearby aforementioned H4 structures. Along similar lines, selling would also be a tad risky with the weekly support area seen in play at the moment. However, we do feel that should price connect with the H4 Quasimodo level at 0.7676, given that it is positioned within daily supply and nearby the daily 127.2% level, a bounce from here is highly likely. Ultimately though, you will want to get in here with a relatively tight stop here seeing as 0.7650 could halt selling and promote buying.
For us personally, we’re going to remain flat for now and watch how price action behaves during today’s segment before making any further judgment.
Data points to consider: US Final GDP q/q figures, as well as the US weekly unemployment claims at 1.30pm GMT+1.
Levels to watch/live orders:
- Buys: Flat (stop loss: N/A).
- Sells: Possible bounce from 0.7676.
USD/JPY
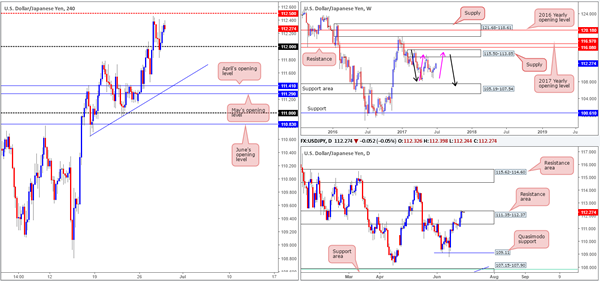
Daily buyers remain keen in this market, despite price trading within the upper edge of a daily resistance area pegged at 111.35-112.37. In addition to this, weekly price shows room to advance up to supply pegged at 115.50-113.85, in the shape of a weekly AB=CD correction (see pink arrows).
However, buying right now, when H4 price is seen loitering beneath a mid-level resistance barrier at 112.50, is not something we would encourage. A break above 112.50, nevertheless, could inspire buyers to enter the market and bring price up to the 113 handle, and possibly the H4 resistance seen at 113.64.
Our suggestions: To prove buyer intent, a H4 close above 112.50 is needed. This – coupled with a retest and a lower-timeframe confirming signal (see the top of this report) would, in our book of technical setups, be enough to validate a long, targeting 113 as an initial take-profit zone.
Data points to consider: US Final GDP q/q figures, as well as the US weekly unemployment claims at 1.30pm GMT+1.
Levels to watch/live orders:
- Buys: Watch for H4 price to engulf 112.50 and then look to trade any retest seen thereafter ([waiting for a lower-timeframe buy signal to form following the retest is advised] stop loss: dependent on where one confirms this level).
- Sells: Flat (stop loss: N/A).
USD/CAD
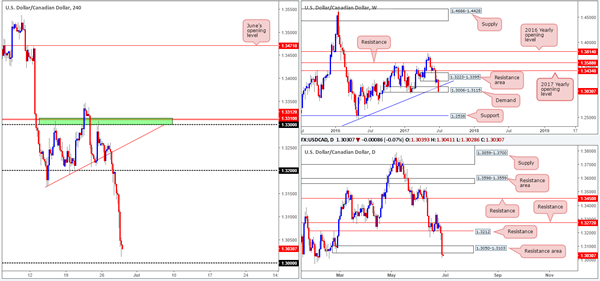
For those who read Wednesday’s report you may recall our desk mentioning that a short position was taken from 1.3171, with a stop positioned at 1.3205. As you can see, the trade worked out beautifully and exceeded our expectations, given we took profit around the top edge of the weekly demand at 1.3115. Our reasoning behind this call was due to the space seen for price to move lower on the bigger picture, and also the fact that H4 price retested the underside of 1.32 and printed a reasonably sized full-bodied bearish candle.
Going forward, the pair is now seen within shouting distance of a large psychological band at 1.30. This level has held price higher on several occasions, with the most recent being seen in late January. While we agree that this level does hold promise, the bigger picture shows a nearby resistance area at 1.3050-1.3103.
Also of particular interest is that 1.30 is positioned just beneath weekly demand at 1.3006-1.3115. Therefore, stops from below this weekly zone could provide enough liquidity for the big boys to buy from 1.30 today.
Our suggestions: Personally, we really like 1.30 as a potential buy zone, if not only for the fact that it has held so beautifully in the past. However, that does not mean we would consider placing a pending buy order here! Waiting for the H4 candles to react and show buyer intent is, we believe, the safer route to take before pulling the trigger.
Data points to consider: US Final GDP q/q figures, as well as the US weekly unemployment claims at 1.30pm GMT+1.
Levels to watch/live orders:
- Buys: 1.30 region ([waiting for a reasonably sized H4 bull candle to form – preferably a full-bodied candle – following the retest is advised] stop loss: ideally beyond the candle’s tail).
- Sells: Flat (Stop loss: N/A).
USD/CHF
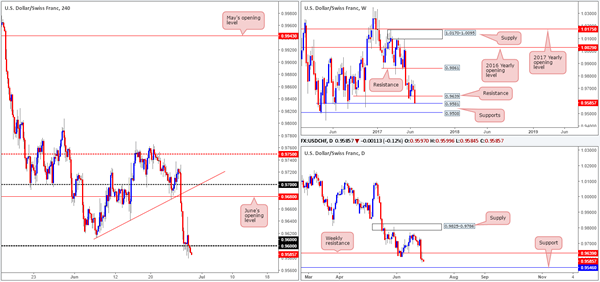
The picture being painted on the USD/CHF is an interesting one. Weekly price is, as we write, challenging the support level pegged at 0.9581. Down on the daily timeframe, we can see that yesterday’s candle retested the underside of a weekly resistance at 0.9639 and formed a rather conspicuous selling wick. The next downside target on this scale does not come into view until we reach 0.9546.
Swinging over to the H4 timeframe, the bulls are struggling to register any noteworthy movement around the 0.96 handle. Just as a reminder, below this number there is the weekly support level at 0.9581 and 35 pips below that is daily support at 0.9546.
Our suggestions: With stop-loss orders below 0.96 currently being filled, along with breakout sellers’ orders (this will likely provide liquidity for the big boys to buy); we believe a long trade from between 0.9546/0.9581 is high probability today. To be on the safe side though, we would only consider a buy from here in the event that a H4 bullish rotation candle takes shape in the form of a full or near-full-bodied candle. This will, for us, confirm buyer intent.
Data points to consider: US Final GDP q/q figures, as well as the US weekly unemployment claims at 1.30pm GMT+1
Levels to watch/live orders:
- Buys: 0.9546/0.9581 ([waiting for a reasonably sized H4 bull candle to form – preferably a full-bodied candle – following the retest is advised] stop loss: ideally beyond the candle’s tail).
- Sells: Flat (stop loss: N/A).
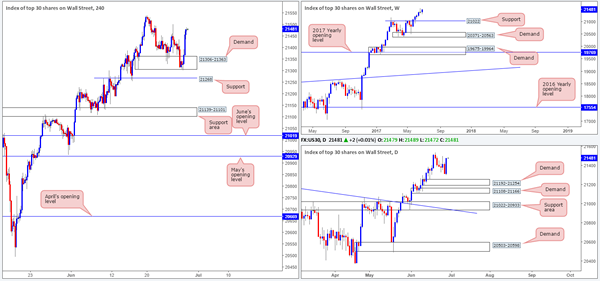
DOW 30
Unexpectedly, the H4 demand base coming in at 21306-21363 has held ground and rallied price, consequently painting a nice-looking daily bullish engulfing candle. For those who follow our analysis on a regular basis, you may recall that our desk is currently long from 21164. 50% of that position was quickly liquidated at 21234, with the remaining 50% left in the market to run since we intend on trailing this trend long term. The trailing stop was (and still is) positioned just beneath the said H4 demand zone at 21298, and thankfully was not triggered during yesterday’s trading.
Our suggestions: At the time of writing, there is not much else to hang our hat on. Of course, we would like to see the index continue advancing north and eventually register a fresh record high. From that point, we then have the freedom to move the trailing stop into further profits.
Data points to consider: US Final GDP q/q figures, as well as the US weekly unemployment claims at 1.30pm GMT+1.
Levels to watch/live orders:
- Buys: 21164 ([live] stop loss: 21298).
- Sells: Flat (stop loss: N/A).
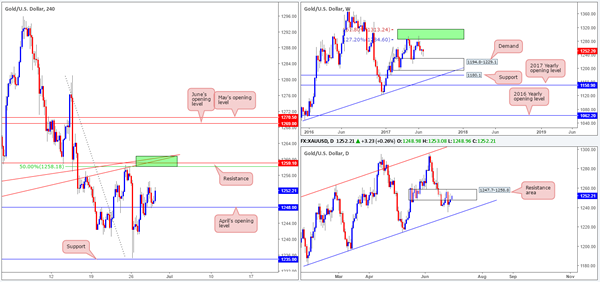
GOLD
The H4 candles, as you can see, remain afloat above April’s opening level at 1248.0. As mentioned in Wednesday’s report, continual buying from here could see price connect with the green H4 area which we deem to be a sell zone. The reasons as to why are as follows:
H4 resistance at 1259.1.
Two H4 trendline resistances taken from lows of 1245.9/1252.9.
H4 50.0% retracement value at 1258.1 taken from the high 1281.1.
Located within the upper limits of a daily resistance area at 1247.7-1258.8.
Our suggestions: We believe that H4 price will likely test the above noted green H4 sell zone today. However, with little weekly connection seen around this area, there’s a chance that a fakeout could take shape. For that reason, we will only consider a sell from here valid if, and only if, a H4 bearish candle forms, preferably a full-bodied candle.
Levels to watch/live orders:
- Buys: Flat (stop loss: N/A).
- Sells: 1259.1 region ([waiting for a reasonably sized H4 bear candle – preferably a full-bodied candle – to form before pulling the trigger is advised] stop loss: ideally beyond the candle’s wick).
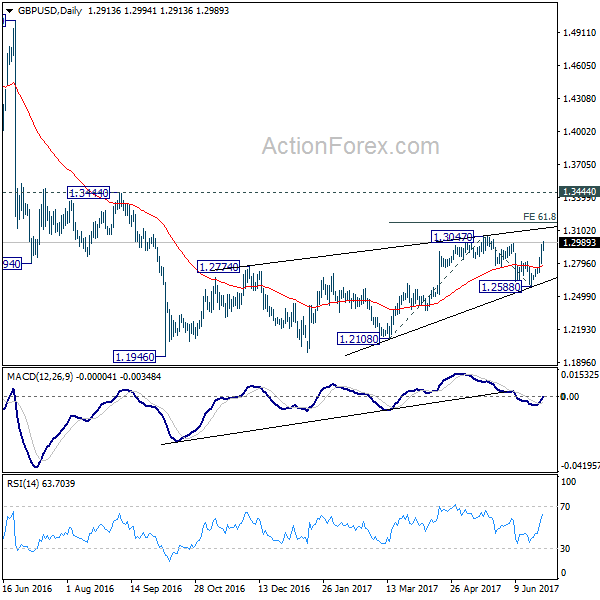
GBP/USD Daily Outlook
Daily Pivots: (S1) 1.2821; (P) 1.2896; (R1) 1.2998; More...
GBP/USD's rally continues to as high as 1.2994 so far and broke 1.2977 resistance. Intraday bias remains on the upside. Break of 1.3047 will target 61.8% projection of 1.2108 to 1.3047 from 1.2588 at 1.3168. On the downside, below 1.2913 minor support will turn bias neutral and bring retreat, before staging rally resumption.
In the bigger picture, overall, price actions from 1.1946 medium term low are seen as a corrective pattern. Pull back from 1.3047 has completed after failing to sustain below 1.2614 resistance turned support. It argues that the corrective pattern from 1.1946 is still in progress for another high above 1.3047. But still, outlook remains bearish as long as 1.3444 key resistance holds. Larger down trend from 1.7190 is expected to resume later after the correction completes.
European Open Briefing: The US Dollar Weakened
Global Markets:
- Asian stock markets: Nikkei up 0.55 %, Shanghai Composite gained 0.20 %, Hang Seng rose 0.75 %, ASX 200 rallied 0.80 %
- Commodities: Gold at $1253 (+0.30 %), Silver at $16.83 (+0.60 %), WTI Oil at $44.95 (+0.50 %), Brent Oil at $47.70 (+0.35 %)
- Rates: US 10-year yield at 2.23, UK 10-year yield at 1.16, German 10-year yield at 0.37
News & Data
- Japan Retail Sales 2.0 % vs 2.6 % expected
- Australia HIA New Home Sales 1.1 % vs 0.8 % previous
- New Zealand ANZ Business Confidence 24.8 vs 14.9 previous
- New Zealand NBNZ Activity 42.8 % vs 38.3 % previous
- Dollar upended by rates reversal, stocks unfazed for now
Markets Update:
The US Dollar weakened across the board following hawkish comments from ECB President Draghi, Bank of England Governor Carney and Bank of Canada Governor Poloz. All of them were speaking at a panel organized by the ECB.
Draghi showed some caution, but noted that deflationary forces had been replaced by reflationary ones. EUR/USD declined sharply after ECB sources said that Draghi has been misinterpreted. However, the pair quickly recovered those losses and eventually broke above 1.14. In the short-term, EUR/USD looks a tad overbought, but the outlook remains positive.
BoE Governor Carney surprised markets with his hawkish comments, especially since he said last week that he doesn’t see the central bank hiking rates in the near-term. GBP/USD rallied to almost 1.2980. Heavy resistance is seen ahead of 1.30. Should the pair break above that level, a test of 1.31 is likely.
The Bank of Canada has also started to signal that a change in monetary policy might occur soon. USD/CAD has already been under a lot of pressure in the past weeks, and the recent optimistic comments increased that even more. The pair reached 1.3020 in Asia, and test of 1.30 support seems almost certain. Sub-1.30, support lies at 1.2960 and then at 1.2820.
Today, the main events will be German inflation data and US GDP numbers.
Upcoming Events:
- 10:00 BST – Euro Zone Consumer Confidence
- 13:00 BST – German CPI
- 13:30 BST – US GDP
- 13:30 BST – US Initial Jobless Claims
- 23:45 BST – New Zealand Building Consents
USD/CHF Daily Outlook
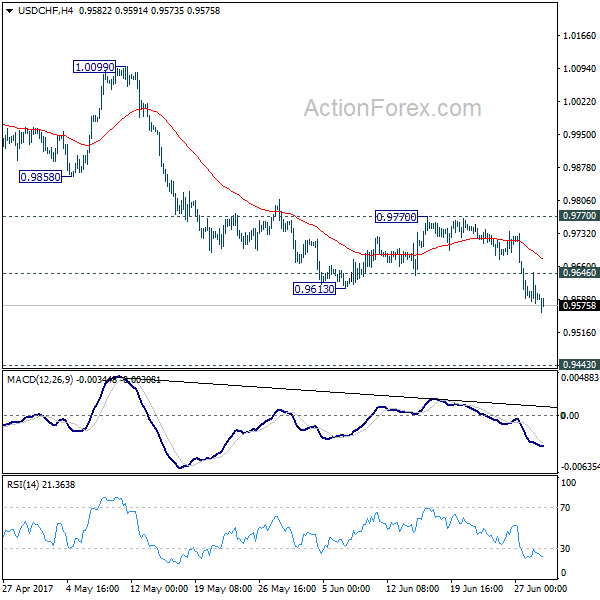
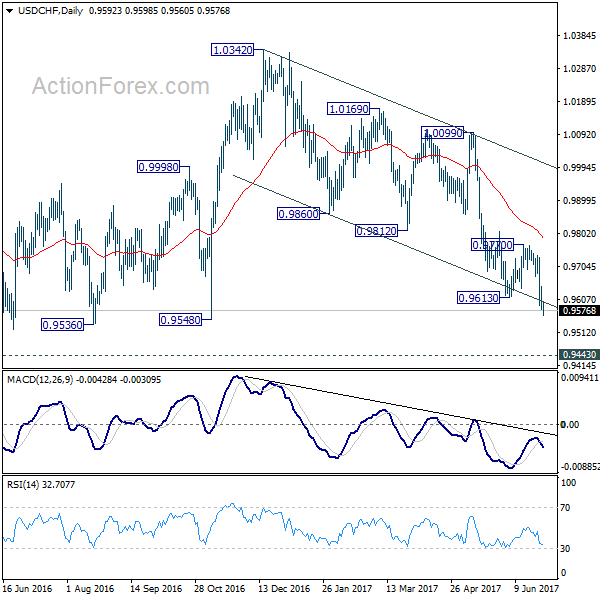
Daily Pivots: (S1) 0.9568; (P) 0.9607; (R1) 0.9637; More.....
USD/CHF's decline continues today and reaches as low as 0.9560 so far. Intraday bias stays on the downside and fall from 1.0342 would target 0.9548 support and below. We'd start to look for bottoming signal again as it approaches 0.9443 key support level. On the upside, above 0.9646 minor resistance will turn bias neutral and bring recovery. But still, break of 0.9770 resistance is ended to indicate short term bottoming. Otherwise, outlook will remain bearish.
In the bigger picture, USD/CHF is still bounded in medium term range of 0.9443/1.0342 for the moment. Consolidative trading would likely continue and medium term outlook remains neutral. Break of 1.0342 key resistance is needed to confirm underlying bullish momentum in the pair. Meanwhile, downside attempts should be contained by 0.9443 key support level. However, sustained break of 0.9443 will carry larger bearish implication and target 0.9 handle.
US Oil Inventory Report Showed A 118kb Increase In US Crude Stocks
Market movers today
Today, HICP inflation from Spain and Germany for June will be in focus. We look for Spanish inflation to have dropped to 1.4% y/y (consensus: 1.5% y/y) from 2.0% in May. In Germany, we are in line with consensus at 1.3% y/y from 1.4% in May. The drop in June inflation is estimated to have been driven by lower energy prices. Italian HICP inflation released yesterday further suggests that food price inflation had a lower contribution in June and it gives downside risk to our estimates for today's releases.
In the euro area, business confidence data is due to be released by the EU Commission. It normally mirrors what we see in PMI and regional business surveys – so not much new information in this.
In the US, it is time for the weekly jobless claims. It has been hovering around 235-250,000 since March, pointing to a quit e robust labour market with few layoffs. The Fed's Bullard is due to speak tonight on monetary policy.
In the Scandies, focus will be on Swedish retail sales and household lending.
Overnight Japan will be releasing CPI and Chinese official PMI manufacturing for June is also due.
Selected market news
Bank of England Governor Mark Carney joined the ECB's Mario Draghi in talking about the necessity t o remove some stimulus at yesterday's Sintra conference. In addition to Draghi, who elaborated further on Tuesday's hawkish comment s, t he Bank of Japan's Governor Haruhiko Kuroda and t he Bank of Canada's Governor Stephen Poloz at tended the conference. The latter two did not provide any new information about monetary policy. Indeed, it is quite significant to see Carney now placing himself in the hawkish camp as he has until recently argued that an unchanged policy stance would be appropriate for now. Notably, the BoE Chief Economist Andrew Haldane last week said that he had changed his mind. In addition, we already had three dissenters favouring rate hikes at the latest BoE meeting. Clearly, the balance in favour of a hike on the MPC looks set to start tipping and is clearly challenging our call that BoE will stay unchanged during Brexit negotiations.
The growing consensus among major central banks about the need for tightening monetary policy has not deterred risk sent iment in financial markets. Stock markets are holding up across the US, European and Asian market and so are commodity prices. Hence, the main impact in sentiment has been in FX and fixed income markets, where short -term rates have risen, giving support to EUR and GBP – see more on next page.
The weekly US oil inventory report showed a 118kb increase in US crude stocks. The report also showed a decline in both implied crude demand and implied gasoline demand. Finally, there was another 1.4mb draw on the strategic petroleum reserves last week. The combination of weak implied demand and the additional oil flowing to the market from the strategic reserves will continue to keep a lid over oil prices in the short term, in our view.
USD/JPY Daily Outlook
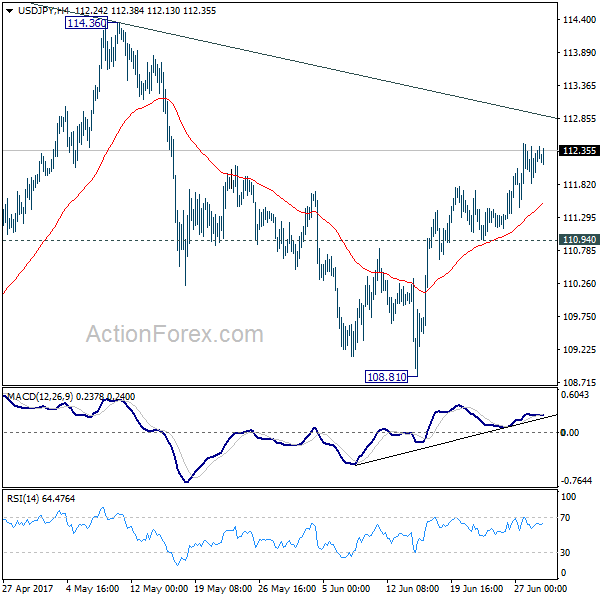
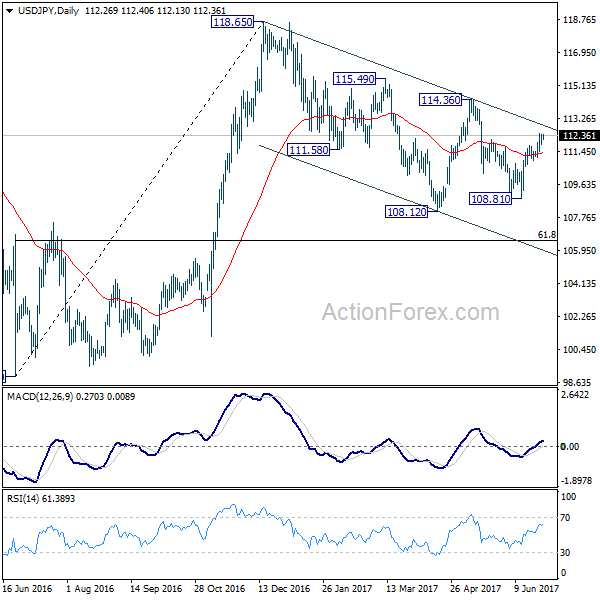
Daily Pivots: (S1) 111.96; (P) 112.18; (R1) 112.55; More...
Intraday bias in USD/JPY remains on the upside as rise from 108.81 is in progress for channel resistance (now at 112.89). Sustained break there will suggest that whole pull back from 118.65 has completed at 108.12 already. In such case, further rise should be seen to 114.36 resistance for confirmation. On the downside, however, break of 110.94 support will argue that rebound from 108.81 has completed and turn bias back to the downside.
In the bigger picture, price actions from 125.85 high are seen as a corrective pattern. It's uncertain whether it's completed yet. But in case of another fall, downside should be contained by 61.8% retracement of 75.56 to 125.85 at 94.77 to bring rebound. Overall, rise from 75.56 is still expected to resume later after the correction from 125.85 completes.
Trade Idea : USD/JPY – Buy at 111.90
USD/JPY - 112.14
Most recent candlesticks pattern : N/A
Trend : Near term up
Tenkan-Sen level : 112.30
Kijun-Sen level : 112.13
Ichimoku cloud top : 112.08
Ichimoku cloud bottom : 111.87
Original strategy :
Buy at 111.70, Target: 112.70, Stop: 111.35
Position : -
Target : -
Stop : -
New strategy :
Buy at 111.90, Target: 112.90, Stop: 111.55
Position : -
Target : -
Stop : -
The greenback has continued trading with a firm undertone after this week’s rally on active cross-selling in yen, adding credence to our bullishness and signal the rise from 108.82 low is still in progress, hence further gain to 112.75–80 (61.8% projection of 108.82-111.79 measuring from 110.95) would be seen, however, loss of momentum should limit upside and price should falter below 113.00-10 today, risk from there is seen for a retreat later.
In view of this, would not chase this rise here and we are looking to buy dollar on pullback as 111.83 support should limit downside. Below minor support at 111.46 would defer and suggest top is possibly formed, risk weakness to 111.10-15, break there would confirm, then test of support at 110.95 would follow.

Australia’s New Home Sales Advanced In May
For the 24 hours to 23:00 GMT, the AUD rose 0.65% against the USD and closed at 0.7637.
LME Copper prices rose 0.6% or $33.0/MT to $5822.0/MT. Aluminium prices rose 1.3% or $24.5/MT to $1886.0/MT.
In the Asian session, at GMT0300, the pair is trading at 0.7655, with the AUD trading 0.24% higher against the USD from yesterday's close, following upbeat new home sales data in Australia.
Earlier today, data showed that Australia's new home sales rose 1.1% MoM in May, following a gain of 0.8% in the previous month.
The pair is expected to find support at 0.7600, and a fall through could take it to the next support level of 0.7544. The pair is expected to find its first resistance at 0.7688, and a rise through could take it to the next resistance level of 0.7720.
Looking ahead, Australia's private sector credit data for May, set to release in the early hours of tomorrow, will be on investors' radar.
The currency pair is trading above its 20 Hr and 50 Hr moving averages.

Euro Trading Higher, Ahead Of Germany’s Crucial Inflation Data
For the 24 hours to 23:00 GMT, the EUR rose 0.33% against the USD and closed at 1.1378.
On the economic front, Italy's flash consumer price index (CPI) unexpectedly dropped 0.1% on a monthly basis in June, defying market consensus for a gain of 0.1%. In the preceding month, the CPI had declined 0.2%.
Macroeconomic data showed that advance goods trade deficit in the US narrowed slightly more-than-expected to a level of $65.9 billion in May, following a revised deficit of $67.1 billion in the previous month, while markets anticipated the nation to record a deficit of $66.0 billion. Further, the nation's seasonally adjusted flash wholesale inventories rebounded more-than-expected by 0.3% in May, compared to a revised fall of 0.4% in the previous month.
On the contrary, pending home sales in the US unexpectedly declined 0.8% on a monthly basis in May, falling for the third consecutive month and confounding market expectations for a rise of 1.0%. Pending home sales had fallen by a revised 1.7% in the previous month. Also, the nation's MBA mortgage applications dropped by the most in six months, as it eased 6.2% in the week ended 23 June, following a rise of 0.6% in the previous week.
In the Asian session, at GMT0300, the pair is trading at 1.1403, with the EUR trading 0.22% higher against the USD from yesterday's close.
The pair is expected to find support at 1.1324, and a fall through could take it to the next support level of 1.1244. The pair is expected to find its first resistance at 1.1451, and a rise through could take it to the next resistance level of 1.1498.
Trading trend in the Euro today is expected to be determined by Germany's flash inflation figures and the final Euro-zone's consumer confidence, both for June, slated to release in a few hours. Moreover, the US annualised 1Q GDP and initial jobless claims data, will pique investor attention.
The currency pair is trading above its 20 Hr and 50 Hr moving averages.
