Sample Category Title
Some Removal Of Monetary Stimulus Is Likely To Become Necessary: BoE Governor
For the 24 hours to 23:00 GMT, the GBP rose 0.93% against the USD and closed at 1.2938, following hawkish comments from the Bank of England (BoE) Governor, Mark Carney, that indicated support for a rate hike if UK’s economy stays firm.
The BoE Governor stated that higher interest rates will be “necessary” if wages pick up, and business investment strengthens.
On the data front, Britain’s seasonally adjusted house prices rebounded more-than-expected by 1.1% on a monthly basis in June, compared to a drop of 0.2% in the prior month. Meanwhile, market participants anticipated for a gain of 0.1%.
In the Asian session, at GMT0300, the pair is trading at 1.2958, with the GBP trading 0.15% higher against the USD from yesterday’s close.
The pair is expected to find support at 1.2843, and a fall through could take it to the next support level of 1.2728. The pair is expected to find its first resistance at 1.3024, and a rise through could take it to the next resistance level of 1.3090.
Moving ahead, investors will await UK’s net consumer credit and mortgage approvals data, both for May, slated to release in a few hours.
The currency pair is trading above its 20 Hr and 50 Hr moving averages.

Japan’s Retail Trade Sharply Declined In May
For the 24 hours to 23:00 GMT, the USD rose 0.13% against the JPY and closed at 112.36.
On the macro front, Japan's small business confidence index rose to a level of 49.2 in June, at par with market expectations. The index had recorded a reading of 48.9 in the previous month.
In the Asian session, at GMT0300, the pair is trading at 112.27, with the USD trading 0.08% lower against the JPY from yesterday's close.
Overnight data indicated that Japan's seasonally adjusted retail trade dropped 1.6% on a monthly basis in May, surpassing market expectations for a fall of 1.0%. In the prior month, retail trade had registered a rise of 1.4%. Moreover, the nation's large retailers' sales fell 0.6% in May, compared to a rise of 1.1% in the previous month, while investors had envisaged a drop of 0.5%.
The pair is expected to find support at 111.92, and a fall through could take it to the next support level of 111.58. The pair is expected to find its first resistance at 112.52, and a rise through could take it to the next resistance level of 112.78.
Going ahead, market participants will keep a close watch on Japan's jobless rate, national consumer price index and flash industrial production data, all for May, scheduled to release overnight.
The currency pair is showing convergence with its 20 Hr moving average and trading above its 50 Hr moving average.

Swiss ZEW Expectations Index Dropped In June While UBS Consumption Indicator Advanced In May
For the 24 hours to 23:00 GMT, the USD slightly declined against the CHF and closed at 0.9596.
In economic news, Switzerland’s ZEW economic expectations index dropped to a level of 20.7 in June, after recording a reading of 30.8 in the prior month. On the other hand, the nation’s UBS consumption indicator climbed to a level of 1.39 in May, following a revised reading of 1.34 in the preceding month.
In the Asian session, at GMT0300, the pair is trading at 0.9580, with the USD trading 0.17% lower against the CHF from yesterday’s close.
The pair is expected to find support at 0.9545, and a fall through could take it to the next support level of 0.951. The pair is expected to find its first resistance at 0.9631, and a rise through could take it to the next resistance level of 0.9682.
With no economic releases in Switzerland today, investors will look forward to global events for direction.
The currency pair is trading below its 20 Hr and 50 Hr moving averages.

BoC’s Stephen Poloz Signals Rate Hike In July
For the 24 hours to 23:00 GMT, the USD declined 1.03% against the CAD and closed at 1.3038.
The Canadian Dollar surged against the USD, after the Bank of Canada (BoC) Governor, Stephen Poloz, boosted speculation that an interest rate hike could come as early as next month. The BoC Governor stated that high unemployment and under-utilisation of resources in the Canadian economy is used up and that the central bank will take this into account when it issues a rate decision next month.
In the Asian session, at GMT0300, the pair is trading at 1.3035, with the USD trading marginally lower against the CAD from yesterday's close.
The pair is expected to find support at 1.2979, and a fall through could take it to the next support level of 1.2924. The pair is expected to find its first resistance at 1.3124, and a rise through could take it to the next resistance level of 1.3214.
The currency pair is trading below its 20 Hr and 50 Hr moving averages..

The Loonie’s Long-Term Uptrend Is Now In Jeopardy
Key Points:
- An Elliot wave is becoming apparent in the wake of the recent rout.
- The breaking of the long-term trend line signals further losses are now likely.
- A near-term recovery is still expected
The USDCAD has been in free fall over the past few weeks in a move reminiscent of last year's remarkable downtrend. Indeed, selling pressure has now broken through even the long-term trend line that formed as the pair sought to recover from last year's collapse – a sign that downsides may have only just begun. However, before making a beeline for what could be a 10 month low, we may see a bit of buying pressure as a result of the overarching chart pattern.
Specifically, it is fast becoming clear that we may have an Elliot wave on our hands and that the most recent plunge lower represents the end of leg number 3. As a result, we would typically expect buying pressure to return shortly and a modest recovery to be seen. In this instance, such a move is made all the more likely by the sheer degree to which the pair has become oversold – as signalled by both the RSI and Stochastic oscillators – and the presence of a well-tested historical support level at 1.3011.
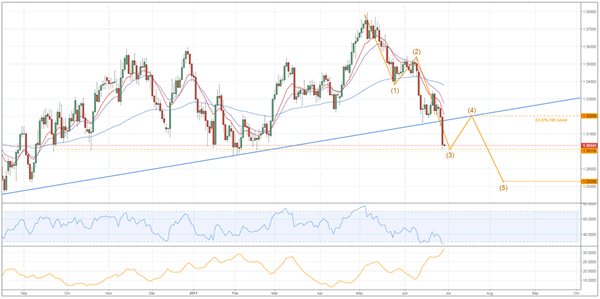
Nevertheless, this near-term bullish phase is likely to be short-lived and terminate at around the 1.3203 handle as the long-term bias remains highly bearish. More precisely, we forecast that the pair will move towards, and then rebound from, the old ascending trend line – due in no small part to numerous bearish technical indicators. In particular, the EMA bias and the Parabolic SAR readings are likely to be bearish even after the recovery. Moreover, the ADX will still be in strong trend territory if the upswing occurs in the forecasted time which could see added headwinds for the pair.
As for where we can expect the USDCAD to plunge to, the 1.2828 mark looks like our next notable level of historic support. Indeed, this price has seen a number of reversals occur when it has been challenged – both immediately prior to, and in the wake of, last year's massive upswing and subsequent downtrend. Furthermore, losses past this point will undermine the validity of the overall Elliot wave as it would make leg 5 longer than leg 3 which is typically a no-go.
Ultimately, we can't ignore the impact of the fundamental side of things but, luckily, the fundamental bias is somewhat in favour of further downsides. This is largely due to the prevailing view that the USD's ‘Trump Bump' is all but doomed, a view that has been driven home this week by further failures in the GOP's attempts at reforming healthcare. Nonetheless, watch out for any upsets that may come down the line – especially US rate hikes which could result in some volatility during the final leg of the Elliot wave
Is Crude Oil About To Mount A Reversal…In The Short Term?
Key Points:
- Short term technical time frame may be turning bullish.
- Fundamental over supply remains and is likely to impact medium term view.
- Watch for a short term break towards the $47.00 - $48.00 handle.
The past few weeks have proved relatively negative for crude oil as the commodity has continued to sink lower in the face of surprise inventory builds and ongoing concern about the current direction of prices. Subsequently, you might be forgiven for being tempted to take a short term bearish view on the commodity but we might just be setting up to see a sharply bullish move in the coming weeks.
Historically, crude oil prices are currently plumbing the depths of decline with WTI down around 12% so far for the month of June. In fact, we are literally looking at the longest string of declines since around 2015. However, there are some significant technical factors which now suggest that we could be about to see some significant upside moves in the coming weeks.
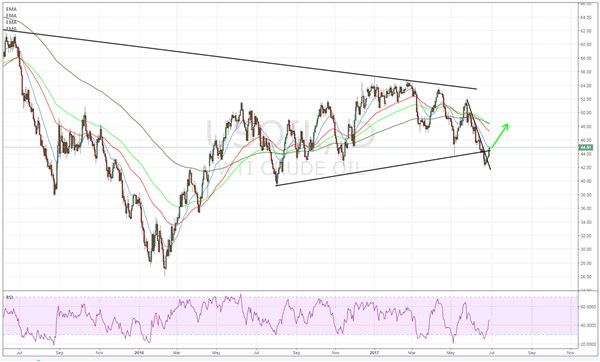
From the fundamental perspective, we are about to head into hurricane season in the Gulf of Mexico. Subsequently, the risk of rig disruption, due to incoming storms, is a relatively real prospect and this would impact production in the Gulf region. The typical storm season is normally between August- November but the first major hurricane of the year has already made landfall and impacted production.
In addition, the question of OPEC’s effectiveness remains a key concern within the global oil markets and there is some question as to the cartels ability to further restrict enough supply to impact prices by any measurable amount without damaging their respective member’s economies. This is an especially valid question given that U.S. shale oil producers continue to advance production whilst lowering their respective costs. Subsequently, it remains uncertain if OPEC can have much in the way of an impact on U.S. crude inventories.
However, the latest suggestion is that Saudi Arabia could indeed change the flow of exports away from the U.S. and artificially impact inventory figures. Unfortunately, this ignores the basic premise of the economics of Shale oil. Any measurable rally back towards the $50.00 handle is only going to bring with it increased domestic rig counts and additional production. Any such strategy would simply release further market share to the shale sector.
From the technical perspective, bullish pressure is starting to mount as price action appears to have failed on any meaningful decline below the rising trend line. In addition, the RSI Oscillator is now rising sharply away from oversold territory and price action is now rising, albeit on a short term basis. Subsequently, from the technical perspective, there are plenty of reasons to expect a big move higher in crude oil prices in the coming week.
Ultimately, the technical indicators are likely to win out in the short term and we are, subsequently, likely to see some resurgence in oil prices back towards the $48.00 handle. However, our bias changes over the medium term given the various fundamentals that are at play. In particular, the ongoing over supply issues are likely not going away any time soon so expect there to be plenty of further pain before rebalancing within the market is finally complete.
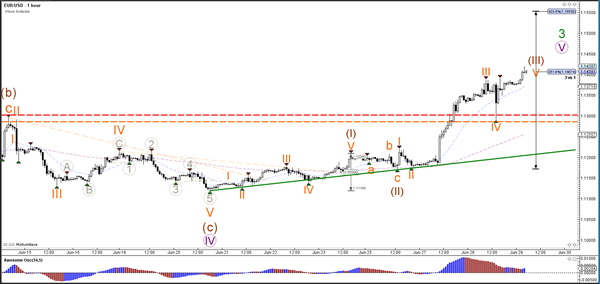
Daily Technical Analysis: EUR/USD Break, Pullback And Continuation Pattern Will Soon Test 1.15 Resistance
Currency pair EUR/USD
The EUR/USD used the key resistance at 1.13 (dotted lines) again but this time as a support level (blue box). As mentioned yesterday, the bullish continuation does not come as a surprise considering the potential wave 3s. Price is now above 1.14 and could be testing the 1.15 resistance soon which is the 200% Fibonacci level of wave 3
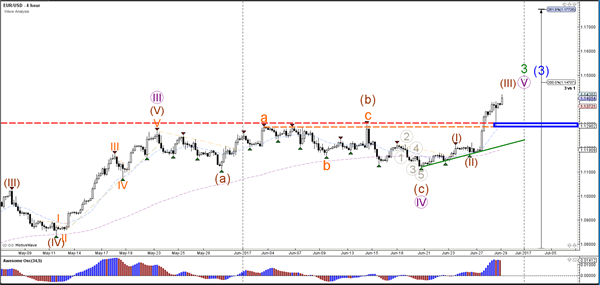
The EUR/USD indeed completed a light retracement for a wave 4 (orange) of a larger wave 3 (brown). Price is now moving towards the Fib targets of wave 3 vs 1.
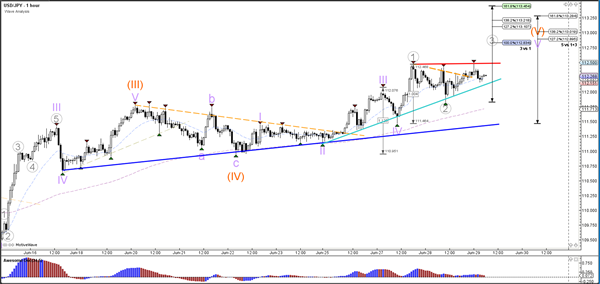
Currency pair USD/JPY
The USD/JPY is moving higher within a wave 5 (orange) of wave C (brown). A break above the top of the channel (red) could see price move towards the Fibonacci targets of wave C (brown).
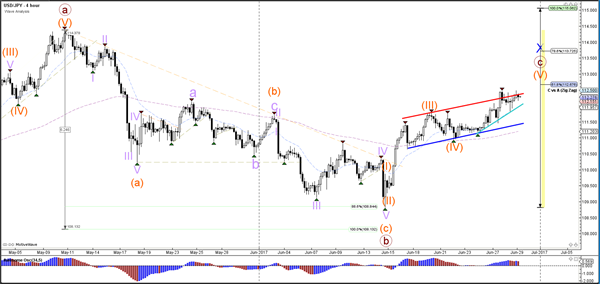
The USD/JPY needs to break above the resistance trend line (red) before a bullish continuation is likely within wave 3 (grey). A break below support could indicate that the waves 5 (orange/purple) are completed.
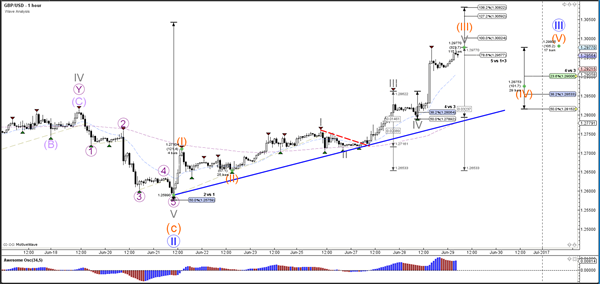
Currency pair GBP/USD
The GBP/USD bullish breakout above the resistance trend line (dotted red) makes a bullish wave structure more likely than a bearish variant. The wave count is therefore showing a wave 3 (orange), which could either extend above the 261.8% Fibonacci target or retrace for a wave 4.
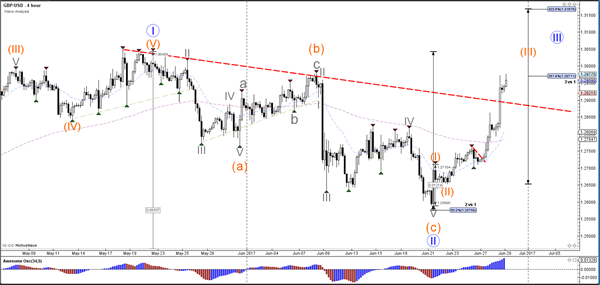
The GBP/USD will build a wave 4 and 5 (orange) once price completes the final wave 5 (grey) within wave 3 (orange).
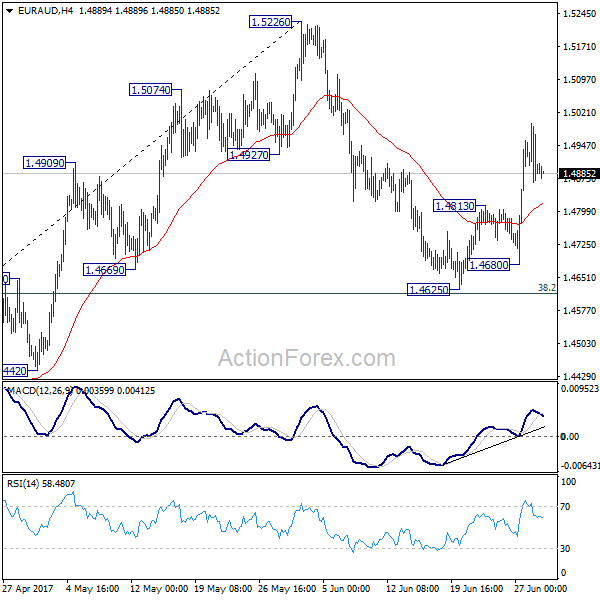
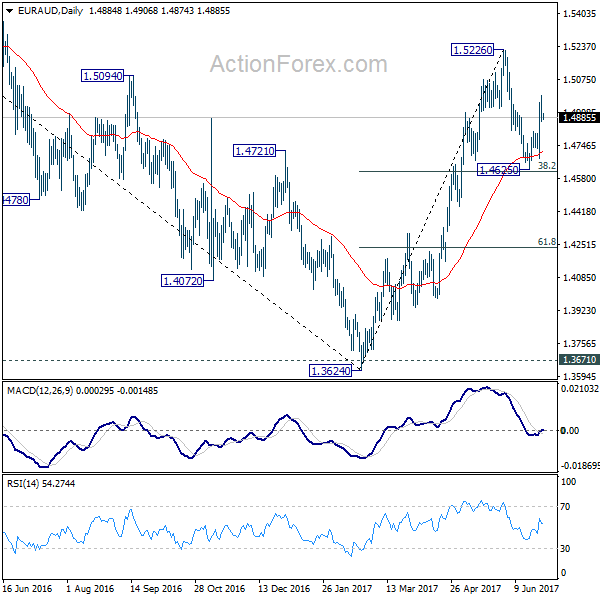
EUR/AUD Daily Outlook
Daily Pivots: (S1) 1.4839; (P) 1.4918; (R1) 1.4971; More...
EUR/AUD lost some upside momentum a after hitting 1.4997. But intraday bias stays on the upside with 1.4813 minor support intact. As noted before, pull back from 1.5226 should have completed at 1.4625, ahead of 38.2% retracement of 1.3624 to 1.5226 at 1.4614. Further rally should be seen to retest 1.5226 next. On the downside, though, below 1.4813 resistance turned support will turn bias to the downside for 1.4625 again.
In the bigger picture, price actions from 1.6587 medium term top are viewed as a corrective pattern. Such correction should be completed at 1.3624 after defending 1.3671 key support. Rise from 1.3642 would extend to 61.8% retracement of 1.6587 to 1.3624 at 1.5455. Sustained break there will pave the way to retest 1.6587. However, sustained break of 1.4669 support will dampen this bullish view. We'll assess the outlook later after looking at the structure and depth of the pull back.
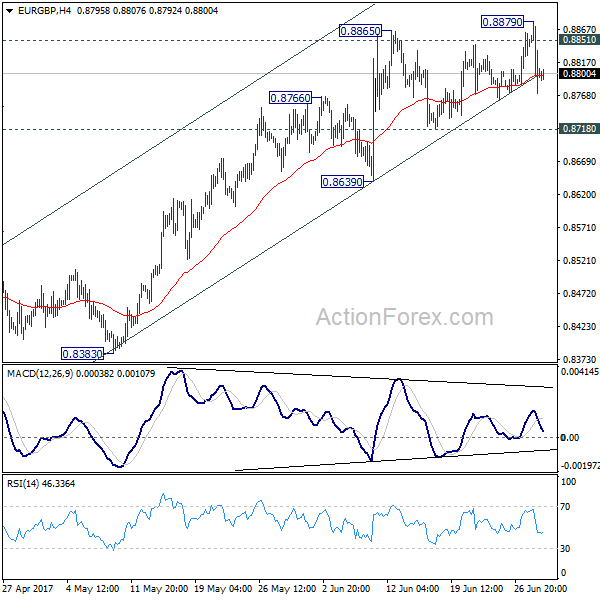
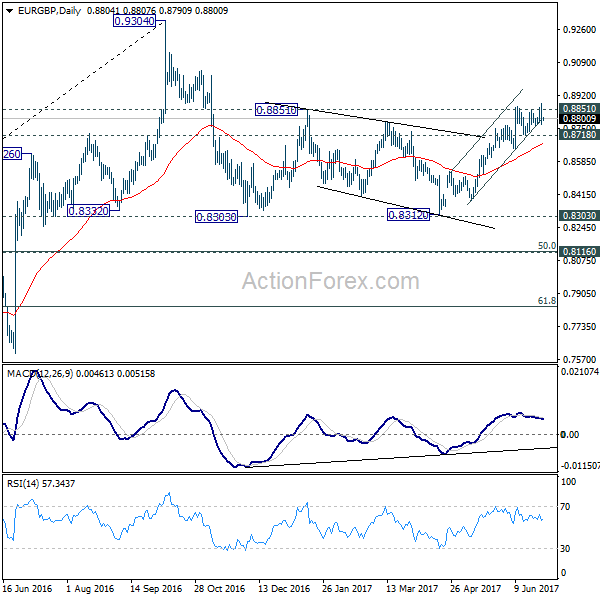
EUR/GBP Daily Outlook
Daily Pivots: (S1) 0.8754; (P) 0.8817; (R1) 0.8862; More...
Intraday bias in EUR/GBP remains neutral for the moment as it's failing to take out 0.8851 resistance decisively. Yet, there is no confirmation of reversal yet. On the upside, break of 0.8879 and sustained trading above 0.8851 will pave the way to retest 0.9304 high. However, break of 0.8718 support will now indicate near term reversal and turn bias back to the downside for 0.8639 support and below.
In the bigger picture, price actions from 0.9304 are viewed as a medium term corrective pattern. The leg from 0.9304 should have completed after testing 0.8332 structural support. But it's too early to say that larger rise from 0.6935 is resuming. Rejection from 0.9304 will extend the consolidation with another falling leg. Meanwhile, firm break of 0.9304 will target 0.9799 (2008 high). In case of another decline, we'd expect strong support from 0.8116 cluster support (50% retracement of 0.6935 to 0.9304 at 0.8120) to contain downside and bring rebound.
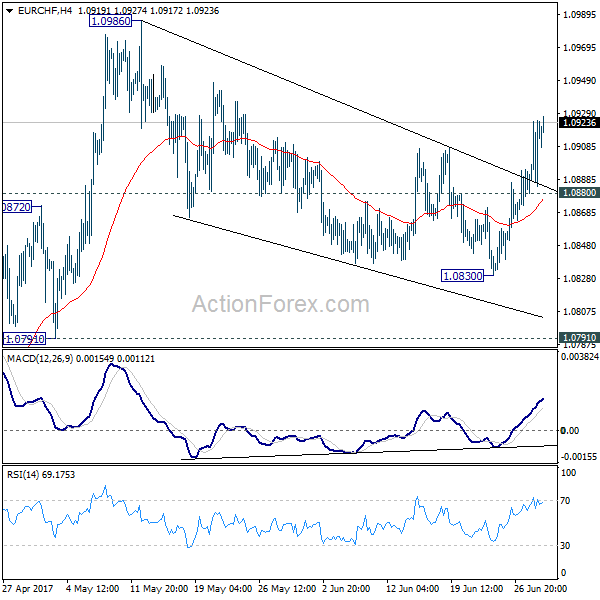
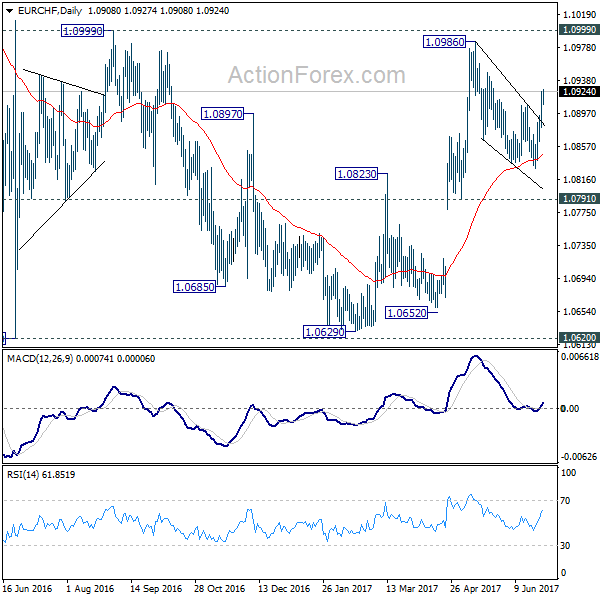
EUR/CHF Daily Outlook
Daily Pivots: (S1) 1.0890; (P) 1.0908; (R1) 1.0934; More...
EUR/CHF's rebound from 1.0830 extended. The break of 1.0908 resistance suggests that the corrective pull back from 1.0986 has finally completed at 1.0830. Intraday bias is back on the upside for retesting 1.0986/0999 resistance zone first. On the downside, below 1.0880 minor support will dampen the bullish view again and turn bias neutral. In case of another fall, we'd still expect downside to be contained by 1.0791/0872 support zone to bring rebound.
In the bigger picture, the price actions from 1.1198 are seen as a corrective move. Such correction could have completed after defending 38.2% retracement of 0.9771 to 1.1198 at 1.0653. Decisive break of 1.0999 resistance will target a test on 1.1198 high. For now, this will be the preferred case as long as 1.0791 support holds.