Sample Category Title
Trade Idea : USD/CHF – Sell at 0.9660
USD/CHF - 0.9595
Most recent candlesticks pattern : N/A
Trend : Near term down
Tenkan-Sen level : 0.9596
Kijun-Sen level : 0.9659
Ichimoku cloud top : 0.9718
Ichimoku cloud bottom : 0.9707
Original strategy :
Sell at 0.9680, Target: 0.9580, Stop: 0.9715
Position : -
Target : -
Stop : -
New strategy :
Sell at 0.9660, Target: 0.9550, Stop: 0.9695
Position : -
Target : -
Stop : -
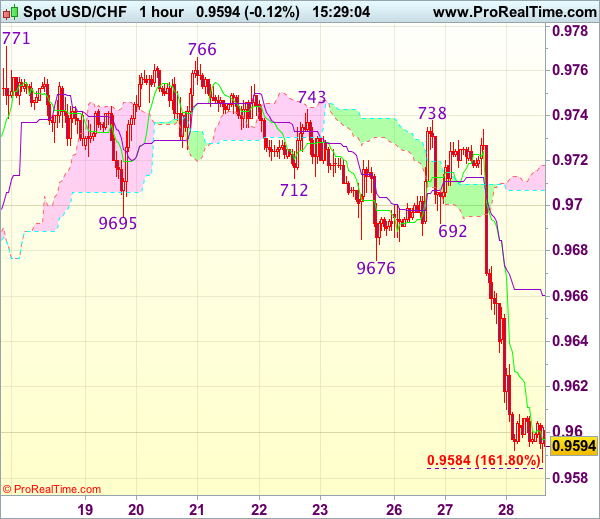
The greenback has remained under pressure after yesterday’s selloff below previous chart support at 0.9613, adding credence to our bearish view that the decline from 0.9771 top is still in progress and downside bias remains for further weakness towards 0.9550, however, reckon downside would be limited to 0.9525-30 (50% projection of 1.10100-0.9613 measuring from 0.9771) and 0.9500 should hold, price should stay above 0.9470 (61.8% projection), bring rebound later.
In view of this, would not chase this fall here and we are looking to sell dollar on recovery as previous support at 0.9676 should turn into resistance and limit dollar’s upside, bring another decline. Above another previous support at 0.9692 would defer and risk a stronger rebound to 0.9715-20 but only break of resistance at 0.9738-43 would signal low is formed.
Trade Idea : GBP/USD – Buy at 1.2780
GBP/USD - 1.2825
Most recent candlesticks pattern : N/A
Trend : Near term down
Tenkan-Sen level : 1.2811
Kijun-Sen level : 1.2790
Ichimoku cloud top : 1.2729
Ichimoku cloud bottom : 1.2728
Original strategy :
Buy at 1.2710, Target: 1.2810, Stop: 1.2675
Position : -
Target : -
Stop : -
New strategy :
Buy at 1.2780, Target: 1.2880, Stop: 1.2745
Position : -
Target : -
Stop : -
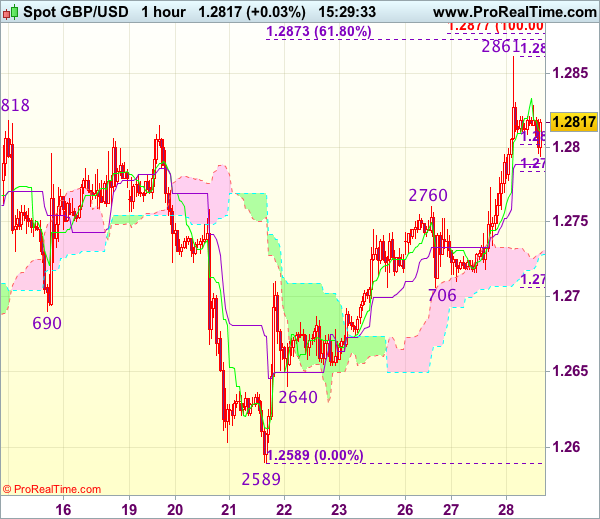
As cable has retreated after rising to 1.2861 in part due to cross-trading against euro, suggesting consolidation below this level would be seen and pullback to 1.2780-85 (50% Fibonacci retracement of 1.2706-1.2861) cannot be ruled out, however, reckon downside would be limited to 1.2760-65 (previous resistance and 61.8% Fibonacci retracement) and bring another rise later, above said resistance at 1.2861 would extend the erratic rise from 1.2589 low 1.2875-80 (100% projection of 1.2589-1.2760 measuring from 1.2706), then towards 1.2915-20 (1.236 times projection) but price should falter well below 1.2978-83 (previous resistance and 1.618 times projection).
In view of this, would not chase this move here and would be prudent to buy cable on pullback as 1.2780-85 should limit downside. Below previous resistance at 1.2760 would defer and signal top is formed instead, bring correction to 1.2730 but support at 1.2706 should hold from here.
EURGBP Bullish In The Short-And Medium-Term, Price Hits 7½-Month High
EURGBP has been in an uptrend over the last couple of months. Today's gain has led the pair to record a fresh seven-and-a-half-month high of 0.8879. In yesterday's trading the pair finished the day 0.7% higher.
Looking at the Ichimoku analysis, the positive alignment when the Tenkan-sen line (red) crossed above the Kijun-sen (blue) in mid-May, is still in place. Moreover, the Tenkan-sen is currently steeply upward sloping, indicating that the positive short-term momentum remains intact. Adding to this conviction is the RSI indicator, which is well into bullish territory at 65 and maintains a positive slope.
The 0.89 handle, a potential psychological level, could act as a barrier to up movements in price. Further up, the near eight-month high of 0.8937 (excluding the November 9 spike), might offer additional resistance.
On the downside, the current level of the Tenkan-sen, which currently coincides with another potential psychological point, namely the 0.88 mark, could provide support. Below this point, the focus would shift to the Kijun-sen at 0.8741 as another support level.
As regards the medium-term outlook, the pair was ranging sideways for a significant part of the year. However, the uptrend in recent weeks, combined with the fact that the price is currently comfortably above both the 50- and 200-day moving averages, are painting a bullish picture.
To sum up, the short-term outlook is bullish. The same holds for the medium-term.
Yellen & Draghi Speak: Markets Listen
Central Banks are the key drivers of the markets this week as traders focused on comments made from two major central bankers; ECB Chief Draghi and Fed Chair Yellen.
Draghi commented that 'he sees room for paring back stimulus' this optimistic comment weighed on government bonds whereas Yellen suggested 'that the US economy can withstand higher interest rates and that asset valuations were rich'. The markets are now looking for additional economic strategy indications from various influential policy makers that are attending a conference in Portugal that ends today.
Volatility in US equities rose the highest in six weeks as investors digested recent economic data and central bank verbiage. The IMF have suggested a less rosy outlook for the US economy dismissing the Trump administrations tax cut pledge and an increase in infrastructure spending. Additionally, traders concerns continue with Oil moving into a Bear Market, the continued sell off of Technology stocks and the cyber attack that originated in the Ukraine and spread to several Major cities late yesterday.
USD remained under pressure slipping 0.2%% against JPY to trade currently at 112.31 near the day's high of 112.394.
EURUSD was higher, up 0.2%, currently trading at 1.1362. This after reaching a 10-month high earlier in the trading session of 1.13711.
GBPUSD also benefitted from USD weakness trading up to 1.28274 overnight before retracing back to currently trade at 1.2810.
USDCAD rose by nearly 0.5% to currently trade at 1.3138 following comments made by Bank of Canada Governor Poloz that interest rate cuts 'have done their job and that levels are now extraordinarily low'.
WTI & Brent have both risen nearly 1% overnight to currently trade at $44.22pb and $46.90pb respectively.
Gold gained another 0.4% against USD for the second consecutive day to trade currently at $1252.
Traders will now be looking ahead to several Central Bankers speeches today – all scheduled for 16:30 BST: BoE Governor Carney, BoJ Governor Karuda, ECB President Draghi & BoC Governor Poloz. At 17:30 BST sees the release of the EIA Crude Oil Stocks Change which is always impactful on Oil prices.
Trade Idea : EUR/USD – Buy at 1.1280
EUR/USD - 1.1375
Most recent candlesticks pattern : N/A
Trend : Near term up
Tenkan-Sen level : 1.1358
Kijun-Sen level : 1.1281
Ichimoku cloud top : 1.1192
Ichimoku cloud bottom : 1.1189
Original strategy :
Buy at 1.1260, Target: 1.1360, Stop: 1.1225
Position : -
Target : -
Stop : -
New strategy :
Buy at 1.1280, Target: 1.1395, Stop: 1.1245
Position : -
Target : -
Stop : -
The single currency has continued moving higher after yesterday’s rally above previous resistance at 1.1296, confirming recent upmove has resumed and bullishness for further gain to 1.1400-05 (61.8% projection of 1.0839-1.1296 measuring from 1.1119), then towards 1.1430, however, near term overbought condition should prevent sharp move beyond 1.1450-60 and price should falter below 1.1500, risk from there is seen for a retreat later.
In view of this, would not chase this rise here and would be prudent to buy euro on pullback as 1.1280-85 should limit downside. Below 1.1245-50 would defer and risk test of previous resistance at 1.1220 but break there is needed to confirm top is formed instead, bring correction towards 1.1180-85 later.

Technical Outlook: EURUSD – Tuesday’s Long Bullish Candle Underpins For Extension Towards 1.1414/28 Targets
The Euro extended gains on Wednesday and hit fresh one year high at 1.1378, following previous day's strong rally which marked the biggest one-day rally in 2017.
The single currency received strong support from the ECB Chief Draghi's speech on Tuesday and accelerated through the target at 1.1300 zone, generating strong bullish signal on close well above broken 1.1300 barrier.
Bulls eye next targets at 1.1414/28 (highs of 09/24 June 2016), with 1.1614 (03 May 2016 peak) coming in short-term focus.
Meanwhile, bulls may take a breather on overbought studies. Initial supports lay at 1.1329 (session low) and 1.1300 zone (former strong barrier).
Ascending converged daily Tenkan-sen/Kijun-sen lines offer next strong support at 1.1245 zone, with 20SMA at 1.1218 expected to contain extended dips.
Res: 1.1378, 1.1400, 1.1414, 1.1428
Sup: 1.1329, 1.1300, 1.1245, 1.1218
Trade Idea : USD/JPY – Buy at 111.80
USD/JPY - 112.25
Most recent candlesticks pattern : N/A
Trend : Near term up
Tenkan-Sen level : 112.23
Kijun-Sen level : 111.97
Ichimoku cloud top : 111.80
Ichimoku cloud bottom : 111.61
Original strategy :
Buy at 111.60, Target: 112.60, Stop: 111.25
Position : -
Target : -
Stop : -
New strategy :
Buy at 111.80, Target: 112.80, Stop: 111.45
Position : -
Target : -
Stop : -
The greenback has maintained a firm undertone after this week’s rally on active cross-selling in yen, adding credence to our bullishness and signal the rise from 108.82 low is still in progress, hence further gain to 112.75–80 (61.8% projection of 108.82-111.79 measuring from 110.95) would be seen, however, loss of momentum should limit upside and price should falter below 113.00-10 today, risk from there is seen for a retreat later.
In view of this, would not chase this rise here and we are looking to buy dollar on pullback but at a higher level as 111.80 should limit downside. Below minor support at 111.46 would defer and suggest top is possibly formed, risk weakness to 111.10-15, break there would confirm, then test of support at 110.95 would follow.

Currencies: EUR/USD And EUR/GBP Testing Key Resistance Levels
Sunrise Market Commentary
- Rates: Draghi steps up to the plate
Markets will further digest ECB president Draghi's comments. Can “deflationary replaced by reflationary forces” become the new “whatever it takes”? We recommend a sell-on-upticks strategy in the Bund. On EMU bond markets, it could mark an end to the long-term narrowing trend. - Currencies: EUR/USD and EUR/GBP testing key resistance levels
A combination of hawkish comments from ECB's Draghi and negative (political) headlines from the US propelled EUR/USD for an extensive test of the 1.1300/66 resistance. A break would be significant from a technical point of view. Euro sentiment is strong, but an equity correction remains a wildcard for global FX trading. EUR/GBP is also testing the 2017 top
The Sunrise Headlines
- Wall Street was knocked hard in the wake of a delay to a US healthcare reform vote in Senate, the IMF's US growth forecast downgrade, a tech sell-off (Nasdaq -1.5%) and Fed Yellen's warning of “somewhat rich” asset valuations. Asian stock markets manage to limit losses overnight.
- Energy stocks rose as the broadly weaker tone of the dollar helped oil prices extend their recent rally from multi-month lows. Gold also benefited from a weaker dollar overnight, though still not recovered from the fat-finger sell off.
- The Chinese yuan surged for a second day amid speculation of central bank intervention. Meanwhile the euro rose on ECB Draghi's more hawkish tone with EUR/USD now around 1.135 and EUR/JPY just above 127. ECB's Constancio confirmed in an interview that Draghi's speech was in line with policy.
- A new cyberattack similar to WannaCry has reached Asia after spreading from Europe to the US overnight, hitting businesses, port operators and government systems.
- In a CNBC interview, Bank of Canada's Poloz said rate cuts have done their job and stated that excess capacity seems close to being used up. This shows that the BoC is coming closer to changing its monetary policy towards hiking.
- A trio of Fed officials, including Chair Yellen, pointed (although very cautiously) to the potential overvaluation of assets. This could mean that financial stability is gaining some interest in the monetary policy decision mix.
- The eco calendar is thin with only US pending home sales, EMU M3 money supply and a US 7-yr Note auction. Today is also the final day of the ECB forum in Sintra.
Currencies: EUR/USD And EUR/GBP Testing Key Resistance Levels
Draghi propels euro. Yellen fails to help the dollar
The stalemate in USD trading ended yesterday, as ECB's Draghi said the economic improvement could lead to a gradual ECB policy change. The euro jumped higher. Later on, the dollar was sold as the IMF downgraded its US growth forecast and the vote on the US health care bill was delayed. EUR/USD jumped north of 1.13. Fed's Yellen repeated her intention to continue a gradual rate hike path, but it couldn't help the dollar, at least not against the euro. EUR/USD closed the day at 1.1339. USD/JPY behaved differently. The rise in core yields and sharp gains in EUR/JPY pushed USD/JPY beyond the 112.13 resistance even as US equities came under pressure. The pair closed the session at 112.35.
This morning, Asian equities trade with modest losses as the sell-off in the tech sector in the US continues to weigh. At the same time, yields remain under upward pressure, while oil struggles to continue its recent rebound. EUR/USD is holding near the rally highs, currently trading in the 1.1347 area. USD/JPY tries to sustain north of 112, but the momentum eases as correction of tech equities tends to support the yen.
Today, the eco calendar is again thin. There are only second tier eco data in Europe, while in the US, the trade balance and inventory data won't affect USD trading. Investors will ponder the impact of yesterday's comments/events and will also keep a close eye at the final day of the ECB forum in Sintra, with comments from ECB's Draghi, BOJ's Kuroda and former Fed president Bernanke. It's is too early to firmly conclude that the global policy normalisation has started, but tentative signs of such process are multiplying. Even so, investors focus primarily on adapting positions to the ECB change of tone. The euro should remain well supported short-term. Will EUR/USD be able to take out the 1.1366 resistance? The FX reaction to a further equity correction is a less straightforward. For now, USD/JPY and EUR/JPY are supported by higher core yields, but this pattern probably won't continue in case of a more protracted equity correction. In this context we stay cautious on further USD/JPY gains, despite the recent good performance. The euro is currently favoured over the dollar. Short-term there is no reason to row against the euro positive tide. However, we are not convinced on the safe haven characteristics of the euro in case of a protracted global risk-off correction. We continue to keep a close eye at EUR/JPY. A reversal in this cross rate at some point might also cap the topside of EUR/USD.
Technical picture: USD still confined to tight ranges
Early May, EUR/USD failed to break below the 1.0821/1.0778 support (gap). Poor US data and US political upheaval propelled EUR/USD to a test of the 1.1300 area going into the FOMC decision, but the test was rejected. Yesterday, a combination of hawkish ECB comments and negative US headlines pushed EUR/USD for an intensive test of the 1.1300/66 resistance are. The test is ongoing. A sustained break would be significant from a technical point of view and could open the way to the 1.1616/1.1714 LT correction tops A return below 1.12 (STMA) would be a first indication that the euro rally is easing. A drop below 1.1119 would call off the downward alert.
The USD/JPY rally ran into resistance in early May and the pair returned lower in the 108.13/114.37 range. The post-Fed USD rebound pushed the pair beyond a first minor resistance at 110.81. The pair yesterday regained the 112.13 correction top, but the test is ongoing . A break would improve the ST-picture. Even so, were remain cautious on further USD/JPY gains as equity volatility tends to rise
EUR/USD: 1.1300/66 resistance under heavy strain on Draghi comments and negative US headlines
EUR/GBP
EUR/GBP retests 2017 top
Yesterday, the Draghi comments sent EUR/GBP-well north of 0.88, but there were also modest positive spill-over effects on cable. In the financial stability report, the BOE warned on easing credit standards for consumer credit. The bank increased the cyclical capital buffer from June 2018. The measures is a kind of monetary tightening and might make a rate hike (slightly) less probable. Especially EUR/GBP remained well bid after the financial stability report and closed the session at 0.8863. Cable profited from a soft dollar and closed the day at 1.2814.
This morning, the only release of the day, Nationwide UK House prices rose more than expected, but without market impact. So, sterling trading will be driven by global factors (euro strength) and by political/Brexit headlines. The news flow on UK politics remains diffuse, at best and the euro is in good shape. So, there is no reason to row against the EUR/GBP uptrend. A negative risk sentiment, if it would continue, is also more negative for sterling than for the euro.
From a technical point of view, EUR/GBP is again testing the 0.8854/66 area (2017 top). The BoE debate on a rate hike caused some volatility recently, but wasn't able to support sustained sterling gains against the euro. A break of the 2017 top would open the way to the 0.90 area. A return below the 0.8655 correction low would indicate easing pressure on sterling. Such a break lower will be difficult. A EUR/GBP buy-on-dips approach remains favoured
EUR/GBP: testing key resistance at 0.8854/66
Draghi’s Hawkish Tapering Speech Sends The Euro Higher
ECB President Mario Draghi was speaking in Portugal yesterday where he signaled that from September, the ECB would cut back its bond purchases from the current 60 billion euro to 40 billion euro a month. The talk of tapering sent the euro surging higher on the day, breaking past 1.1300 as a result.
Draghi also signaled that the central bank could adjust its monetary policy tools, currently at sub-zero rates. With the markets putting pressure on the ECB and expecting the hawkish talk, the euro rallied strongly.
Elsewhere, the economic calendar included a late evening speech from Janet Yellen at the British Academy in London. She did not go into much details about the Fed's monetary policy, but Ms. Yellen signaled that major banks were in a much stronger position than before. She also said that it was unlikely for the financial crisis to occur.
Looking ahead, the economic data includes continued speeches from major central bank officials. Thisincludes, ECB's Mario Draghi, BoC President Poloz, Mark Carney and BoJ President Kuroda
EURUSD intraday analysis
EURUSD (1.1350): With the EURUSD posting strong gains and rising above 1.1300, the price action looks bullish from here. Further gains could be seen coming with any pullbacks limited to 1.1300. However, in terms of the fundamentals, there is scope for the common currency to give up its gains especially with this Friday's flash inflation estimates. Therefore, the current gains in EURUSD could be seen as a rally led by market expectations. With a good two months to go, there is scope for the ECB to readjust its forward guidance as well. In the near term, EURUSD remains poised to the upside with initial support seen at 1.1300.
GBPUSD intraday analysis
GBPUSD (1.2826): The British pound extended the gains back to 1.2800 yesterday and slightly closing above this resistance level. Any pullback off this resistance level could see GBPUSD post some declines back to 1.2660 region, where the right shoulder of the inverse head and shoulders pattern could be formed. This would suggest further upside in price. GBPUSD has scope for afurther rally towards 1.3200 at the minimum. The falling median line also shows that price action will need to post a higher low ahead of further gains.
USDJPY intraday analysis
USDJPY (112.10): USDJPY also closed higher on the day surprisingly, despite the weakness in the US dollar. With price lingering near the resistance level of 111.61, there is scope for a pullback in price. Support has now moved up to 111.72 level. This marks the top of the bull flag rally. Yesterday's gains towards 112.44 marked the 127.2% Fibonacci extension level of the bull flag pattern. The next target remains at 113.36 with the pullback to the support at 111.72 likely to limit the declines.
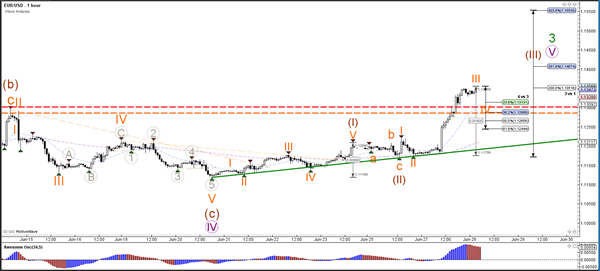
Daily Technical Analysis: EUR/USD Breaks Above Massive 1.13 Resistance And Continues Uptrend
Currency pair EUR/USD
The EUR/USD broke above the critical and important resistance levels at 1.13 (dotted orange and red lines) which invalidated the bearish wave structure. Price also has managed to finally break the sideways range which was indicated by support (blue) and resistance (red/orange). The bullish break makes an uptrend continuation which is reflected in the alternative and new wave structure: price has broken above the 161.8% Fibonacci level which makes a wave C unlikely a wave 3 (blue/green) more likely.
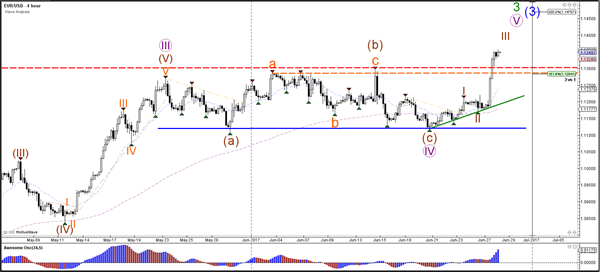
The EUR/USD is showing strong bullish momentum which is most likely a wave 3 (orange). Once the wave 3 is completed, the EUR/USD will most likely build a light retracement within wave 4 (orange) of a larger wave 3 (brown). The wave 4 is invalidated if price manages to break below the 61.8% of wave 4 vs 3.
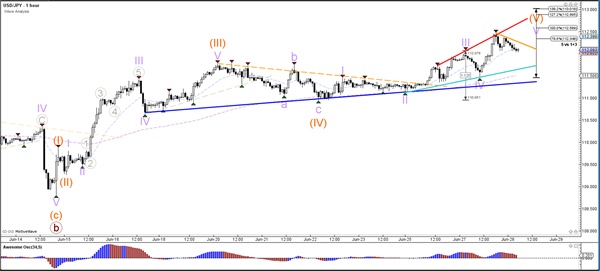
Currency pair USD/JPY
The USD/JPY is moving higher within a wave 5 (orange) of wave C (brown). A break above the top of the channel (red) could see price move towards the Fibonacci targets of wave C (brown).
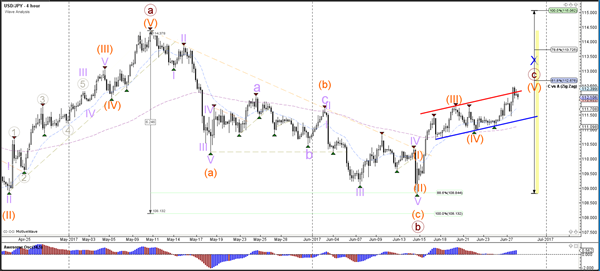
The USD/JPY needs to break above the resistance trend lines before a bullish continuation is likely. A break below support could indicate that the waves 5 are completed.
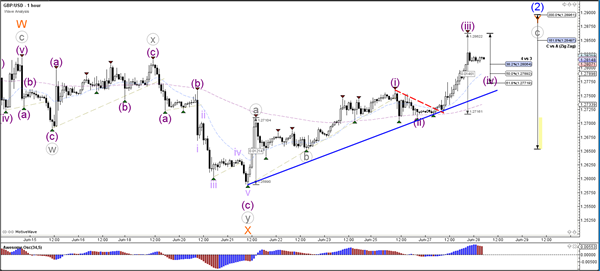
Currency pair GBP/USD
The GBP/USD is building an ABC (grey) zigzag within wave 2 (blue). A wave 2 (blue) becomes unlikely if price manages to break above the 200% Fib and resistance trend line (red).
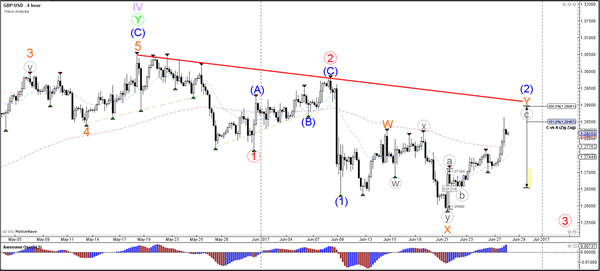
The GBP/USD bullish momentum is most likely a wave 3 (purple) which means that price could be retracing within a wave 4 (purple). A break below the 61.8% Fib of wave 4 vs 3 and the trend line (blue) invalidates the wave 4.