Sample Category Title
Elliott Wave View: EURJPY Update 6.28.2017
Short term EURJPY Elliott Wave view suggests the decline to 122.35 on 6/15 low ended Intermediate wave (X). Rally from there is unfolding as an impulse Elliott Wave structure with extension where Minute wave ((i)) ended at 124.46 and Minute wave ((ii)) ended at 123.62. Minute wave ((iii)) is in progress as 5 waves. After a short term pullback in Minutte wave (iv), another leg higher still can be seen in Minutte wave (v) to finish Minute wave ((iii)). Pair should then pullback in Minute wave ((iv)) before turning higher again. We don’t like selling the pair.
EURJPY 1 Hour Elliott Wave Chart
Dollar Stares at the Election-Speech Low
The moves seen across Euro pairs overnight have drastically changed the sentiment for the US Dollar, which was already struggling to gain traction despite the Fed maintaining a hawkish stance.
Only yesterday we outlined the potential for the US Dollar index to remain trapped between 96.50 - 97.80 for the foreseeable future, yet Draghi changed that in his speech.
Whilst the timing was off, we are not surprised by the decision for Draghi to turn slightly more hawkish. The economy is ticking along nicely and leading indicators and sentiment continue to have higher hopes for the future. So, if hard data now backs up this view then a weaker US Dollar could be on the cards.
Due to the aggressive bearish bar yesterday, it is difficult not to see this move lower extending. Granted, the low did stall just above 96.30 support but this is more likely to generated a mild rebound at best. Therefore, the next key level in view becomes 95.88, which marks the low printed in the hours leading up to Trump's acceptance speech. The 'abc' pattern highlighted appears to be an expanded flat. As this tend to trick traders into at least two incorrect moves before returning to the higher trend, it also points to further downside. The low which we now label 'b' would have appeared to be a bearish continuation, which promptly turned around after the Fed meeting. Likewise, what is now 'c' likely also caught investors out as part of a bull-trap, only to plummet lower. The psychology of this move is important to understand because it now provides yet more reasons to sell the Dollar, as we have a diverging theme. Buy Europe, Sell US.
To put yesterday's trading range into perspective, we have plotted the historical open to open (OO) prices as a percentage for the past 20 years. The OO range was -1.03% and only marginally smaller than the high to low range of 1.15%. Only 1.51% of the time has the OO range been between -1% to -1.2%, and only 3.9% has it been a more bearish read than 1.03%. What this basically means is that the US Dollar is on the back foot, and it could now provide multiple opportunities to short US crosses. One such one we heighted a couple of times since last week was to short USDCAD, as oil prices were more likely to rebound than extend the already oversized losses.
We finally saw a close beneath the bullish trendline, which also broke the MS2 to the downside. In similar fashion to DXY, the prominent swing has only by emphasised by the bearish follow-through although in this instance the said high also rejected the 200-day average. This latter point makes us suspect we may see more downside potential on USDCAD than say DXY.
A slight reservation for the near-term is its reluctance to extend losses during Asia as it loiters just beneath the MS2 pivot. Whilst pivots can aid as targets or potential S/R when clustered with other technical levels, they tend to generate a lot of noise around them when seen alone. Therefor we would not be too surprised to see a round during either Europe or early US, but we are ultimately seeking a move down to 1.0305 support. Until we see a break of the 1.3349 high, further downside looms.
This also puts CNH back onto our radars as a macro barometer for the US Dollar. After testing the 100% extension then promptly bouncing higher, we had pondered whether the end of an ABC correction had been seen from the 6.9866 high. Yet at current prices CNH would be on track for a bearish outside week which leaves potential for a lower higher. If we see CNH falling hard, chances are it is not restricted to the USD cross.
Where Is The Swissy Heading Next?
Key Points:
- After a major stumble, fears of another pronounced decline are on the rise.
- Some mixed technicals offer an interesting forecast for the days ahead.
- The long-term bias is now bearish overall.
The USDCHF was absolutely slammed by the broader swing away from the Greenback yesterday and this has revived the bear's hopes that they can once again be in the driving seat for the pair. Indeed, given a handful of technical readings, it may notactually be an unlikely outcome. However, a few dissenting indicators also suggest that the bears may not have ultimate authority in the coming weeks – even if they should command the Swissy's direction in the long-term.
As shown below, the USDCHF bears had a rather resounding victory yesterday, managing to sink the pair by around 140 pips in a single session. Understandably, this has raised the spectre of the 500 pip decline seen mid-way through last month – sparking concerns that a similar slide could now be on the way. This view is only reinforced by certain technical indicators such as the newly bearish Parabolic SAR and the overwhelmingly bearish EMA bias. Nevertheless, there could be an alternate forecast at hand that may disappoint those looking to capitalise on another rapid plunge for the Swissy.
Specifically, price action actually seems to be forming a rather convincing falling wedge structure, the downside constraint of which appears to be holding firm. Indeed, it looks unlikely that this constraint is going to yield anytime soon which is due, in part, to the stochastics that are now trending into oversold territory. Importantly,if such a pattern is forming, the implication is that – far from another surge lower – we could see a near-term uptrend that may extend all the way back to the 0.9713 handle.
Interestingly, the presence of the wedge neither violates the near-term technical readings signalling that the pair needs to rebound nor the long-term readings suggesting that the USDCHF must remain under pressure. As a result, whilst we may expect to see the pair gradually make its way down to the 0.9531 mark, the bulls may put up a bit more of a fight than they have previously. However, we are also discounting the likelihood of the fledgling double bottom pattern emboldening the bulls too much as the combination of the 100 day EMA's placement and the 38.2% Fibonacci level should prevent a breakout above the potential neckline.
Overall, expect to see the pair to stage a modest recovery over the proceeding weeks and pay particular attention around the 0.97 handle as this could prove to be a near-term cap on upsides. Subsequently, we should see the bears go back on the offensive and begin to send the USDCHF all the way back to around the 0.9531 handle, as per the above-described chart pattern.
Euro Bears Not Seen for Dust Overnight | ECB Tease with Tapering
It was all about Draghi and the Euro overnight, after he hinted that stimulus may be tweaked to compensate for improvements to the economy.
The current asset buying program runs until the end of the year, so traders now think the ECB's September may include an announcement to taper. Their joy and relief at this prospect can be clearly seen by the dust left behind traders bid the Euro aggressively higher.
EURUSD is now within striking distance of 113 and the US Dollar Index is considering a run for 96, which is where the low of Trump's election speech awaits. It probably didn't help that Fed Chair Yellen announced she didn't expect another financial crisis to occur in 'our lifetimes', as the Fed unfortunately do have a knack of releasing glowing comments about stability before major downturns. This may not turn out to be the case, but the comment certainly didn't reassure Dollar bulls overnight.
Read the full speech by Mario Draghi
- A key issue facing policymakers is ensuring that nascent growth becomes sustainable.
- Dynamic investment that drives stronger productivity growth is crucial for that
- We can be confident that our policy is working and its full effects on inflation will gradually materialise.
- Our policy needs to be persistent,
- We need to be prudent in how we adjust its parameters to improving economic conditions.
- For the monetary transmission process to work, however, stronger growth and employment ought to translate into upward pressure on wages and prices.
- We can be reasonably confident that the forces we see weighing on inflation are temporary
- Our monetary policy measures have been successful in avoiding a deflationary spiral
- Prolonged period of low inflation is always likely to be exacerbated by backward-lookingness in wage and price formation
- As the economy continues to recover, a constant policy stance will become more accommodative
- The central bank can accompany the recovery by adjusting the parameters of its policy instruments to keep it broadly unchanged.
- Deflationary forces have been replaced by reflationary ones.
- For us to be assured about the return of inflation to our objective, we need persistence in our monetary policy.
- As the economy picks up we will need to be gradual when adjusting our policy parameters
The response from Euro bulls was widespread, which pushed EURUSD above 113 and to its highest levels since August 2016 and EURJPY to its highest level since April 2016. An interesting stat which we saw last December, was the closing direction of January had correctly predicted the direction of the year of 19 out of 20 years. As January closed in the green, it does indeed appear this stat is playing out nicely and that Euro is more likely to be trading higher by the 2017 compared with its open. Yet from here we need to decipher just how much upside is left for the Euro.
The monthly pivot marks a prominent swing low and a bullish channel has had its trajectory revised higher, making EUR an ideal candidate to buy any pullbacks on lower timeframes.
After many years of investors fearing the end of the Euro, the mindset remains for a majority that Euro could be trading lower. Yet when we consider all the battles it has endured without breaking below or even testing parity, this leaves EUR vulnerable to upside from here if data continues to support tightening. The fact that it rallies so hard when only a minor clue is given over the mere potential of a small tightening, also underscores this point that Euro could still be undervalued.
Traders reverted to net long in recent weeks, although the index has reached a level which was last associated with a bearish turnaround. Yet we also note that EURUSD trades at a significant discount to the last time traders were this net long. Furthermore, traders are not really that net long at all, especially when we assess the long and steady advance of gross long positions which have been taken since H1 2015. Therefor we suspect that in all the time Trump fails to implement inflationary policies and European data continues to outperform the US, the path of least resistance is more likely to be higher for the Euro from here.
EUR/USD Daily Outlook
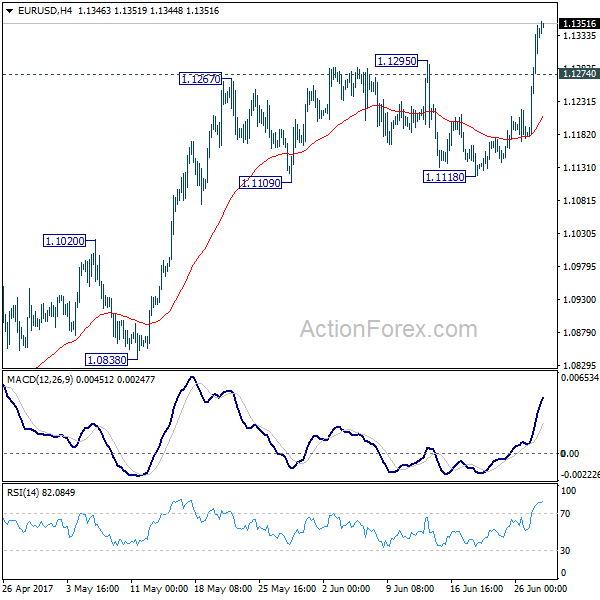
Daily Pivots: (S1) 1.1227; (P) 1.1288 (R1) 1.1398; More....
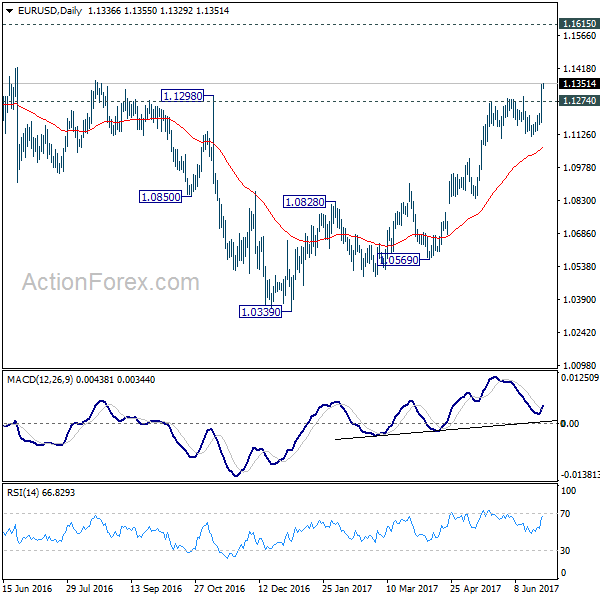
EUR/USD surges to as high as 1.1355 as larger rally from 1.0339 resumed. Break of 1.1298 resistance carries larger bullish implication. Intraday bias stays on the upside for 1.1615 resistance next. On the downside, below 1.1274 minor support will turn bias neutral and bring retreat. But pull back should be contained above 1.1118 support to bring rise resumption.
In the bigger picture, the break of 1.1298 resistance further affirm medium term reversal. That is an important bottom was formed at 1.0339 on bullish convergence condition is seen in weekly MACD. Further rise would be seen to 55 month EMA (now at 1.1776). Sustained break there will pave the way to 38.2% retracement of 1.6039 (2008 high) to 1.0339 (2017 low) at 1.2516 next. This will now remain the favored case as long as .1118 support holds.
GBP/USD Daily Outlook
Daily Pivots: (S1) 1.2731; (P) 1.2796; (R1) 1.2876; More...
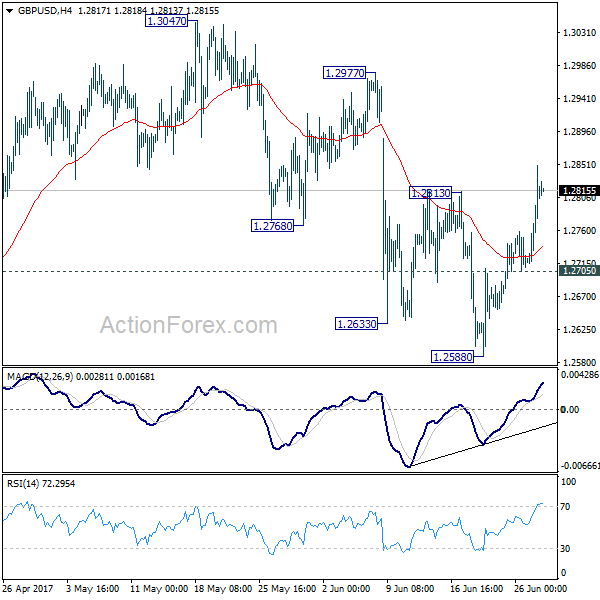
GBP/USD's rebound from 1.2588 extended higher to 1.2849 so far. Break of 1.2813 resistance argues that pull back from 1.3047 has completed at 1.2588. Intraday bias is turned back to the upside for 1.2977 resistance first. Break there will likely extend the larger rise through 1.3047 resistance. On the downside, below 1.2705 minor support will turn intraday bias back to the downside for 1.2588 instead.
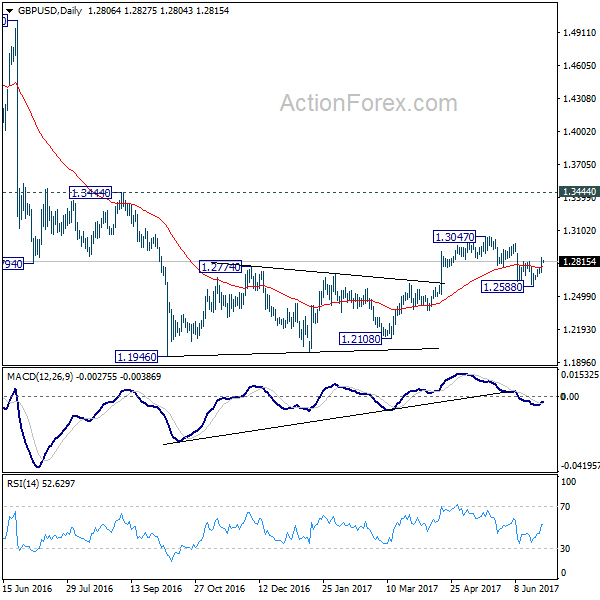
In the bigger picture, overall, price actions from 1.1946 medium term low are seen as a corrective pattern. Pull back from 1.3047 has completed after failing to sustain below 1.2614 resistance turned support. It argues that the corrective pattern from 1.1946 is still in progress for another high above 1.3047. But still, outlook remains bearish as long as 1.3444 key resistance holds. Larger down trend from 1.7190 is still expected to resume later after the correction completes.
USD/CHF Daily Outlook
Daily Pivots: (S1) 0.9552; (P) 0.9643; (R1) 0.9693; More.....
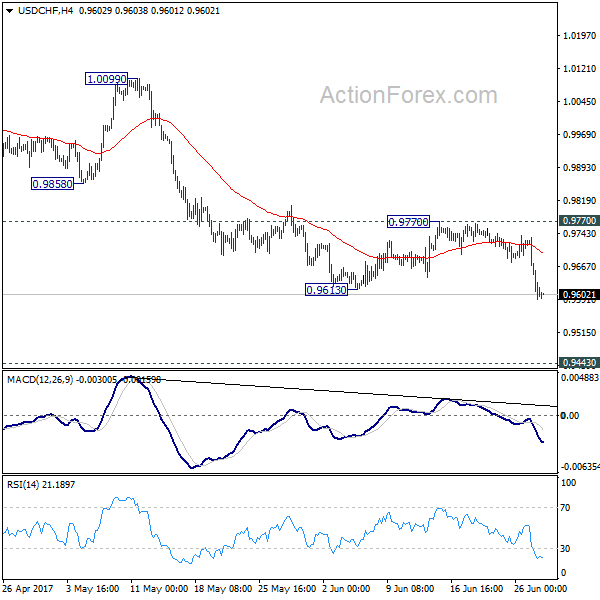
Break of 0.9613 support indicates resumption of whole fall from 1.0342. Intraday bias in USD/CAD is turned back to the downside for 0.9548 support and below. We'd start to look for bottoming signal again as it approaches 0.9443 key support level. But still, break of 0.9770 resistance is ended to indicate short term bottoming. Otherwise, outlook will remain bearish in case of recovery.
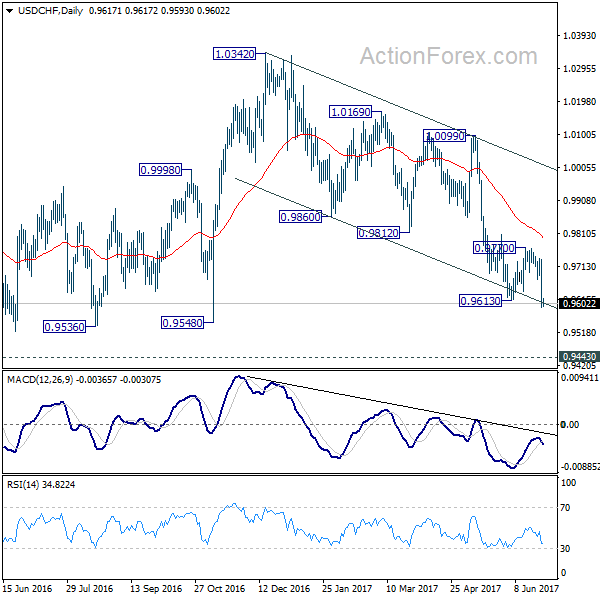
In the bigger picture, USD/CHF is still bounded in medium term range of 0.9443/1.0342 for the moment. Consolidative trading would likely continue and medium term outlook remains neutral. Break of 1.0342 key resistance is needed to confirm underlying bullish momentum in the pair. Meanwhile, downside attempts should be contained by 0.9443 key support level. However, sustained break of 0.9443 will carry larger bearish implication and target 0.9 handle.
USD/JPY Daily Outlook
Daily Pivots: (S1) 111.71; (P) 112.09; (R1) 112.71; More...
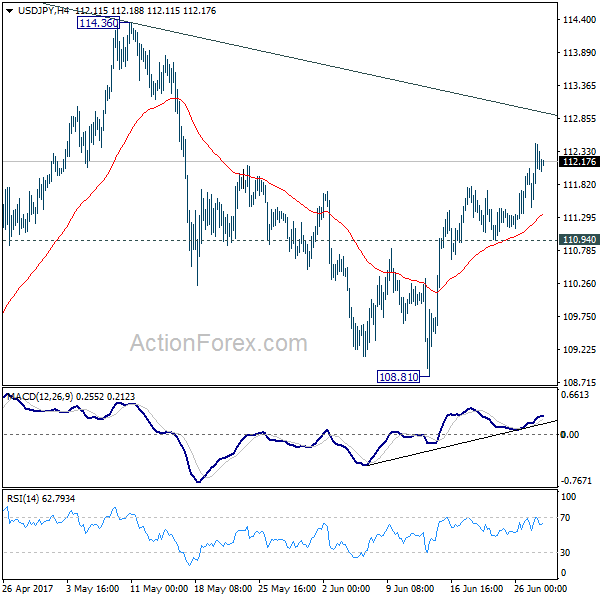
Intraday bias in USD/JPY remains on the upside as rise from 108.81 is in progress for channel resistance (now at 112.99). Sustained break there will suggest that whole pull back from 118.65 has completed at 108.12 already. In such case, further rise should be seen to 114.36 resistance for confirmation. On the downside, however, break of 110.94 support will argue that rebound from 108.81 has completed and turn bias back to the downside.
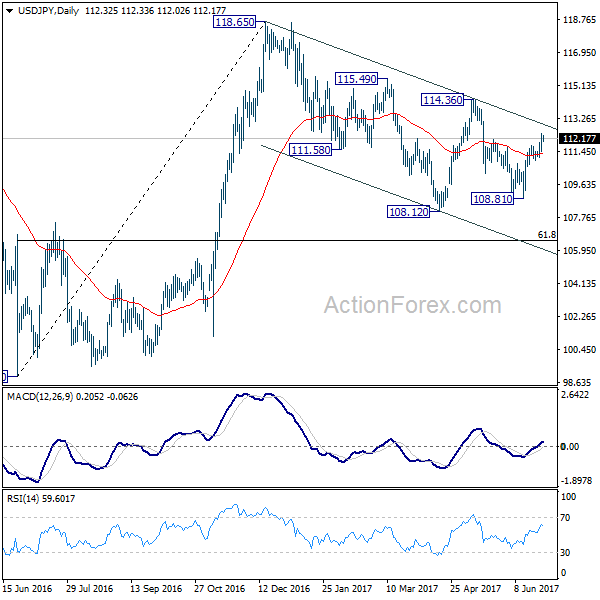
In the bigger picture, price actions from 125.85 high are seen as a corrective pattern. It's uncertain whether it's completed yet. But in case of another fall, downside should be contained by 61.8% retracement of 75.56 to 125.85 at 94.77 to bring rebound. Overall, rise from 75.56 is still expected to resume later after the correction from 125.85 completes.
USD/CAD Daily Outlook
Daily Pivots: (S1) 1.3143; (P) 1.3202; (R1) 1.3256; More....
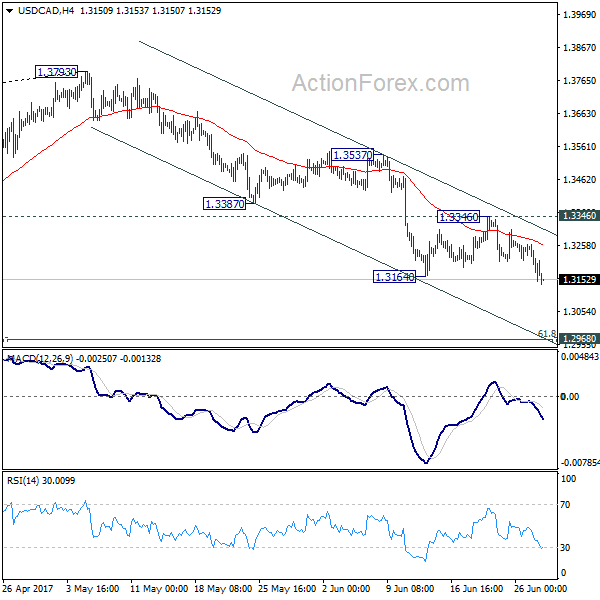
Break of 1.3164 support indicates resumption of fall from 1.3793. Intraday bias in USD/CAD is turned back to the downside for 1.2968 cluster support, 61.8% retracement of 1.2460 to 1.3793 at 1.2969. Decisive break there will confirm our bearish view that whole corrective rise from 1.2460 has completed at 1.3793. On the upside, break of 1.3346 resistance is needed to indicate short term bottoming. Otherwise, outlook will remain bearish in case of recovery.
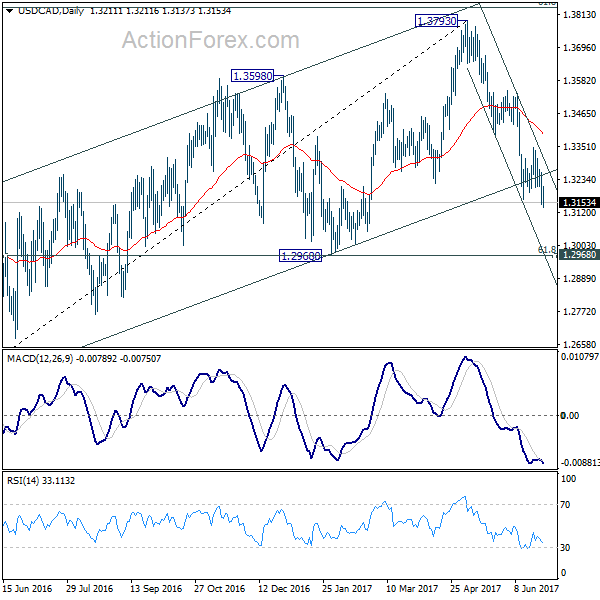
In the bigger picture, price actions from 1.4689 medium term top are seen as a correction pattern. The first leg has completed at 1.2460. Rise from 1.2460 is seen as the second leg and has completed at 1.3793, ahead of 61.8% retracement of 1.4689 to 1.2460 at 1.3838. Break of 1.3222 should now indicate the start of the third leg while further break of 1.2968 should confirm. In that case, USD/CAD should decline through 1.2460 support to 50% retracement of 0.9406 to 1.4869 at 1.2048.
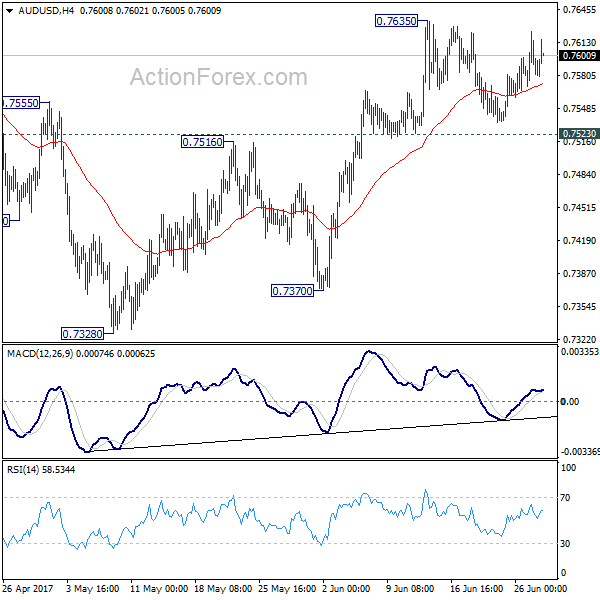
AUD/USD Daily Outlook
Daily Pivots: (S1) 0.7565; (P) 0.7594; (R1) 0.7612; More....
AUD/USD is still bounded in range below 0.7635 and intraday bias stays neutral first. On the upside, break of 0.7635 will extend the rise from 0.7328 to 0.7748 resistance and above. At this point, there is no clear sign of range breakout yet. Hence, we'd be cautious on topping again as it approaches medium term fibonacci level at 0.7849. Meanwhile, break of 0.7523 will argue that rebound from 0.7328 is possibly completed. In that case, intraday bias will be turned back to the downside for 0.7370 support.
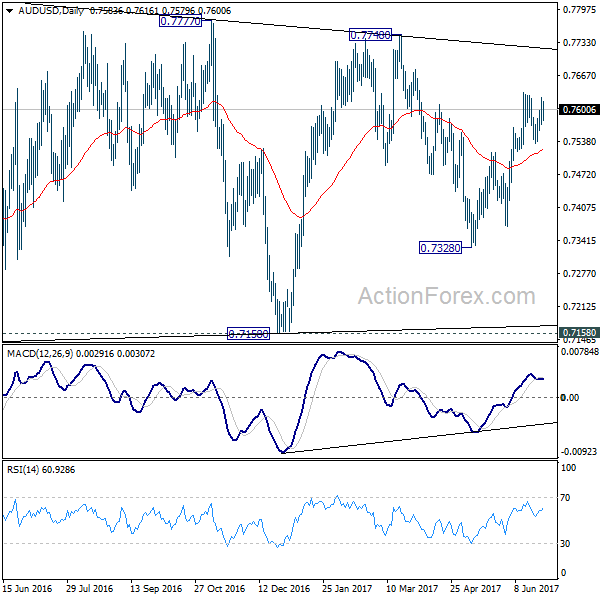
In the bigger picture, we're still treating price actions from 0.6826 low as a corrective pattern. And, as long as 38.2% retracement of 0.9504 to 0.6826 at 0.7849 holds, long term down trend from 1.1079 is expected to resume sooner or later. Break of 0.6826 low will target 0.6008 key support level. However, firm break of 0.7849 will indicate that rise from 0.6826 is developing into a medium term rebound, rather than a sideway pattern. In such case, stronger rise should be seen to 55 month EMA (now at 0.8116) and above.