Sample Category Title
Foreign Exchange Market Commentary: EUR/USD, USD/JPY, GBP/USD, GOLD, WTI CRUDE, DJIA, FTSE100, DAX
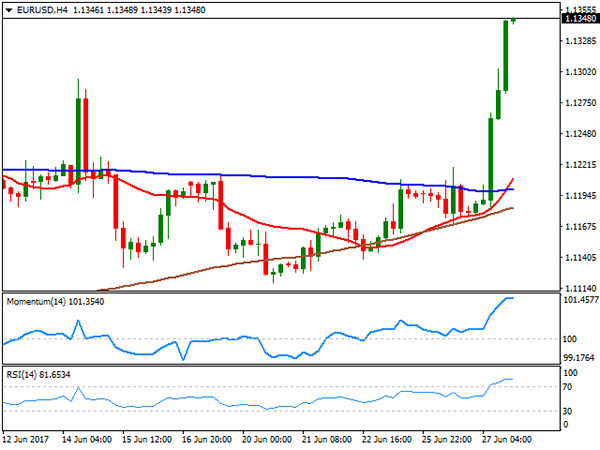
EUR/USD
The EUR/USD pair began rallying early European session, and continues to do so ahead of Wall Street's opening, as the market finally got the excuses needed to move. The common currency got a considerable boost from ECB's head, Mario Draghi, in the European morning, resulting in the EUR/USD pair reaching a fresh 2017 high of 1.1304, accelerating further in the US afternoon and flirting with 1.1350 after Fed's officers hit the wires, its highest since August 2017.
In a speech at an ECB forum on Central Banking, Draghi offered a confident stance on the economic progress of the region, saying that "all the signs now point to a strengthening and broadening recovery in the euro area," but also reaffirmed the need of maintaining QE in place, although hinted the possibility of a sooner-than-expected tapering, noting that the threat of deflation is gone.
In the US, Fed's Harker supported the decision to raise interest rates again this year, even though he predicts prices will take longer to rebound to the Fed's goal revising his prediction on when inflation will reach the 2% target to early 2018 from late this year. Chair´s Yellen has also been on the wires, but her comments were focused on the strength of the banking system, hitting the greenback by reckoning that real income has been stagnant, hurting mostly the middle class.
Technically, the pair is up for over 150 pips daily basis, leaving intraday indicators in extreme overbought territory, but there no signs of upward exhaustion just yet, and given that the pair broke above 1.1300, further gains are likely for the upcoming sessions as long as pullbacks towards the level attract buying interest. In the 4 hours chart, technical indicators have decelerated, but maintain their bullish slopes within overbought territory, with the RSI indicator currently at 80, while far beyond the current level, the 20 SMA accelerated north, crossing above the 100 SMA, another sign of the dominant bullish momentum.
Support levels: 1.1300 1.1260 1.1220
Resistance levels: 1.1370 1.1420 1.1460
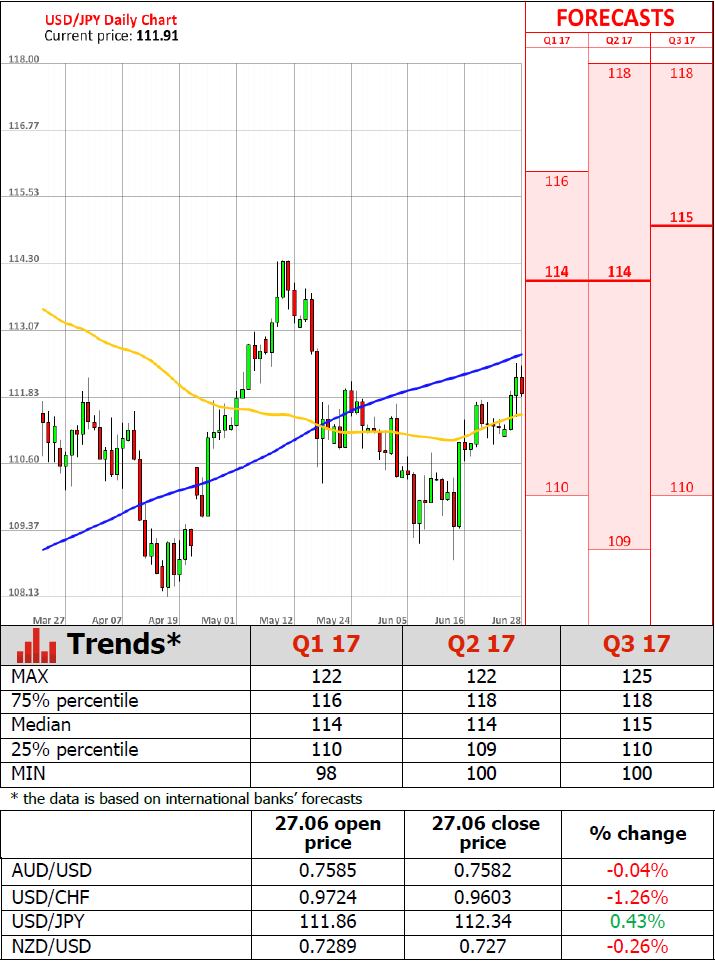
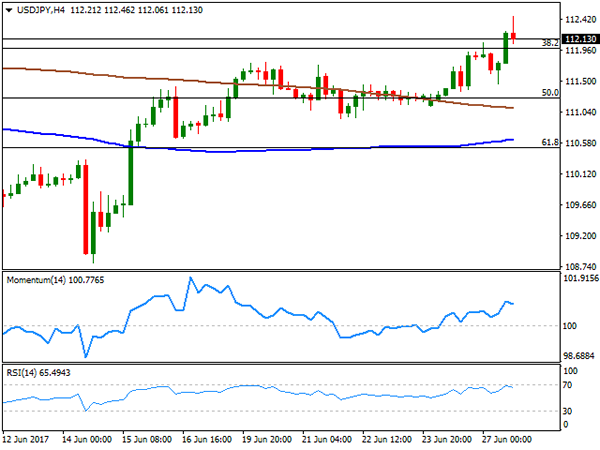
USD/JPY
The USD/JPY pair rallied up to 112.46, its highest in over a month, as bonds came under pressure worldwide following Draghi's hawkish comments early London, indicating that things are improving in the region and hinting somehow that QE may come to an end sooner than expected. US Treasury yields jumped to their highest in nearly two weeks, with the US 10-year note benchmark up to 2.20% from previous 2.14%. Japan won't release any macroeconomic reading during the upcoming session, with the pair therefore set to keep following yields, and sentiment. The pair retreated from the mentioned high, but settled above the 112.00 mark, presenting a moderate upward tone by the end of the US session, given that the 4 hours chart shows that the price continues developing above its 100 and 200 SMAs, but also that technical indicators are beginning to retreat after nearing overbought levels. The immediate support comes at 112.00, the 38.2% retracement of its April/May bullish run, and the positive tone will persists as long as the level contains intraday declines. Below it, however, the risk will turn clearly towards the downside.
Support levels: 112.00 111.60 111.20
Resistance levels: 112.45 112.80 113.20
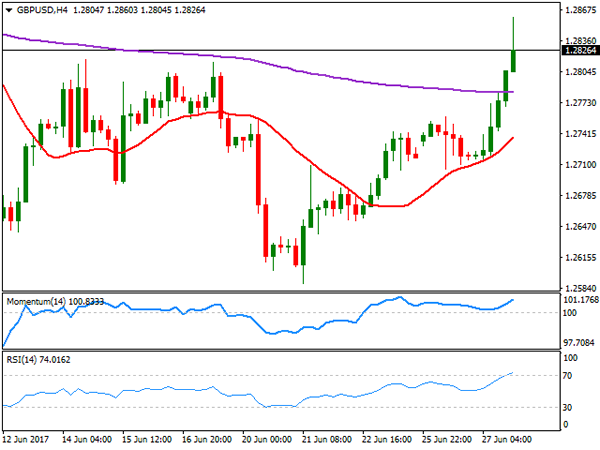
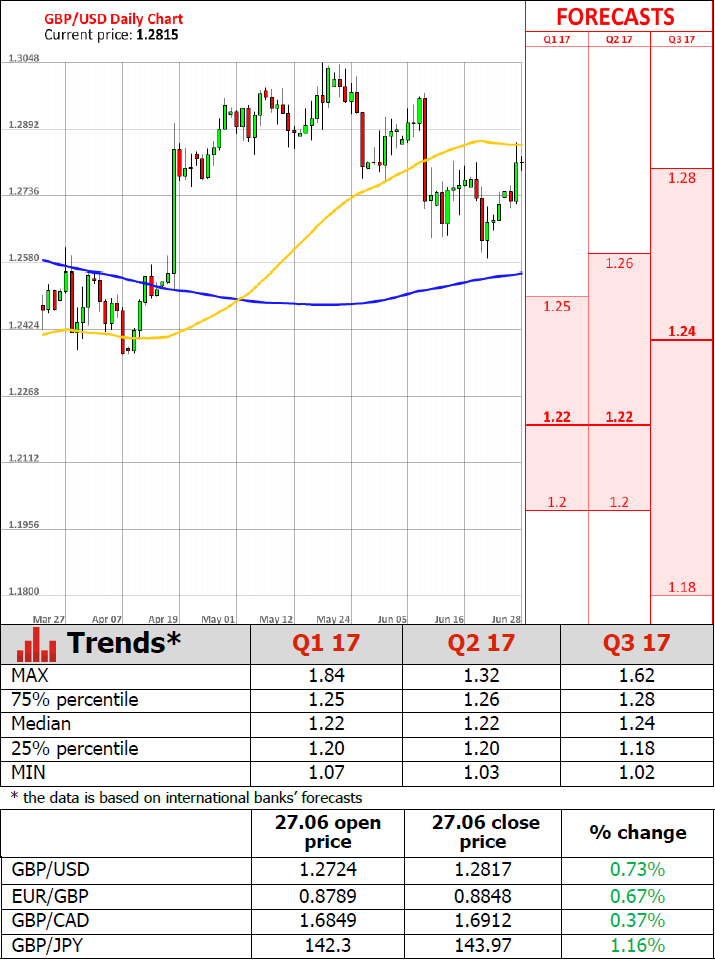
GBP/USD
The GBP/USD pair jumped up to 1.2860 by the end of the US session, triggering stops past 1.2820 and backed by comments from BOE's Carney earlier on the day and broad dollar's weakness. Following the release of the UK Financial Stability report, Carney offered a press conference, announcing that the Central Bank will raise banks' required capital buffer from 0.5% to 1.0% in November, but the report was overall positive about local conditions, assessing the overall risks from the domestic environment to be at a "standard level." The strong rally in the EUR/GBP cross limited Pound gains, alongside with Brexit jitters, always pending in the background. Anyway, the pair is technically bullish according to the 4 hours chart, with the price having bounced again earlier on the day from a bullish 20 SMA, now crossing above its 200 EMA for the first time since the election on June 8th. In the same chart, technical indicators head higher within positive territory, with the RSI indicator nearing overbought levels, in line with further gains ahead. The pair has multiple intraday highs in the 1.2810/20 region, now the immediate support, with scope now to test 1.2900, should the level contain declines.
Support levels: 1.2820 1.2770 1.2720
Resistance levels: 1.2860 1.2890 1.2930
GOLD
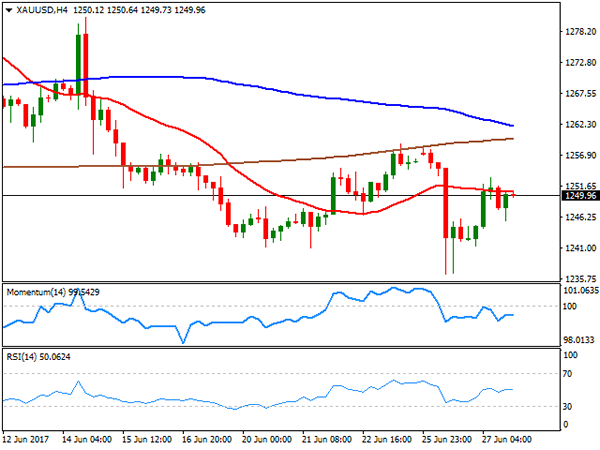
Gold recovered some ground this Tuesday with spot setting at $1,250.00 a troy ounce, nearly trimming all of its Monday's losses. The bright metal found support in dollar's weakness, fueled by comments from Fed's officers, sounding far less confident over inflation developments, rising doubts over the Central Bank's ability to maintain its tightening path. After plummeting to a fresh one-month low on a what many suspect a "fat finger" on Monday, the recovery is not yet enough to confirm additional strength ahead, given that in the daily chart, the price was unable to advance beyond its 100 DMA, while a bearish 20 DMA keeps heading south above the largest. Technical indicators in the mentioned chart have managed to recover, heading higher but still hold within bearish territory. Shorter term, the 4 hours chart shows that the price struggles right below a flat 20 SMA, with the 100 and 200 SMAs far above the current level, and technical indicators lacking directional strength, and holding right below their mid-lines, leaning the scale towards the downside, particularly on a break below 1,245.50, the immediate support.
Support levels: 1,236.45 1,229.35 1,218.70
Resistance levels: 1,245.50 1,258.00 1,265.10
WTI CRUDE OIL
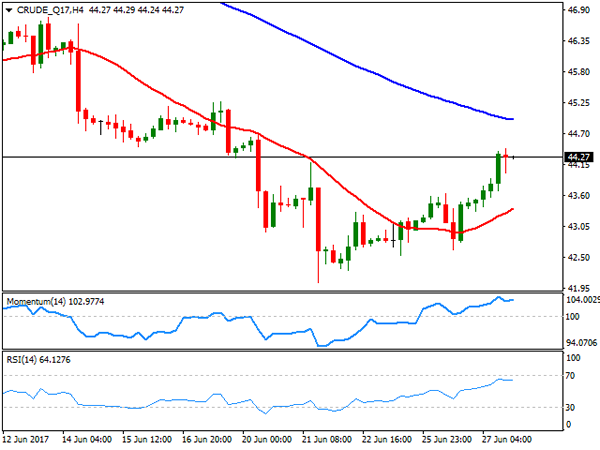
West Texas Intermediate crude futures closed the day at $44.30 a barrel, with oil prices up on the back of dollar's broad weakness. The absence of oil market's news helped prices recover, although the movement seems still corrective, and the commodity at risk of falling further amid fears of a global glut. Ahead of US stockpiles reports, the daily chart for WTI shows that the price remains below a sharply bearish 20 DMA, offering a dynamic resistance at 44.90, while the Momentum indicator consolidates below its 100 level and the RSI indicator heads north around 40, indicating limited buying interest. In the 4 hours chart, the price managed to advance beyond a now modestly bullish 20 SMA, but a sharply bearish 100 SMA stands also around 44.90, reinforcing the resistance level, while technical indicators have lost upward strength, now consolidating within positive territory.
Support levels: 43.80 43.20 42.50
Resistance levels: 44.90 45.60 46.10
DJIA
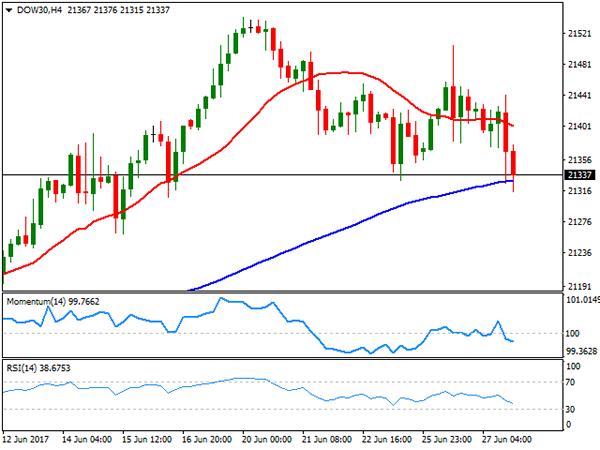
Wall Street closed in the red, undermined by a sell-off in the tech sector, and news that the US Senate decided to delay the new health care bill vote until after the July 4th holiday. Further affecting equities was a cyber attack to multiple international firms. The Dow Jones Industrial Average shed 99 points, to end at 21,310.66, while the Nasdaq Composite plunged 100 points, to 6,146.62. Losses in the S&P were moderated, as the index settled at 2,41.38, down by 19 points. Within the Dow, only 4 members closed higher, led by JPMorgan Chase, up 1.02%, and followed by Wall Mart which gained .81%, Verizon Communications was the worst performer, down 1.91%, followed by Microsoft that shed 1.67%. The daily chart for the DJIA shows that the index stands right above its 20 DMA, pressuring it for the first time this month, whilst technical indicators turned lower, but remain within positive territory. In the 4 hours chart, the index is below a bearish 20 SMA, but held above a bullish 100 SMA, whilst technical indicators entered bearish territory, but present a limited bearish strength.
Support levels: 21,389 21,351 21,303
Resistance levels: 21,449 21,495 21,542
FTSE100
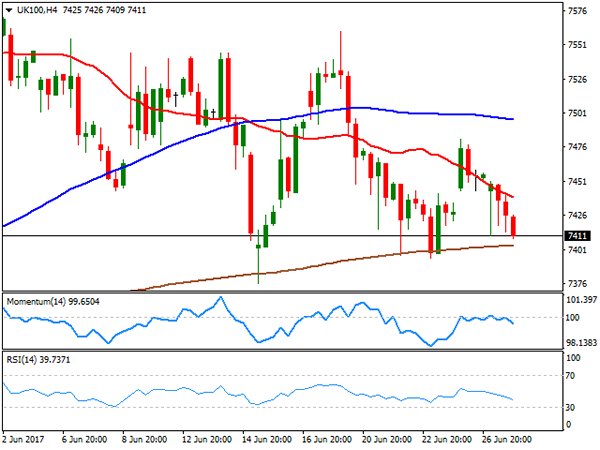
The FTSE 100 closed the day down 12 points, at 7,434.36, with retailers leading the decline, after a profit warning from Debenhams, a local department store that said its full-year profit could come at the lower end of expectations. A sharp advance in the mining sector, however, limited the decline. The Pound jumped higher after London's close, leading the index further lower in electronic trading, now around 7,403. Glencore led advancers, up 3.73%, followed by Rio Tinto, Anglo American and Antofagasta, all up by over 3.0% GKN was the worst performer, down 4.31%, followed by Admiral Group that shed 2.25%. From a technical point of view, the daily chart shows that the index remained well below a bearish 20 DMA, whilst technical indicators turned south within negative territory, favoring a downward extension for this Wednesday. Shorter term, the 4 hours chart shows that a bearish 20 SMA contained advances, whilst technical indicators also turned lower within bearish territory, with the RSI currently at 38, in line with the longer term perspective.
Support levels: 7,376 7,347 7,298
Resistance levels: 7,442 7,497 7,541
DAX
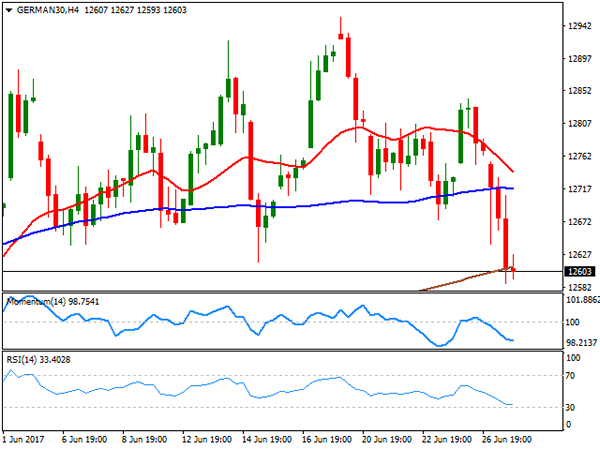
The German DAX closed the day at 12,671.02, down 99 points or 0.78%, as European equities edged lower following Draghi's hawkish speech that sent the EUR higher against all of its major rivals. Adding to the negative tone of regional equities were concerns over profits, with the automotive sector undermined by General Motors, as the company lowered its outlook for new sales in 2017. Within the DAX, only three members closed with gains, with Commerzbank that advanced 4.02% and Deutsche Bank, which gained 2.55% topping winners list amid Italian's banks rescue earlier in the week bringing confidence to the sector. Continental was the worst performer, down 3.70%, followed by E.ON that shed 3.68%. The German index fell further in after-hours trading, following the lead of Wall Street, heading into Wednesday opening right below 12,600, its lowest for this month. The daily chart shows that the index fell and stands well below its 20 DMA, whilst technical indicators are gaining bearish traction, the Momentum around its mid-line but the RSI around 44, this last favoring additional slides ahead. In the 4 hours chart, the index is now below its 200 SMA, having broken below the 20 and 100 SMA earlier on the week and with technical indicators heading sharply lower within bearish territory, maintaining their bearish slopes near oversold territory.
Support levels: 12,587 12,529 12,461
Resistance levels: 12,646 12,707 12,763
Oil Recovers As Investors Come Around, Draghi’s Comments Bolster EUR
Oil outlook remains clouded
Crude oil prices struggled to recover from the sharp sell-off that has sent a barrel of West Texas Intermediate to $42.05, down almost 20% from its peak of May 25th. However, since June 21, the WTI was able to recover marginally thanks to a weaker US dollar and reassessment of the fundamentals by investors. From a technical standpoint, the WTI's sell-off has been stopped by the key support at around $42 (multi lows).
Overall, it seems that investors are negatively skewed about the oil outlook as even the recent political turmoil in the Middle East - several countries cut their diplomatic ties with Qatar, a major oil and gas producer in the region - was unable to stop the debasement in crude oil prices. In addition, the sustained contraction in US crude inventories seems to have no effect either.
Market participants have lost faith in OPEC's ability to drive prices as several of its members (mostly Iraq) failed to comply with the deal and did not cut production sufficiently. In addition, Iran declared it had increased the capacity of its main oil terminal, which tends to indicate that the world's fifth largest oil producer is all set to inch up production. Finally, according to the EIA, the US had more than doubled its exports of crude oil and petroleum products over the last six years as exports restrictions were lifted. Furthermore, the US shale industry continues to optimise production and cut costs.
On the medium to long-term we remain cautious on the oil outlook as the fundamentals do not support upside gains. However, in the short-term, crude oil prices have room to recover somewhat, thanks to a weak dollar and the end of the panic selling.
Draghi's comments boost single currency
Mario Draghi sent the euro much higher yesterday after his speech at the European Central Bank Forum. Markets felt relieved especially after his dovish comments a few weeks ago when he declared that the Eurozone still needed ECB stimulus.
Draghi made also some comments about inflation, which is below target, and that should remain soft for some more time despite ongoing improvement.Recently pressures were adding up on the ECB's shoulders to tighten its monetary policy, especially since the Fed has twice raised rates this year already. Major drawbacks preventing the European institution to do so were mostly the modest economic growth and political uncertainties. Those elements are now not centre stage any more, particularly since the election of Emmanuel Macron in France.
Yesterday, the euro went over 1.1300 for the first time in nine months. The ECB President showed its optimism by stating that the Eurozone recovery is progressing and that the current monetary policy stance must accompany this recovery. That sounded hawkish but we consider it was not. Mario Draghi did not explicitly talk about tightening but about “parameters adjustment”. Markets interpreted that comment as a hint about further tightening. We rather believe this actually leaves the door open for a continued ultra-loose monetary policy.
XAU/USD Analysis: Remains Below 1,250
On Wednesday morning the yellow metal continued to trade in the range between the support provided by the weekly S1 at 1,246 and the combined resistance of the weekly PP at 1,252.57 and the monthly PP, which is located at the 1,253 mark. Meanwhile, all of the hourly SMAs are located in the middle of the range between the two mentioned levels of significance. The 55 and 100-hour SMAs seem not able to influence the metal's price. However, the 200-hour SMA has proven its strength even in reversing the short term direction of the metal's price. Market participants are set to watch the situation develop, as a break above the 1,250 mark might mean a jump to the 1,260 level. Meanwhile, a fall below the weekly S1, would mark the beginning of a long term decline of the metal.
USD/JPY Analysis: Might See Further Upside Potential
Contrary to expectations, USD/JPY was driven by moderate upside momentum that lead to the US Dollar for an appreciation up to 112.40 against the Yen on Tuesday. Subsequently, the pair returned near the 20-hour SMA circa 112.10. By and large, technical indicators suggest further upside potential until the 113.00 mark where an intermediate down-trend on the daily chart is located. In case of strong upside momentum, the rate may likewise test the monthly R1 at 113.36. On the contrary, political uncertainty in the US may weight heavily on the Greenback, thus pushing it down to a support cluster formed by the monthly PP and the 55-hour SMA near 111.80. In terms of fundamentals, BOJ's Governor Kuroda is due to participate in a panel discussion at the ECB Forum at 1330 GMT.
GBP/USD Analysis: Mildly Bearish On Wednesday
The US Dollar's continuous weakness resulted in GBP/USD surging up to a three-week high at 1.2828 on Tuesday. Subsequently, the price was not able to overcome the 1.2820 mark and has since traded below the given level. Daily trading indicators signal that there is still some upside potential up to the monthly PP at 1.2903. However, the rate's minor motion sideways indicates that bears may prevail in this session. In addition, a retracement from the upper channel boundary is still expected. Nevertheless, this scenario might occur only within the following two days if strong downside risks do not set the British currency for a plunge. A more likely lower limit for this session might be the 38.2% Fibo or the monthly S1 at 1.2770 and 1.2758, accordingly.
EUR/USD Analysis: Jumps Above 1.13 Mark
Just like recently all the patterns on gold were broken, everything previously created is now irrelevant on the EUR/USD charts. The reason for that are massive fundamental changes in the Euro. During yesterday's speech the President of the European Central Bank Mario Draghi made an important announcement. The ECB is set to stop its monetary easing policies, which means that there will be less Euros in circulation. Subsequently that has caused the price of the Euro to skyrocket. The future outlook of the pair is set to be dictated by details of the stimulus cutting. However, some guidance for the short term can be taken from the technical levels. It can be seen that the previously active long term pattern's upper trend line is now providing support. That and the fundamental situation indicate at a surge.
Technical Outlook: EURJPY May Extend Rally Towards Fibo 61.8% Barrier At 128.91
The cross ticked higher on Wednesday and posted fresh high at 127.85 (the highest since 01 Apr 2016) in extension of Tuesday’s strong rally (the biggest one-day rally this year) when the price was up 1.88%.
Break above 125.81 (14 May former high) generated bullish signal for extension of bull-leg from 114.84 (16 Apr trough) towards next barrier at 128.91 (Fibo 61.8% of 140.99/109.38 (June 2015/June 2016 descend).
Overbought daily RSI / slow stochastic suggest corrective easing which should be ideally contained by previous high rising daily Tenkan-sen at 125.80/68 zone.
Res: 127.85, 128.91, 129.56, 130.00
Sup: 127.06, 126.67, 125.81, 125.68
EUR/CHF Elliott Wave Analysis
EUR/CHF : 1.0913
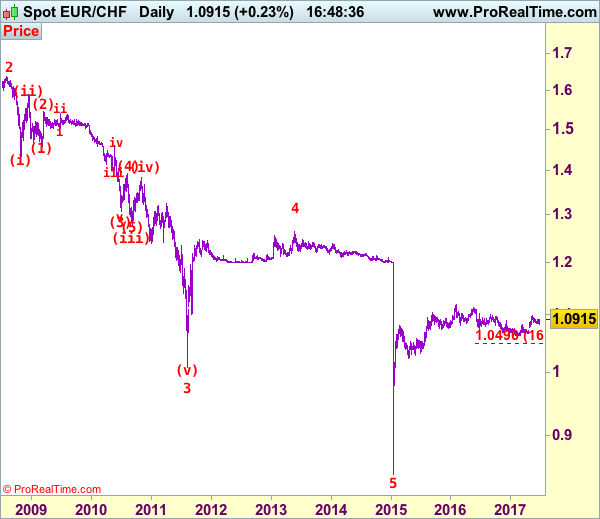
EUR/CHF: Major wave 5 trough ended at 0.8426 and correction has commenced from there for subsequent gain towards 1.1400-1.1500.
Although the single currency fell marginally to 1.0833 last week, euro found good support there and has staged another rebound, retaining our bullish view and consolidation with upside bias remains for test of resistance at 1.0910, break there would signal low is formed, bring test of 1.0949 resistance, only a daily close above there would signal the pullback from 1.0988 has ended and bring retest of this level. Looking ahead, above said resistance at 1.0988 would confirm recent rise has resumed and extend further gain to another previous resistance at 1.1001, break there would signal the upmove from 1.0622 low (2016 low) is still in progress for headway to 1.1018, then 1.1050 but reckon resistance at 1.1107 would limit upside and price should falter well below 2016 high at 1.1129.
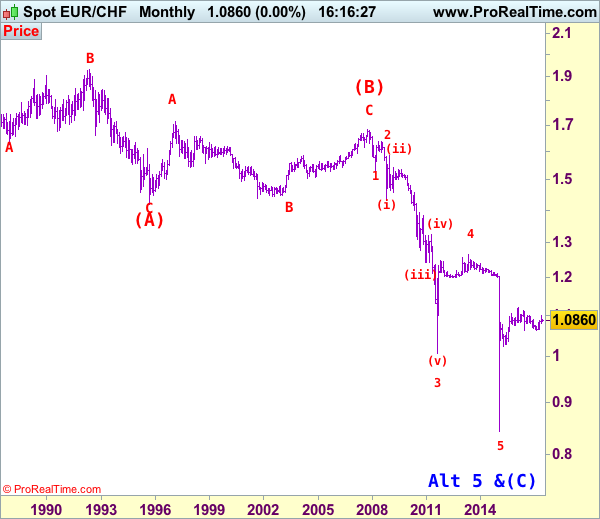
To recap our preferred count, the decline from 1.6828 (end wave (B)) is labeled as the beginning of wave (C) which should unfold as an impulsive move with 1: 1.5326, 2: 1.6377 and wave 3 is sub-divided into (i): 1.4300, (ii): 1.5880 and wave (iii) is still unfolding with (1): 1.4577, (2): 1.5448 and wave (3) is an extended 3rd with i: 1.5006, ii: 1.5383, wave iii: 1.3073, then wave iv ended at 1.3925 and wave v at 1.3073, wave (4) ended at 1.3925 and wave (5) has ended at 1.2765 which also marked the low of wave (iii) and wave (iv) has ended at 1.3835 and wave (v) as well as larger degree wave 3 has ended at 1.0075. The selloff from 1.2650 signals wave 4 has ended there and we are taking a view that the wave 5 could also have ended 0.8426, hence consolidation is seen with mild upside bias for rebound to 1.1000 first, then towards 1.1400.
On the downside, below said support at 1.0833 would risk weakness to previous support at 1.0792, however, a daily close below this level is needed to signal recent rise has ended and extend the fall from 1.0988 towards previous minor resistance at 1.0720. Looking ahead, only a drop below 1.0720 would suggest top is formed instead, risk weakness towards said support at 1.0656 first.
Recommendation: Hold long entered at 1.0905 for 1.1105 with stop below 1.0805.
The long-term downtrend started from 1.9626 (Apr 1985) to 1.4166 (Sep 1995) is treated as wave (A) with A:1.6285 (Dec 1987), B: 1.9342 (May 1992) and C: 1.4166, then wave (B) ended at 1.6828 with A: 1.7147 (Feb 1997), B: 1.4398 (Sep 2001), C: 1.6828 (Nov 2007), therefore, wave (C) is now in progress with the breakdown indicated as above. This wave (C) already met indicated downside target at 1.1455/60 and 1.1300, it could have ended at 0.8426, consolidation with mild upside bias is seen for gain to 1.1000 and later towards 1.2000.
Bank Of England To Tighten Credit Rules
'Tightening consumer lending will always have an adverse effect on business and British Plc won't be reassured by any of the measures in today's report.' — Angus Dent, ArchOver
The Bank of England Governor Mark Carney held a press conference about the Financial Stability Report in London on Tuesday. Carney said that the Financial Policy Committee would increase the countercyclical capital buffer rate to 0.5% from 0%. Apart from that, the FPC expects to raise the rate to 1% at its November meeting. The Bank acknowledged the UK'[s economic performance had been markedly stronger than its gloomy predictions. However, the BoE noted that risk levels had been varying from sector to sector and remained quite high in the consumer credit market. Carney said that consumers should carefully identify the rationale for purchasing property or investing in a business. Starting from July, the BoE will start tightening rules on unsecured lending in order to slow lending growth among people who are unable to meet loan obligations. Furthermore, the Bank pointed to the high private-sector borrowing in China, which can potentially cause problems to British banks. Policymakers cited the country's exit from the EU as a risk to the economy, adding that the Bank was preparing for all scenarios post-Brexit.
American Consumer Morale Improves Unexpectedly In June
'Overall, consumers anticipate the economy will continue expanding in the months ahead, but they do not foresee the pace of growth accelerating.' — Lynn Franco, Conference Board
The mood of American shoppers rose unexpectedly this month, hitting a 16-year high. The Conference Board reported on Tuesday that its Consumer Confidence Index climbed to 118.9 in June, up from the preceding month's 117.6 points, while analysts anticipated a slight drop to 116.1 during the reported month. The share of respondents who perceived business conditions as 'good' advanced to 30.8% from the prior month's 29.8%, whereas the share of those who perceived business conditions as 'bad' dropped to 12.7%, down from May's 13.9%. Furthermore, 32.8% of respondents said that jobs were 'plentiful', compared to the previous month's 30%. Meanwhile, 18% said that jobs were 'hard to get', down from the previous month's 18.3%. As to the short-term outlook, the share of those expecting to improve over the next six months fell to 20.4% from 21.5%. Nevertheless, the share of respondents expecting future business conditions to worsen declined to 9.9% in June from 10.3%. Tuesday's data suggested that household consumption growth would likely accelerate in the upcoming months.