Sample Category Title
Trade Idea Update: USD/JPY – Buy at 111.00
USD/JPY - 111.87
Original strategy :
Buy at 111.00, Target: 112.00, Stop: 110.65
Position : -
Target : -
Stop : -
New strategy :
Buy at 111.00, Target: 112.00, Stop: 110.65
Position : -
Target : -
Stop : -
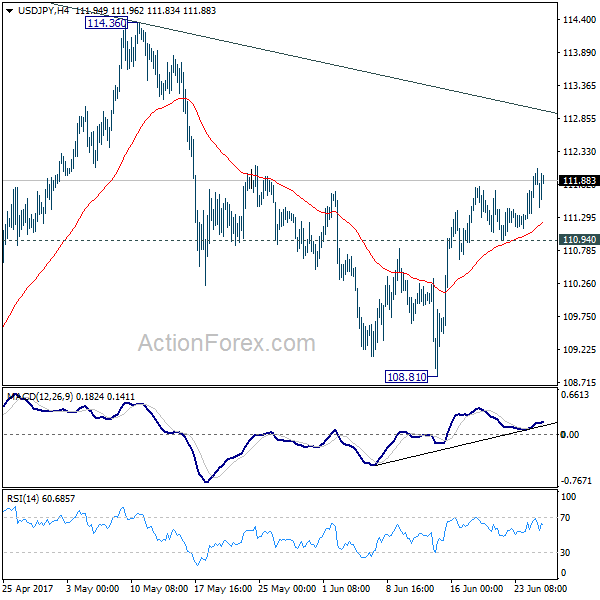
Although the greenback resumed recent upmove and rose to 112.08, the subsequent retreat suggests consolidation below this level would be seen and pullback to 111.35-40 cannot be ruled out, however, support at 110.95 should contain downside and bring another upmove later, break of resistance at 112.08-13 would extend further gain to 112.40-45 (50% projection of 108.82-111.79 measuring from 110.95) but price should falter below 112.75-80 (61.8% projection).
In view of this, would not chase this rise here and we are looking to buy dollar on pullback as support at 110.95 should contain downside. below 110.80 (38.2% Fibonacci retracement of 108.82-111.79 measuring from 10.95) but only break of 110.65 support would confirm top is formed.

USD/JPY Mid-Day Outlook
Daily Pivots: (S1) 111.34; (P) 111.64; (R1) 112.16; More...
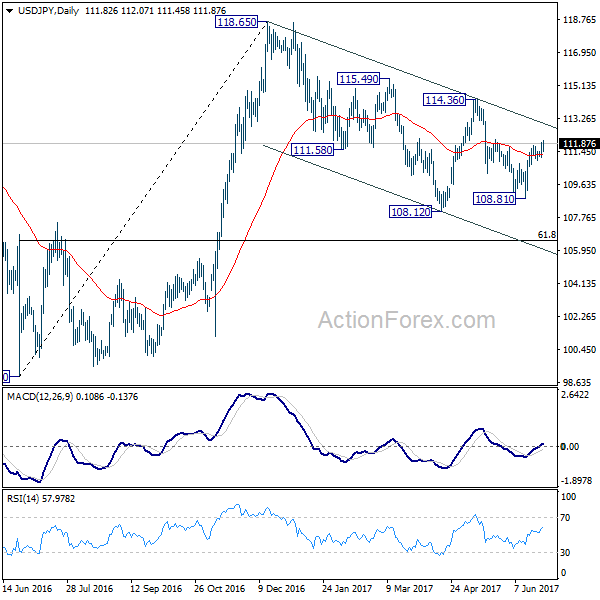
Intraday bias in USD/JPY remains on the upside as rise from 108.81 continues. Further rally would be seen to channel resistance (now at 112.99). Sustained break there will suggest that whole pull back from 118.65 has completed at 108.12 already. In such case, further rise should be seen to 114.36 resistance for confirmation. On the downside, however, break of 110.94 support will argue that rebound from 108.81 has completed and turn bias back to the downside.
In the bigger picture, price actions from 125.85 high are seen as a corrective pattern. It's uncertain whether it's completed yet. But in case of another fall, downside should be contained by 61.8% retracement of 75.56 to 125.85 at 94.77 to bring rebound. Overall, rise from 75.56 is still expected to resume later after the correction from 125.85 completes.
USD/CHF Mid-Day Outlook
Daily Pivots: (S1) 0.9690; (P) 0.9714; (R1) 0.9748; More.....
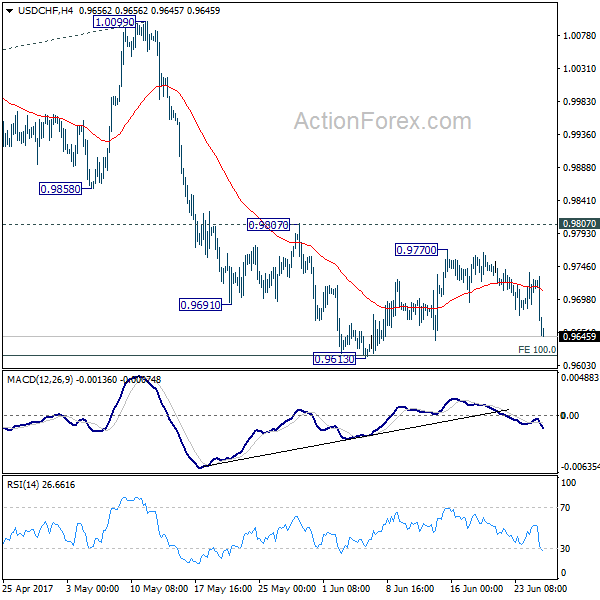
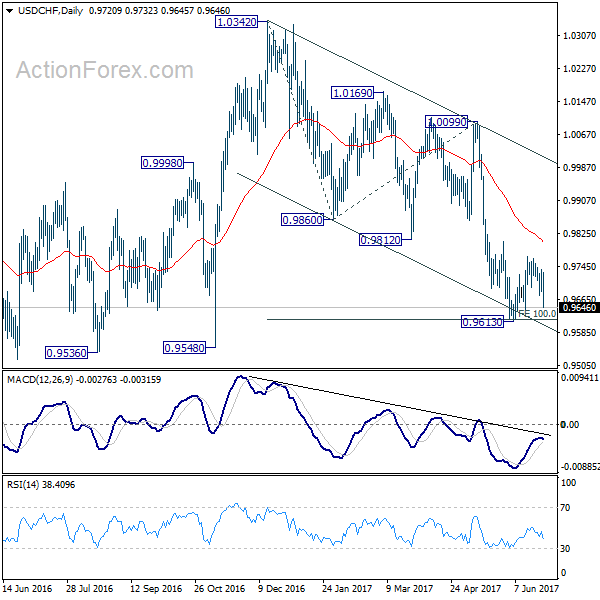
USD/CHF drops sharply today with focus on 0.9613 support. Decisive break there will extend the decline from 1.0342 and target 0.9548 support and below. We'd start to look for bottoming signal again as it approaches 0.9443 key support level. In any case, outlook will remain bearish as long as 0.9807 resistance holds. Firm break of 0.9807, however, will indicate near term reversal and turn outlook bullish for 1.0099 resistance next.
In the bigger picture, USD/CHF is still bounded in medium term range of 0.9443/1.0342 for the moment. Consolidative trading would likely continue and medium term outlook remains neutral. Break of 1.0342 key resistance is needed to confirm underlying bullish momentum in the pair. Meanwhile, downside attempts should be contained by 0.9443 key support level. However, sustained break of 0.9443 will carry larger bearish implication and target 0.9 handle.
GBP/USD Mid-Day Outlook
Daily Pivots: (S1) 1.2698; (P) 1.2728; (R1) 1.2752; More...
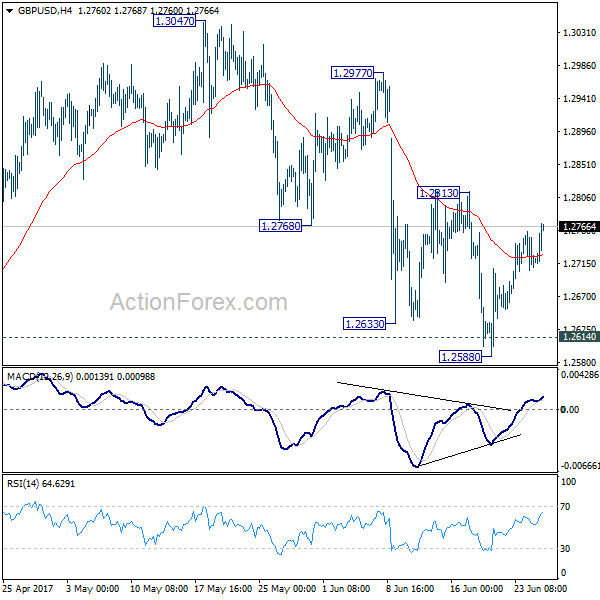
GBP/USD recovers further today but stays in range of 1.2588/2813. Intraday bias remains neutral for the moment. With 1.2813 resistance intact, deeper decline is expected. Sustained break of 1.2614 resistance turned support will confirm our bearish view that consolidation pattern from 1.1946 has completed. In that case, deeper fall should be seen back to retest 1.1946 low. However, break of 1.2813 resistance will dampen our view and turn bias back to the upside for 1.3047 and above.
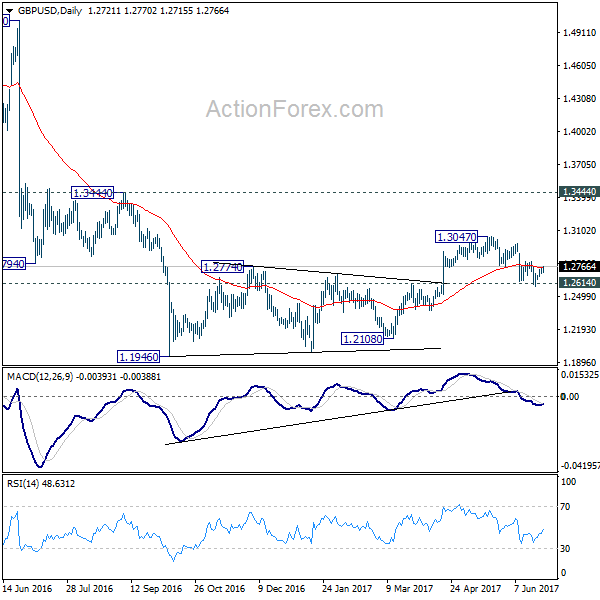
In the bigger picture, fall from 1.7190 is seen as part of the down trend from 2.1161. Price actions from 1.1946 medium term low are seen as a consolidation pattern, which could have completed at 1.3047 after hitting 55 week EMA. Break of 1.1946 low will target 61.8% projection of 1.5016 to 1.1946 from 1.3047 at 1.1150 next. In case the consolidation from 1.1946 extends, outlook will stay remain bearish as long as 1.3444 resistance holds.
EUR/USD Mid-Day Outlook
Daily Pivots: (S1) 1.1162; (P) 1.1190 (R1) 1.1210; More....
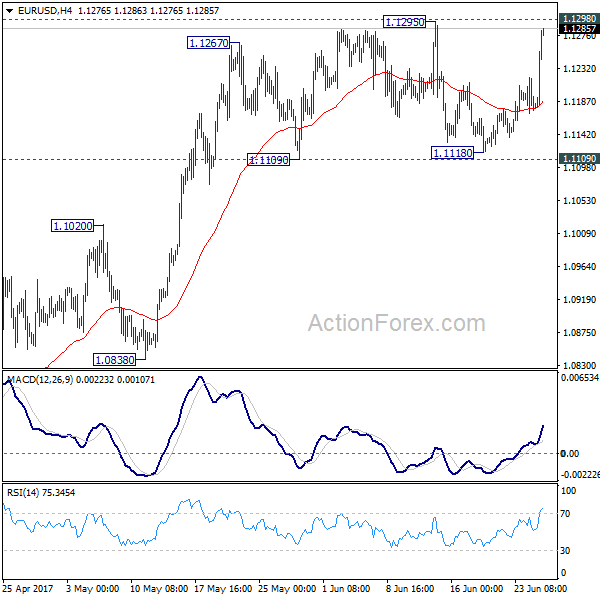
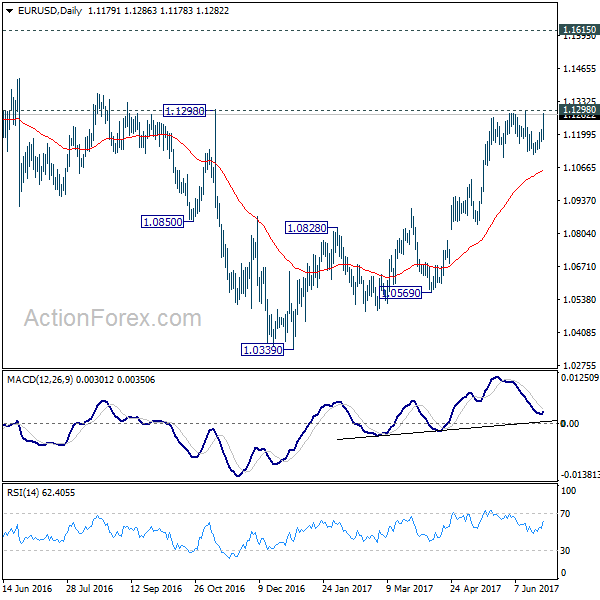
EUR/USD rises sharply today with focus on 1.1298 key resistance. Decisive break there will carry larger bullish implication and extend the up trend from 1.0339 to 1.1615 resistance next. On the downside, break of 1.1109 support will indicate short term topping and rejection from 1.1298. In such case, intraday bias will be turned to the downside for 1.0838 support.
In the bigger picture, the case for medium term reversal continues to build up with EUR/USD staying far above 55 week EMA (now at 1.0941). Also, bullish convergence condition is seen in weekly MACD. Focus will now be on 1.1298 key resistance. Rejection from there will maintain medium term bearishness and would extend the whole down trend from 1.6039 (2008 high). However, firm break of 1.1298 will indicate reversal. In such case, further rally would be seen back to 1.2042 support turned resistance next.
Euro Surges Sharply as Upbeat ECB Draghis Hints Policy Tweaking, EUR/USD to Take on 1.13
Euro surges sharply today on optimistic comments from ECB President Mario Draghi, who also hints at policy tweaks ahead. EUR/USD jumps through 1.28 level and is now having key resistance at 1.1298 in sight. EUR/JPY resumes larger rise from April low at 114.84 and takes out 126.09 key resistance. EUR/GBP is also having focus back on 0.8851/65 key resistance zone and could be resuming larger rise from 0.8312. Meanwhile, Yen remains the weakest one as broad based selloff continues. Strength in Euro is now making dollar vunlerable to downside breakout against Swiss Franc and Canadian Dollar.
Upbeat ECB Draghi hints at policy tweaking
Regarding the economy, Draghi said that "all the signs now point to a strengthening and broadening recovery in the euro area". And, "political winds are becoming tailwinds." He noted there is "newfound confidence in the reform process, and newfound support for European cohesion, which could help unleash pent-up demand and investment." On inflation, Draghi said that drivers of low oil prices at present are mainly supply factors, which a central bank can typically look through. And even if supply factors affect the path of inflation for some time, with inflation expectations secure, they should not ultimately affect the inflation trend." That is, Draghi tried to talk down recent slowing in inflation and believed that's just temporary.
More improtantly, Draghi said that "as the economy continues to recover, a constant policy stance will become more accommodative, and the central bank can accompany the recovery by adjusting the parameters of its policy instruments - not in order to tighten the policy stance, but to keep it broadly unchanged." That is, Draghi is hinting that monetary policy in 2018 will be less accomoodative. And he's paving the way to tweaking policies ahead. It's affirming the view that ECB will annouce scaling back of asset purchase, at least, in September.
BoE requires banks to raise capital requrements on Brexit risks
In UK, BoE told banks to raise capital requirment by GBP 11.4b to protect them from Brexit related economic risks and external shocks. In the Financial Stability Report published today, the central bank said that "the Financial Policy Committee (FPC) is increasing the U.K. countercyclical capital buffer (CCB) rate to 0.5 percent, from 0 percent." And, "absent a material change in the outlook, and consistent with its stated policy for a standard risk environment and of moving gradually, the FPC expects to increase the rate to 1 percent at its November meeting." Re;eased from UK, CBI realized sales rose to 12 in June.
Fed speakers to feature
San Francisco Fed President John Williams spoke again today and urged fiscal policymakers to invest in education, job training, infrastructure and research and development to boost output. He noted that "monetary policy will be severely challenged to achieve stable prices, well-anchored inflation expectations, and strong macroeconomic performance." Meanwhile, he saw tht advanced economist will be stuck in slwo growth over the long term without help from fiscal policies.
More Fed officials will speak today including Fed Chair Janet Yellen, Philadelphia Fed President Patrick Harker, and Minneapolis Fed President Neel Kashkari.
New Zealand trade data positive despite narrowing surplus
New Zealand trade surplus narrowed to NZD 103m in May, down from NZD 536m and missed expectation of NZD 420m. Exports rose 8.7% yoy to NZD 4.95b and hit the highest level since March 2014. Dairy exports continued its strong run and rose for an eighth straight month and led exports overall. Imports jumped 15% yoy to NZD 4.85b, left by 65% increase in crud oil shipments. Economists believed that the robust imports and continued export growth showed underlying strength in the New Zealand economy.
EUR/USD Mid-Day Outlook
Daily Pivots: (S1) 1.1162; (P) 1.1190 (R1) 1.1210; More....
EUR/USD rises sharply today with focus on 1.1298 key resistance. Decisive break there will carry larger bullish implication and extend the up trend from 1.0339 to 1.1615 resistance next. On the downside, break of 1.1109 support will indicate short term topping and rejection from 1.1298. In such case, intraday bias will be turned to the downside for 1.0838 support.
In the bigger picture, the case for medium term reversal continues to build up with EUR/USD staying far above 55 week EMA (now at 1.0941). Also, bullish convergence condition is seen in weekly MACD. Focus will now be on 1.1298 key resistance. Rejection from there will maintain medium term bearishness and would extend the whole down trend from 1.6039 (2008 high). However, firm break of 1.1298 will indicate reversal. In such case, further rally would be seen back to 1.2042 support turned resistance next.
Economic Indicators Update
| GMT | Ccy | Events | Actual | Forecast | Previous | Revised |
|---|---|---|---|---|---|---|
| 22:45 | NZD | Trade Balance (NZD) May | 103M | 420M | 578M | 536M |
| 09:30 | GBP | BoE Financial Stability Report | ||||
| 10:00 | GBP | CBI Realized Sales Jun | 12 | 2 | 2 | |
| 13:00 | USD | S&P/Case-Shiller Composite-20 Y/Y Apr | 5.70% | 5.90% | 5.90% | |
| 14:00 | USD | Consumer Confidence Jun | 116 | 117.9 |
EURUSD: Rallies Strongly on Price Reversal
EURUSD: With the pair seen rallying on Tuesday following its Monday price reversal, more strength is envisaged in the days ahead. Resistance comes in at 1.1300 level with a cut through here opening the door for more upside towards the 1.1350 level. Further up, resistance lies at the 1.1400 level where a break will expose the 1.1450 level. Its daily RSI is bullish and pointing higher suggesting further strength. Conversely, support lies at the 1.1250 level where a violation will aim at the 1.1200 level. A break of here will aim at the 1.1150 level. All in all, EURUSD faces further upside pressure.
Tuesday Dominated by Central Bankers
World stocks were mostly mixed on Tuesday as markets braced for an intense trading session dominated by the financial heavyweights ECB Mario Draghi, BoE Mark Carney and Fed head Janet Yellen all in focus. Asian shares turned in a mixed performance amidst an air of caution while the absence of appetite for risk punished European equities. With jitters over depressed oil prices still weighing on risk sentiment and investors adopting a defensive stance, Wall Street could come under selling pressure this afternoon.
Draghi optimism boosts Euro
Euro Bulls sprinted into action on Tuesday after European Central Bank President Mario Draghi displayed fresh optimism over the health of the European Economy. With "all signs now pointing to a strengthening and broadening recovery in the euro area," expectations are likely to mount over the central bank tapering in the future. Although Draghi still highlighted that despite the impressive growth in the euro area, the inflation dynamics remained muted, this was overshadowed by comments of "deflationary forces being replaced by reflationary ones". While monetary policy may remain accommodative in the short to medium term as the European economy stabilizes, the growing signs that the factors currently hindering inflation are transitory could support speculations of the ECB tapering QE in the longer term.
From a technical standpoint, the EURUSD lurched to its highest level in over a week at 1.1265 following Draghi's upbeat comments with bulls securing control above the 1.1230 resistance. This dynamic resistance could transform into a solid support that supports a further incline towards 1.3000.
BoE Financial Stability Report in focus
Sterling turned erratic on Tuesday with prices violently swinging between losses and gains after the Bank of England stated that there were some areas of risk which required attention in its Financial Stability report. As insurance, capital requirements for UK lenders were increased by £11.4 billion in the event of an economic downturn, while the counter-cycle capital buffer rate was raised to 0.5% from zero. The central bank expects to increase the rate further to 1% in November to cover potential losses if the economy decelerates.
The GBPUSD was searching for direction after the FSR report showed prices still slightly pressured below 1.2775. Technical traders could make use of the 1.2775 resistance level on the GBPUSD to drive the pair lower towards 1.2600.

Will Yellen inspire Bulls again?
The Greenback has found itself under intense selling pressure ahead of an address by Federal Reserve Chair Janet Yellen this evening where she is expected to reiterate her hawkish rhetoric and optimism over the US economy. With Dollar bullish investors lacking the inspiration to support the Greenback amid soft economic data, today may be critical in ensuring that the Dollar Index remains above 96.50. Investors will be waiting to see if Yellen repeats herself in saying that low inflation remains "transitory" while offering further clues on rate hike timings this year. A firmly hawkish Yellen could provide Dollar bulls a lifeline to keep above 96.50 in the short term. On the other hand, if markets still remain unconvinced over the Federal Reserve's ability to raise US rates after Yellen's speech then the Dollar Index is at risk of breaking below 96.50.
GBP/JPY Elliott Wave Analysis
GBP/JPY – 142.70
GBP/JPY – Wave 5 as well as wave (III) has possibly ended at 116.85
Despite retreating to 139.85 last week, sterling found renewed buying interest there and has rebounded again, suggesting near term upside risk remains for the corrective rise from 138.70 low to bring retracement of recent decline from 148.10 top, hence gain to 143.50 and possibly towards resistance at 143.95 cannot be rule out, however, reckon upside would to be limited to 144.90-00 and resistance at 145.40 should remain intact, bring another decline later.
Our preferred count is that larger degree wave V with circle is unfolding from 251.12 with wave (I) 219.34, (II): 241.38 and wave (III) is subdivided into 1: 192.60, 2: 215.89 (23 Jul 2008) and wave 3 ended at 118.87 earlier in 2009. The correction from there to 162.60 is wave 4 which itself is a double three and is labeled as first a-b-c ended at 151.53, followed by wave x at 139.03, 2nd a ended at 162.60, 2nd b at 146.75 and 2nd c leg of wave 4 ended at 163.00. Therefore, the decline from 163.00 to 116.85 is now treated as wave 5 which also marked the end of larger degree wave (III), hence wave (IV) major correction has commenced for retracement of the wave (III) from 241.38 and upside target at 183.95-00 (50% Fibonacci retracement of the wave (II) from 241.38) had been met, a drop below 160.00 would suggest wave (IV) has ended at 195.85, bring decline in wave (V) for initial weakness to 130 (already met) and 120.
On the downside, whilst pullback to 142.00 is likely, reckon downside would be limited to 141.45-50 and support at 140.50 should hold, bring another rebound later. Only a drop below indicated support at 139.85 would revive bearishness and signal the rebound from 138.70 has ended, then further fall to 139.00-10 would follow but said support at 138.70 should hold on first testing. Looking ahead, only break of 138.70 would extend the fall from 148.10 top to 137.50-60, then 136.95-00, however, prevent sharp fall below 136.00-10 should not be repeated and price should stay well above support at 135.60.
Recommendation: Stand aside for this week.
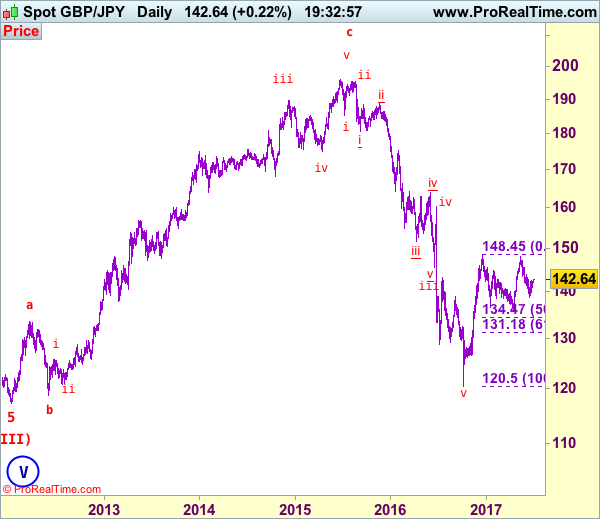
The long-term downtrend from 570.99 (29 Feb 1980) is labeled as an impulsive wave with III with circle ended at 129.77 (20 Apr 1995) and the corrective rebound to 251.12 (20 Jul 2007) is treated as wave IV with circle and the wave V with circle selloff from 251.12 has possibly ended at 116.80 (almost reached our indicated target at 116.00) and major correction has commenced from there and indicated upside target at 183.90-00 (50% Fibonacci retracement of 251.10-116.85) had been met, reckon upside would be limited to 199.80-90 (61.8% Fibonacci retracement) and bring wave (V) decline in later part of 2017.

GBP/USD Elliott Wave Analysis
GBP/USD – 1.2759
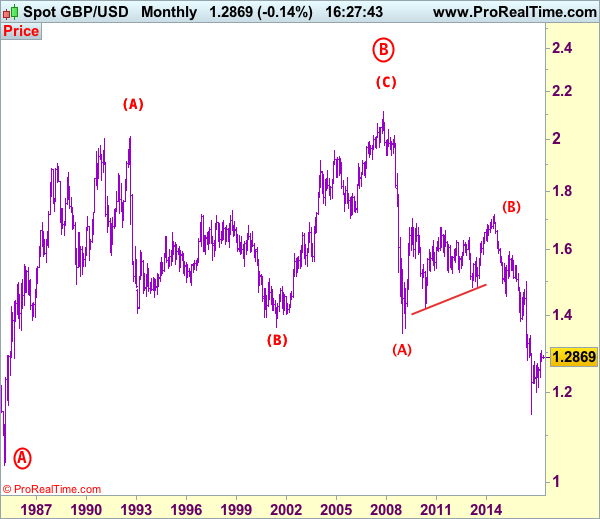
GBP/USD – Wave 4 is unfolding as an (A)-(B)-(C) and could have ended at 1.7192
Although cable did resume recent decline and fell to as low as 1.2589, the subsequent rebound has deferred our bearishness and further consolidation above said support would be seen, however, as long as resistance at 1.2818 holds, bearishness remains for the fall from 1.3048 top to resume after initial sideways trading, below 1.2650-55 would signal the rebound from 1.2589 has ended, bring retest of this level. Once this support is penetrated, this would extend the aforesaid fall for retracement of recent upmove to 1.2550, having said that, reckon downside would be limited to 1.2500 and price should stay above 1.2440-50.
Our preferred count on the daily chart is that cable's rebound from 1.3500 (wave (A) trough) is unfolding as a wave (B) with A ended at 1.7043, followed by triangle wave B and wave C as well as wave (B) has possibly ended at 1.7192, below support at 1.4232 would add credence to this count, then further fall to 1.4000 level would follow but reckon downside would be limited to 1.3655 support and price should stay above previous support at 1.3500.
On the upside, expect recovery to be limited and as long as said resistance at 1.2818 holds, prospect of another decline remains. Above 1.2885-90 would suggest low is possibly formed, bring a stronger rebound towards resistance at 1.2978 which is likely to hold from here. Looking ahead, only a break above 1.2978 would signal the correction from 1.3048 top has ended, bring retest of tis level later. A break above there would extend recent upmove from 1.1986 low to 1.3140-50 (38.2% Fibonacci retracement of 1.5018-1.1986) and possibly 1.3200.
Recommendation: Hold short entered at 1.2800 for 1.2550 with stop above 1.2800.

Longer term - Cable's rise from 1.0520 (Feb 1985) to 2.0100 (September 1992) is seen as [A], the decline to 1.3682 is labeled as (B) and (C) wave rally has ended at 2.1162 (9 Nov, 2007) which is also the top of larger degree wave B with circle. The selloff from there is a 5-waver with wave (A) ended at 1.3500 (23 Jan 2009), wave (B) itself is labeled as A: 1.6733, triangle wave B: 1.4813 and wave C as well as top of wave (B) ended at 1.7192 (2014), hence the selloff from there is an impulsive wave (C) with wave I : 1.4566, wave II 1.5930, an extended wave III is unfolding and already exceeded our downside target at 1.3500 and 1.3000, hence weakness to 1.2500 and possibly 1.2000 cannot be ruled out, however, price should stay well above psychological level at 1.0000.