Sample Category Title
Euro Improves As Draghi Upbeat About Economy
The euro has posted gains in the Tuesday session. EUR/USD is trading at 1.1260, as the pair is up 0.70%. For a second straight day, there are no eurozone releases. Earlier in the day, ECB President Mario Draghi addressed the ECB Forum on Central Banking, and his upbeat comments pushed the euro higher. In the US, today's key event is CB Consumer Confidence, which is expected to dip to 116.1.
ECB President Mario Draghi addressed the ECB Forum on Tuesday, and the markets liked what they were hearing, as the euro has improved to 2-week highs. Draghi acknowledged that economic indicators were showing a broadening recovery in the eurozone, and even had something positive to say about inflation, as he noted that “deflationary forces have been replaced by reflationary ones”. Draghi defended the bank's loose accommodative policy, saying that it had pushed inflation higher, but stimulus was needed until inflation becomes “durable and self-sustaining”. Draghi's message to the markets and his critics is that “we're on the right path, but please show some patience”. Germany, the eurozone's largest economy, wants to see a tighter policy, which is a better fit for the robust economy. Clearly however, the ECB under Draghi's stewardship has no intentions of altering current policy until inflation moves closer to the ECB's target of 2 percent.
The German economy is firing on all four cylinders, and the business sector remains optimistic, according to a key survey released on Monday. Ifo Business Climate hit a record high in June, climbing to 115.1. The indicator has improved for five consecutive months as optimism in the business sector continues to rise. Ifo chief Clemens Fuest said that the German business sector was in a “jubilant” mood, and said that he expected business conditions to continue to improve. Major economic institutes and the German central bank have revised upwards their forecast for German growth in 2017 and 2018. German GDP grew 0.6% in the first quarter, and the German locomotive has boosted growth in the eurozone. Analysts are closely monitoring how the ECB plans to respond to stronger economic conditions in the euro-area. So far, the central bank has dismissed calls to tighten monetary policy.
GOLD Ready For Pushing Higher, SILVER Ready For Another Leg Lower, CRUDE OIL Short-Squeeze.
GOLD Ready for pushing higher.
Gold's medium-term momentum is positive. Hourly support is located at 1236 (26/06/2017 low). Stronger support is given at 1214 (09/05/2017 low). Expected to show short-term upside pressures.
In the long-term, the technical structure suggests that there is a growing upside momentum. A break of 1392 (17/03/2014) is necessary ton confirm it, A major support can be found at 1045 (05/02/2010 low).
SILVER Ready for another leg lower.
Silver's selling pressures are strong despite ongoing bullish consolidation. Closest support is given at 16.36 (21/06/2017 low). Strong support is given at 16.06 (09/05/2017 low). Key resistance is given at a distance at 19.00 (09/11/2017 high). The road seems wide open for further decline.
In the long-term, the death cross indicates that further downsides are very likely. Resistance is located at 25.11 (28/08/2013 high). Strong support can be found at 11.75 (20/04/2009).
CRUDE OIL Short-squeeze.
Crude Oil is now consolidating higher since the commodity hit 11-month low. Support is given at 42.05 (21/06/2017 low). Expected to show renewed weakness.
In the long-term, crude oil has recovered after its sharp decline last year. However, we consider that further weakness are very likely. Strong support lies at 35.24 (05/04/2016) while resistance can now be found at 55.24 (03/01/2017 high).
Forex Technical Analysis: EUR/USD, USD/JPY, GBP/USD
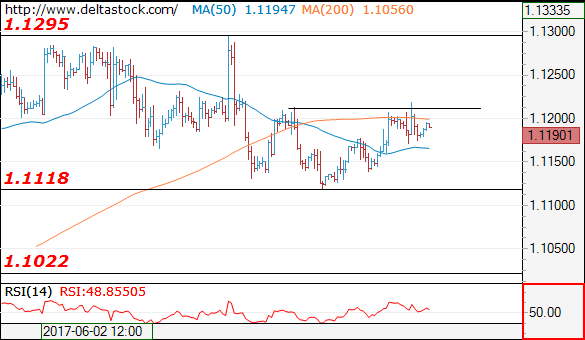
EUR/USD
Current level - 1.1190
There is no sign of a reversal yest and the bias is positive, with a risk of an upswing towards 1.1250 area. Crucial support lies at 1.1175.
| Resistance | Support | ||
| intraday | intraweek | intraday | intraweek |
| 1.1210 | 1.1360 | 1.1175 | 1.1020 |
| 1.1295 | 1.1610 | 1.1110 | 1.0838 |
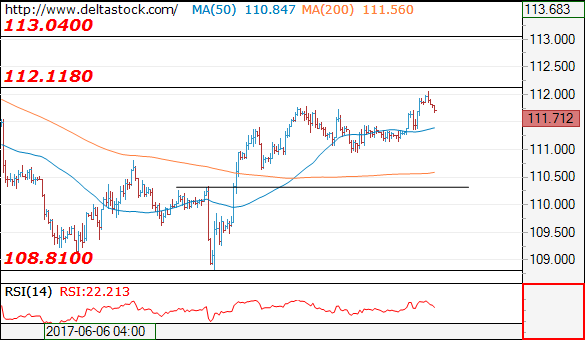
USD/JPY
Current level - 111.71
The recent spike to 112.10 should be followed by a brief corrective leg towards 111.00 area, before continuation of the general upmove towards 113.00 area.
| Resistance | Support | ||
| intraday | intraweek | intraday | intraweek |
| 112.10 | 112.10 | 111.00 | 109.08 |
| 113.00 | 114.30 | 110.30 | 108.12 |
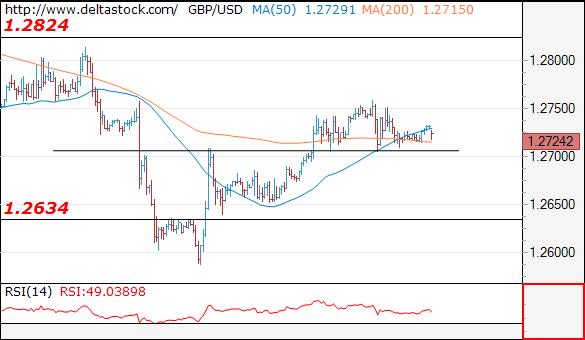
GBP/USD
Current level - 1.2724
The overall outlook remains positive above 1.2700 support area, for a rise towards 1.2825 zone.
| Resistance | Support | ||
| intraday | intraweek | intraday | intraweek |
| 1.2825 | 1.2970 | 1.2700 | 1.2480 |
| 1.2825 | 1.3050 | 1.2634 | 1.2480 |
EUR/JPY Pushing Higher Towards Resistance At 125.82, EUR/GBP Ready To Break Symmetrical Triangle, EUR/CHF Ready To Bounce Back Lower...
EUR/JPY Pushing higher towards resistance at 125.82.
EUR/JPY has bounced back after breaking hourly support given at 122.56 (18/05/2017 low) has been broken. Hourly resistance can be found at 125.82 (16/05/2017 high). Major support is given at 114.90 (18/04/2017 low).
In the longer term, the technical structure validates a medium-term succession of lower highs and lower lows. As a result, the resistance at 149.78 (08/12/2014 high) has likely marked the end of the rise that started in July 2012. Strong support at 94.12 (24/07/2012 low) looks nonetheless far away.
EUR/GBP Ready to break symmetrical triangle.
EUR/GBP is struggling to go any higher. Hourly resistance is given at 0.8866 (12/06/2017 high). Other support can be found at 0.8652 (08/06/2017 low). Expected to break lower symmetrical triangle.
In the long-term, the pair has largely recovered from recent lows in 2015. The technical structure suggests a growing upside momentum. The pair is trading above from its 200 DMA. Strong resistance can be found at 0.9500 psychological level.
EUR/CHF Ready to bounce back lower on downtrend channel.
EUR/CHF's short-term bullish pressures are definitely on. The pair is riding higher within downtrend channel. Expected to show bearish pressures towards strong hourly support that can be found at 1.0792 (03/05/2017 low).
In the longer term, the technical structure is mixed. Resistance can be found at 1.1200 (04/02/2015 high). Yet,the ECB's QE programme is likely to cause persistent selling pressures on the euro, which should weigh on EUR/CHF. Supports can be found at 1.0184 (28/01/2015 low) and 1.0082 (27/01/2015 low).
GBP/USD Candlesticks and Ichimoku Analysis
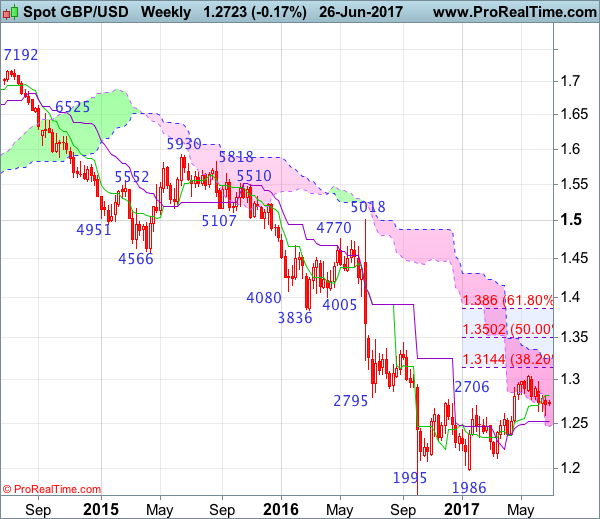
Weekly
• Last Candlesticks pattern: Long white candlestick
• Time of formation: 16 Jan 2017
• Trend bias: Down
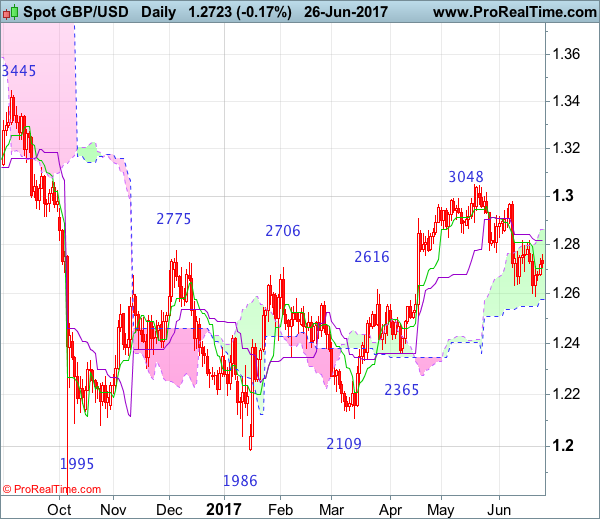
Daily
• Last Candlesticks pattern: Long white candlestick
• Time of formation: 18 Apr 2017
• Trend bias: Near term up
GBP/USD – 1.2750
Although cable resumed recent decline and fell to as low as 1.2589 (our short position entered at 1.2800 met target at 1.2600 with 200 points profit), lack of follow through selling on break of previous support at 1.2635 and the subsequent strong rebound suggest consolidation above this level would be seen and initial recovery to 1.2775-80 and possibly towards the Kijun-Sen (now at 1.2812) cannot be ruled out, however, reckon upside would be limited and 1.2860-65 would hold and price should falter well below 1.2900-10, bring another decline later.
On the downside, expect pullback to be limited to the Tenkan-Sen (now at 1.2702) and bring another rebound. Below 1.2675-80 would bring weakness to 1.2650-55 but said support at 1.2589 should hold from here, bring another rebound later. Only a drop below 1.2589 would signal recent decline from 1.3048 top has resumed and extend weakness to 1.2550, then 1.2500 support, having said that, oversold condition should limit downside to 1.2440-50 and price should stay well above key support at 1.2365, bring rebound later.
Recommendation: Hold short entered at 1.2800 for 1.2600 with stop above 1.2900.
On the weekly chart, despite cable’s anticipated fall to 1.2589 last week, the subsequent bounce from there formed a black candlestick with a long lower shadow, suggesting consolidation above this level would be seen (for 1-2 weeks) and recovery to the Tenkan-Sen (now at 1.2819) cannot be ruled out, however, reckon upside would be limited to 1.2915-20 and price should falter well below resistance at 1.2978, bring another decline later. Looking ahead, only a break of 1.2978 would signal the pullback from 1.3048 has ended instead, bring retest of this recent high, only above there would confirm the erratic upmove from 1.1986 low (2017 low) has resumed for retracement of early decline to 1.3090-00, then towards 1.3140-50 (38.2% Fibonacci retracement of 1.5018-1.1986) but price should falter well below 1.3200-10.
On the downside, whilst pullback to 1.2650-60 cannot be ruled out, price should stay well above said support at 1.2589 and bring another rebound later. Only a break of said support at 1.2589 would signal the fall from 1.3048 top is still in progress for correction of early upnove to 1.2550, however, still reckon downside would be limited and previous support at 1.2515 should remain intact, price should stay well above previous support at 1.2365, bring rebound later.
USD/CHF Short-Term Bearish, USD/CAD Buying Demand Is Fading, AUD/USD Strengthening.
USD/CHF Short-term bearish.
USD/CHF is pushing lower. Hourly resistance can be found at 0.9771 (09/06/2017 high). Strong resistance is given at 1.0107 (10/04/2017 high). Expected to show continued short-term bearish pressures towards 0.9700.
In the long-term, the pair is still trading in range since 2011 despite some turmoil when the SNB unpegged the CHF. Key support can be found 0.8986 (30/01/2015 low). The technical structure favours nonetheless a long term bullish bias since the unpeg in January 2015.
USD/CAD Buying demand is fading.
USD/CAD is in a consolidation phase after the strong decline. Hourly support lies at 1.3165 (14/06/2017 high). Expected to show continued weakness towards support given at 1.3010 (16/02/2017 low).
In the longer term, the pair lies in a bullish channel since a year. Strong resistance is given at 1.4690 (22/01/2016 high). Long-term support can be found at 1.2461 (16/03/2015 low).
AUD/USD Strengthening.
AUD/USD's technical structure is positive since early May. Yet, in the short-term there will likely be renewed bearish pressures towards support given at 0.7520 (09/06/2017 low)
In the long-term, we are waiting for further signs that the current downtrend is ending. Key supports stand at 0.6009 (31/10/2008 low) . A break of the key resistance at 0.8295 (15/01/2015 high) is needed to invalidate our long-term bearish view.
EUR/USD Sideways Price Action, GBP/USD Buying Pressures Are Slowing Down, USD/JPY Monitoring Resistance At 112.13.
EUR/USD Sideways price action.
EUR/USD is trading mixed. The pair is still trading below strong resistance given at 1.1300 (09/11/2017 high). Hourly support can be found at 1.1076 (18/05/2017 low). Stronger support lies at 1.0842 (11/05/2017 low).
In the longer term, the momentum is clearly negative. We favour a continued bearish bias towards parity. Key resistance holds at 1.1714 (24/08/2015 high) while strong support lies at 1.0341 (03/01/2017 low).
GBP/USD Buying pressures are slowing down.
GBP/USD has stopped its rebound. Hourly support is given at 1.2589 (21/06/2017 low). Hourly resistance lies at 1.2818 (14/06/2017 high). Expected to show further renewed selling pressures.
The long-term technical pattern is even more negative since the Brexit vote has paved the way for further decline. Long-term support given at 1.0520 (01/03/85) represents a decent target. Long-term resistance is given at 1.5018 (24/06/2015) and would indicate a long-term reversal in the negative trend. Yet, it is very unlikely at the moment.
USD/JPY Monitoring resistance at 112.13.
USD/JPY has failed to monitor resistance given at 112.13 (24/05/2017 high). Hourly support can be found at 110.65 (16/06/2017 low). Stronger support is located at 108.13 (17/04/2017 low).
We favor a long-term bearish bias. Support is now given at 96.57 (10/08/2013 low). A gradual rise towards the major resistance at 135.15 (01/02/2002 high) seems absolutely unlikely. Expected to decline further support at 93.79 (13/06/2013 low).
Technical Outlook: USDJPY – Monday’s Rally Cracked Daily Cloud But Firm Break Above Is Needed For Stronger Bullish Signal
Strong rally on Monday has fully reversed 111.78/110.94 pullback and managed to close marginally above daily cloud/100SMA barriers. Today's probe above 112.00 handle was so far short-lived, as strong offers lay at this zone. However, current easing is seen as consolidation ahead of fresh attempts higher, as daily MA's in strong bullish setup continue to underpin. Bulls need sustained break and close above daily cloud (which is currently spanned between 111.65 and 111.82) as well as break above 112.24 (Fibo 61.8% of 114.36/108.80) to generate strong bullish signal for resumption of recovery rally from 108.80 (14 June low). Session low/lower 20d Bollinger band at 111.48 marks solid support, guarding a cluster of MA's between 111.17 and 110.70. Speech of Fed's chair Janet Yellen is due later today and will be closely watched for firmer signals of timing of Fed's next rate hike.
Res: 111.82, 112.07, 112.24, 112.40
Sup: 111.48, 111.33, 111.17, 110.91
Elliott Wave Analysis: BTCUSD Trading In A Correction; Downside Can Be Limited
BTCUSD may unfold a more slow and choppy movement in the next couple of trading sessions as we see a corrective phase in action. We see red wave A completed with three waves and also wave B. Current weakness can now be red wave C, that can search for a base around the 1854 level.
BTCUSD, 4H
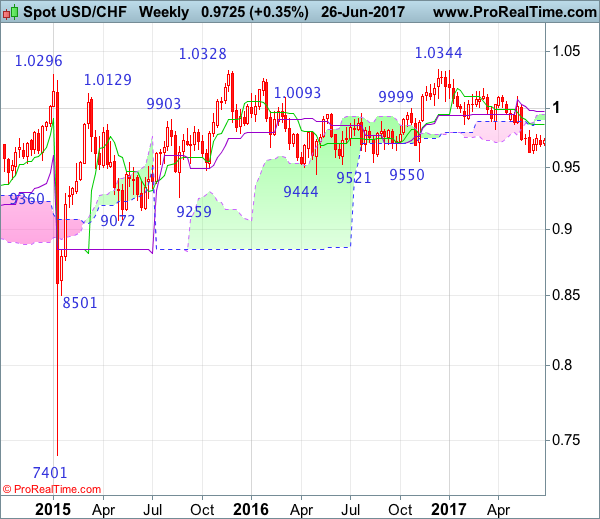
USD/CHF Candlesticks and Ichimoku Analysis
Weekly
• Last Candlesticks pattern: Shooting star
• Time of formation: 7 Mar 2017
• Trend bias: Sideways
Daily
• Last Candlesticks pattern: Morning star
• Time of formation: 9 May 2017
• Trend bias: Near term up
USD/CHF – 0.9700
Although the greenback retreated after meeting resistance at 0.9771 earlier this month, below 0.9641 support is needed to signal the rebound from 0.9613 has ended there, bring retest of this level, break there would confirm recent decline from 1.0344 top (2016 high) has resumed and may extend further weakness to support at 0.9550, then towards psychological support at 0.9500, having said that, near term oversold condition should prevent sharp fall below latter level and risk from there has increased for a rebound later.
On the upside, if said support at 0.9641 continues to hold, then further consolidation would take place and another bounce to 0.9771 cannot be ruled out, however, reckon upside would be limited to indicated resistance at 0.9808, bring another decline. A daily close above 0.9859 (previous support now resistance) would defer and suggest a temporary low has been formed instead, bring a stronger rebound to the lower Kumo (now at 0.9896) and then 0.9950 but price should falter below 1.0000 and bring another selloff.
Recommendation: Sell at 0.9805 for 0.9605 with stop above 0.9905

On the weekly chart, as the greenback has remained under pressure, suggesting bearishness remains for recent decline from 1.0344 to resume after consolidation, expect recovery to be limited to resistance at 0.9808 and the Tenkan-Sen (now at 0.9857) should hold, bring another decline later. Below support at 0.9613 would confirm the aforesaid decline has resumed and may extend weakness for retracement of early upmove towards previous support at 0.9550 but reckon downside would be limited to 0.9500 and another previous support at 0.9444 should remain intact.
On the upside, although initial recovery to 0.9770-75 cannot be ruled out, reckon resistance at 0.9808 would limit upside and bring another decline. A weekly close above the Tenkan-Sen (now at 0.9857) would defer and risk a stronger rebound to 0.9940-50 but 1.0007 (previous resistance) should limit upside and price should falter well below 1.0100, bring another selloff later. Above 1.0100 would signal low is formed instead and suggest the aforesaid decline from 1.0344 has ended, bring test of 1.0171 resistance next.