Sample Category Title
Trade Idea : GBP/USD – Stand aside
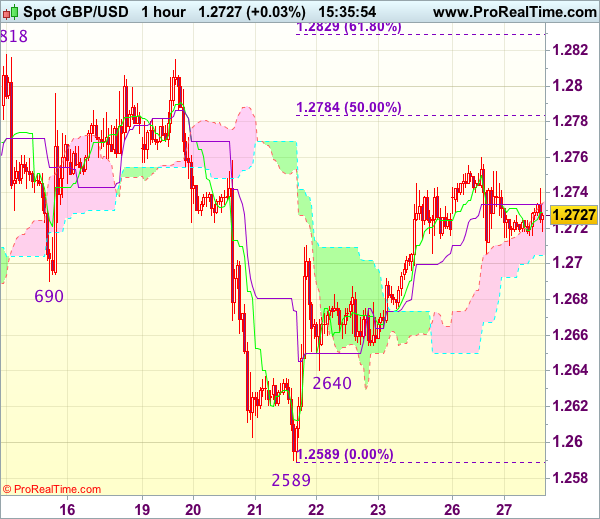
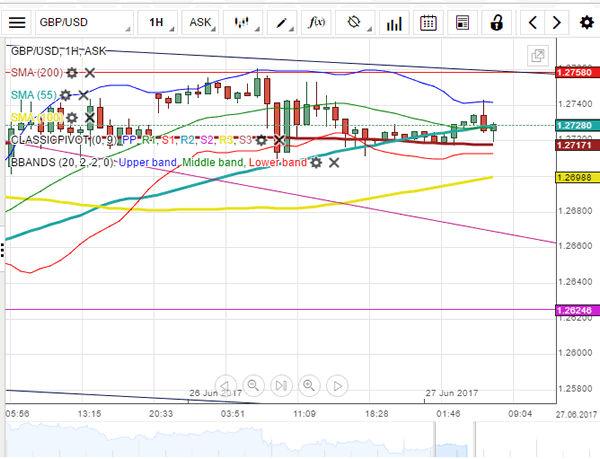
GBP/USD - 1.2730
Most recent candlesticks pattern : N/A
Trend : Near term down
Tenkan-Sen level : 1.2729
Kijun-Sen level : 1.2733
Ichimoku cloud top : 1.2734
Ichimoku cloud bottom : 1.2705
New strategy :
Stand aside
Position : -
Target : -
Stop : -
As cable has retreated after rising to 1.2760, suggesting consolidation below this level would be seen, however, near term upside risk remains for the move from 1.2589 low to bring retracement of recent decline to 1.2780-85 (50% Fibonacci retracement of 1.2978-1.2589) but reckon upside would be limited to 1.2800 and price should falter below resistance at 1.2818, bring another selloff later.
In view of this, would not chase this move here and would be prudent to stand aside for now. Below 1.2700-05 would bring weakness towards 1.2675-80 but break of latter level is needed to signal the rebound from 1.2589 has ended, bring further fall towards support at 1.2640 which is likely to hold on first testing.
EUR/USD Analysis: Continues To Surge
As it was expected the common European currency found support against the US Dollar, and the currency exchange rate continues on its set part higher. Moreover, during Monday's trading the pair managed to touch the 1.1220 mark. The Euro has set its eyes on the 1.1233 mark against the Buck, as that is the closest support level, which is likely to be reached. At that level the weekly R1 is located at. It is most likely that the 55-hour SMA, which helped the rate in its rebound on Monday, will push the pair higher until it reaches the mentioned resistance level. However, the weekly R1 might not be reached during Tuesday's trading, as the upper trend line of the short term ascending channel pattern still remains in the way of the pair above the 1.12 mark.
GBP/USD Analysis: Waits Fundamentals
On Monday, the expected upside potential up to the 1.2770 mark was halted by the monthly S1 at 1.2758 which intersected with the upper channel line. Subsequently, the price dropped down to the weekly PP at 1.2708 in response to fundamentals, but managed to recover some losses, thus returning above the 200-hour SMA. In this trading session, the Pound crossed the 55-hour SMA from below and continued a minor surge up to 1.2740. Technical indicators remain bullish, thus a continuous surge is likely to occur in the upcoming hours, setting either the aforementioned S1 or the 38.2% Fibo at 1.2770 as possible upside targets. In general, the pair is not expected to fall below the 200-hour SMA. Today, the economic calendar is full of important fundamental events, thus the rate should respond accordingly.
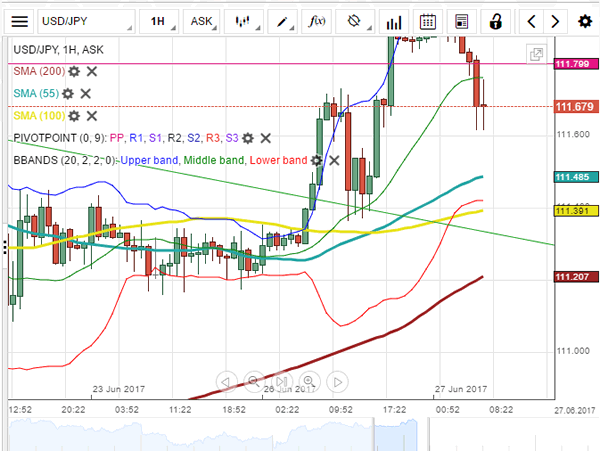
USD/JPY Analysis: Bearish In This Trading Session
Strong upside momentum guided USD/JPY for the whole trading session on Monday prior to reversing to the downside early on Tuesday. The US Dollar returned below the monthly PP at 111.80 and is expected to remain there, as bearish technical indicators suggest the prevalence of downside risks. From technical point of view, the pair broke the descending channel patter; thus a retracement down to the 111.30 mark, approximately, is likely to occur. There, the 200-hour SMA should support the rate, thus limiting further depreciation. The 55– and 100-hour SMAs in the 111.35/45 area may likewise halt the pair. The most important fundamentals scheduled for today are data on consumer confidence at 1400 GMT and Fed Yellen's speech at 17:00 GMT.
Trade Idea : EUR/USD – Stand aside
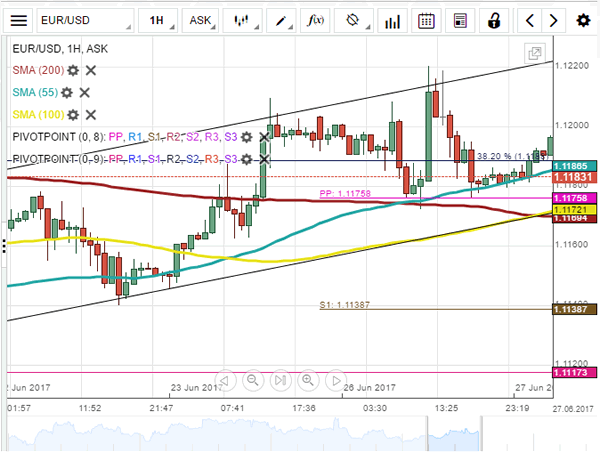
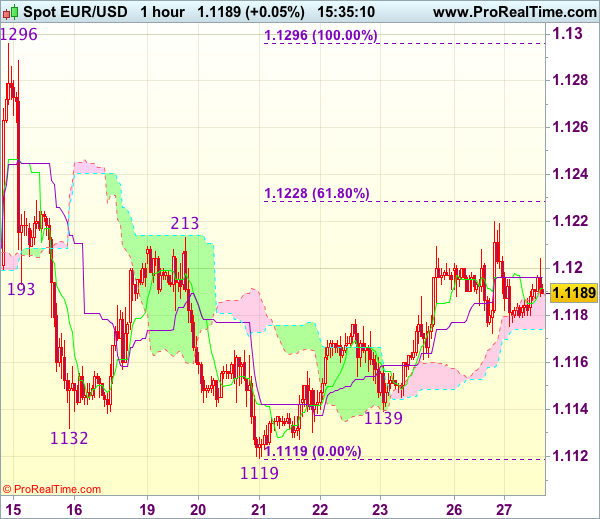
EUR/USD - 1.1185
Most recent candlesticks pattern : N/A
Trend : Near term down
Tenkan-Sen level : 1.1192
Kijun-Sen level : 1.1196
Ichimoku cloud top : 1.1190
Ichimoku cloud bottom : 1.1174
New strategy :
Stand aside
Position : -
Target : -
Stop : -
The single currency met resistance at 1.1220 yesterday and has retreated, suggesting consolidation below this level would be seen and weakness to 1.1160 cannot be ruled out, however, break of indicated support at 1.1139 is needed to signal the rebound from 1.1119 (last week’s low) has ended and bring resumption of recent decline for retest of 1.1119, then towards 1.1095-00.
On the upside, above said resistance at 1.1220 would signal the erratic rise form 1.1119 is still in progress for gain to 1.1228-30 (61.8% Fibonacci retracement of 1.1296-1.1119), however, reckon upside would e limited to 1.1260-70 and price should falter well below resistance at 1.1296, bring retreat later. As near term outlook is mixed, would be prudent to stand aside for now.
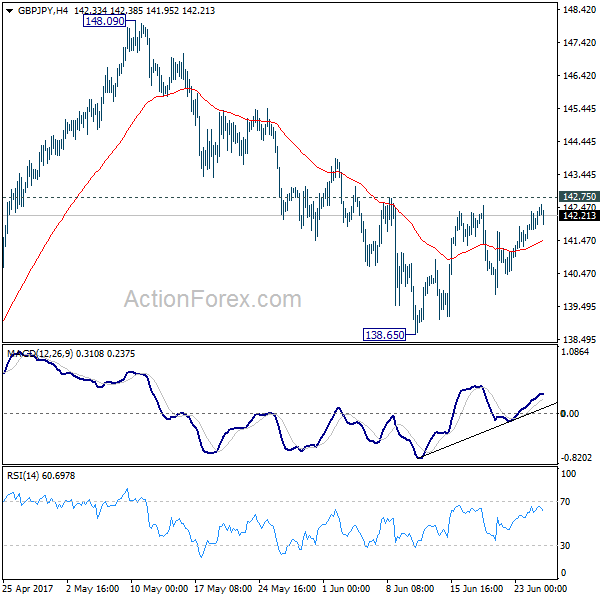
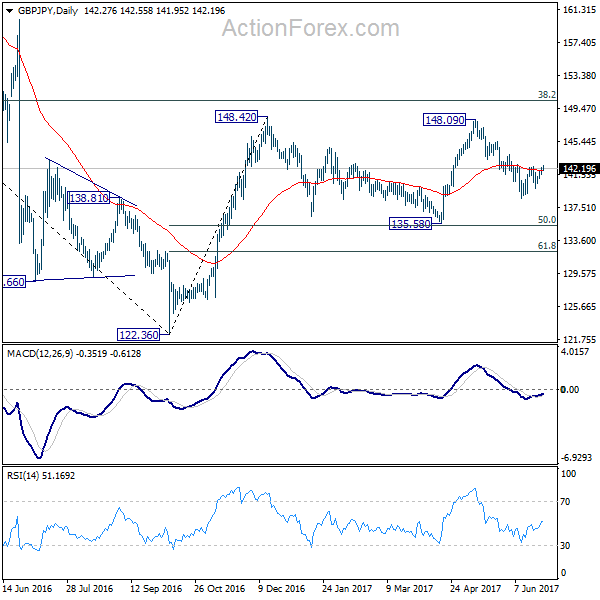
GBP/JPY Daily Outlook
Daily Pivots: (S1) 141.72; (P) 142.04; (R1) 142.61; More....
Intraday bias in GPB/JPY remain neutral for the moment. On the downside, below 138.65 will resume the decline from 148.09. But in that case, we'd look for bottoming signal around 135.58, which is close to 135.39 fibonacci level, to bring rebound. On the upside, break of 142.75 should confirm completion of the fall from 148.09 and turn bias back to the upside for this resistance.
In the bigger picture, while the fall from 148.09 is deeper than expected, we're not bearish in the cross yet. Price action from 148.42 is possibly developing into a sideway pattern with fall from 148.09 as the third leg. Deeper decline could be seen but we're looking for strong support from 135.58 and 50% retracement of 122.36 to 148.42 at 135.39 to contain downside. Rise from 122.36 is still mildly in favor to resume at a later stage. However, sustained break of 135.58/39 will confirm reversal and target a retest on 122.36 low.
Trade Idea : USD/JPY – Buy at 111.00
USD/JPY - 111.72
Most recent candlesticks pattern : N/A
Trend : Near term up
Tenkan-Sen level : 111.85
Kijun-Sen level : 111.69
Ichimoku cloud top : 111.25
Ichimoku cloud bottom : 111.21
Original strategy :
Buy at 110.65, Target: 111.65, Stop: 110.30
Position : -
Target : -
Stop : -
New strategy :
Buy at 111.00, Target: 112.00, Stop: 110.65
Position : -
Target : -
Stop : -
Although the greenback resumed recent upmove and rose to 112.08, current retreat suggests consolidation below this level would be seen and pullback to 111.35-40 cannot be ruled out, however, support at 110.95 should contain downside and bring another upmove later, break of resistance at 112.08-13 would extend further gain to 112.40-45 (50% projection of 108.82-111.79 measuring from 110.95) but price should falter below 112.75-80 (61.8% projection).
In view of this, would not chase this rise here and we are looking to buy dollar on pullback as support at 110.95 should contain downside. below 110.80 (38.2% Fibonacci retracement of 108.82-111.79 measuring from 10.95) but only break of 110.65 support would confirm top is formed.

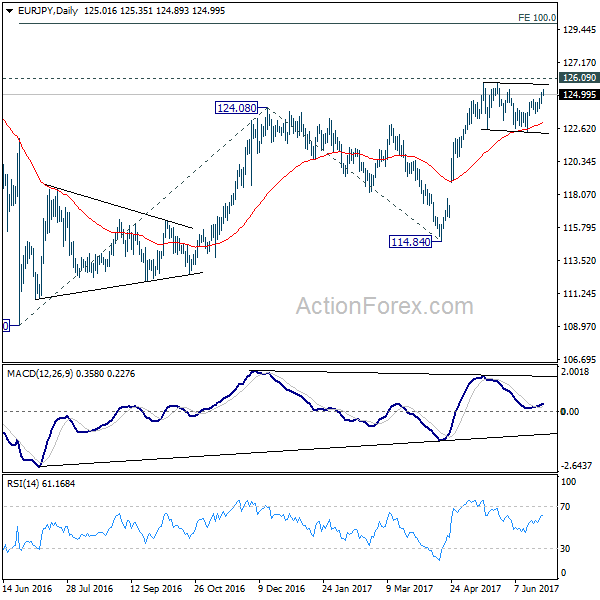
EUR/JPY Daily Outlook
Daily Pivots: (S1) 124.60; (P) 124.87; (R1) 125.34; More...
EUR/JPY's rebound from 122.39 extended further to 125.35 but it's still limited below 125.80/126.09 resistance zone. Intraday bias stays neutral first. On the upside, decisive break of 125.80/126.09 resistance zone will extend the whole rise from 109.03 to 100% projection of 109.03 to 124.08 from 114.84 at 129.89. On the downside, below 123.65 minor support will extend the consolidation from 125.80 with another falling leg. In that case, downside should be contained by 38.2% retracement of 114.84 to 125.80 at 121.61 to bring rebound and then rise resumption.
In the bigger picture, focus is staying on 126.09 support turned resistance. Decisive break there will confirm completion of the down trend from 149.76. And in such case, rise from 109.20 is at the same degree and should target 141.04 resistance and above. Meanwhile, rejection from 126.09 and break of 114.84 will extend the fall from 149.76 through 109.20 low.
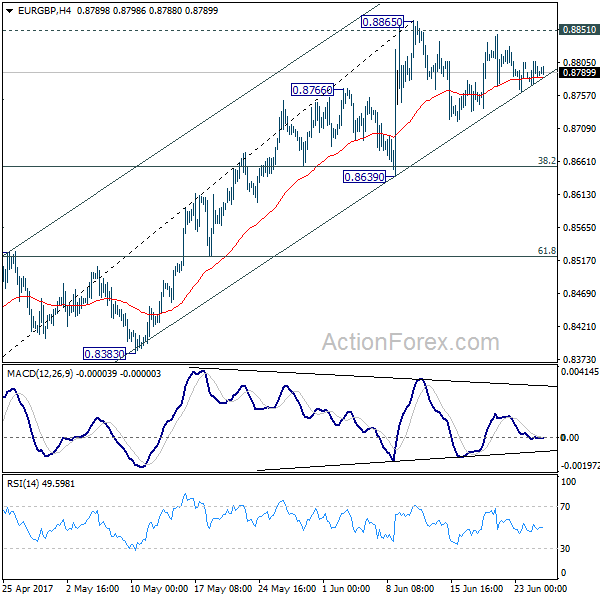
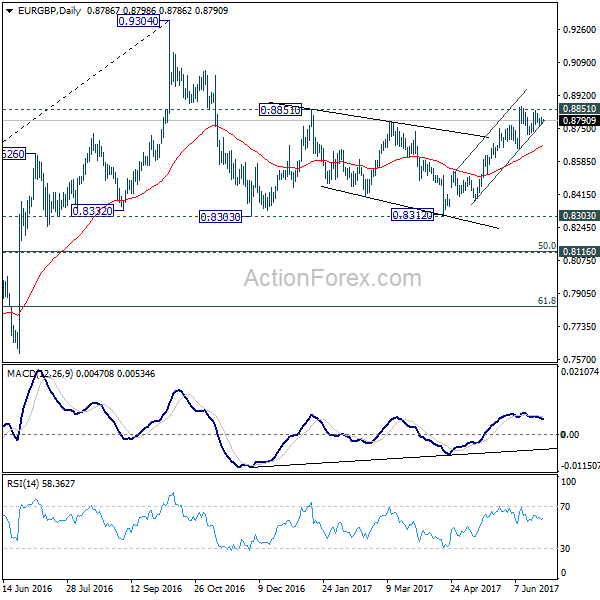
EUR/GBP Daily Outlook
Daily Pivots: (S1) 0.8771; (P) 0.8789; (R1) 0.8806; More...
EUR/GBP is staying in consolidation pattern from 0.8865 and intraday bias remains neutral first. In case of another fall, contained by 0.8639 support to bring rebound. Further rise is expected and decisive of 0.8851 resistance will pave the way to retest 0.9304 high. However, break of 0.8639 support will now indicate near term topping and bring deeper pull back 0.8529 resistance turned support and below.
In the bigger picture, price actions from 0.9304 are viewed as a medium term corrective pattern. The leg from 0.9304 should have completed after testing 0.8332 structural support. But it's too early to say that larger rise from 0.6935 is resuming. Rejection from 0.9304 will extend the consolidation with another falling leg. Meanwhile, firm break of 0.9304 will target 0.9799 (2008 high). In case of another decline, we'd expect strong support from 0.8116 cluster support (50% retracement of 0.6935 to 0.9304 at 0.8120) to contain downside and bring rebound.
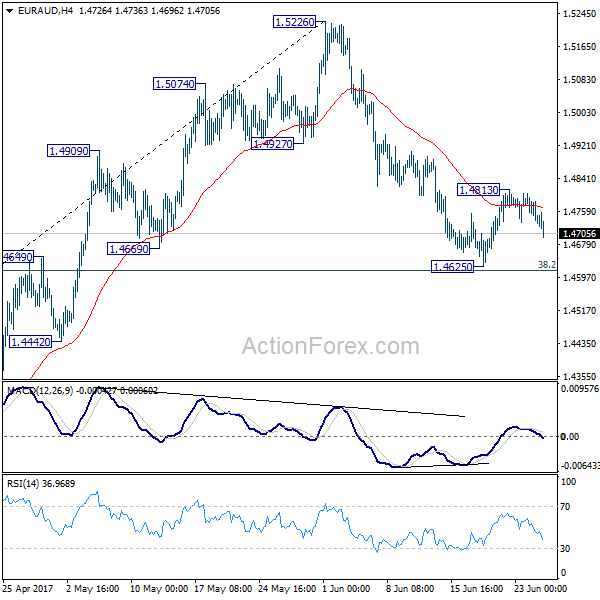
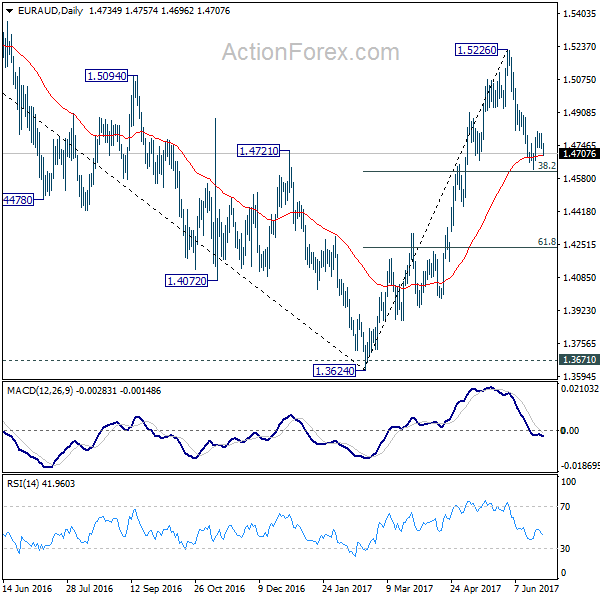
EUR/AUD Daily Outlook
Daily Pivots: (S1) 1.4714; (P) 1.4758; (R1) 1.4785; More...
EUR/AUD failed to sustain above 4 hour 55 EMA and retreated. As it's staying above 1.4625 temporary low, intraday bias remains neutral first. On the upside, above 1.4813 will extend the rebound from 1.4625 to retest 1.5226 high next. However, sustained break of 38.2% retracement of 1.3624 to 1.5226 at 1.4614 will bring deep fall to 61.8% retracement at 1.4236 and possibly below.
In the bigger picture, price actions from 1.6587 medium term top are viewed as a corrective pattern. Such correction should be completed at 1.3624 after defending 1.3671 key support. Rise from 1.3642 would extend to 61.8% retracement of 1.6587 to 1.3624 at 1.5455. Sustained break there will pave the way to retest 1.6587. However, sustained break of 1.4669 support will dampen this bullish view. We'll assess the outlook later after looking at the structure and depth of the pull back.