Sample Category Title
BoE Should Look Beyond Temporary Inflation
- BoE should remain on hold despite inflation rising well beyond target;
- Fed signals another hike this year but markets aren't buying it;
- Strong Australian jobs report aids further gains in AUDUSD.
The UK will be back in focus again on Thursday as the Bank of England announces its latest monetary policy decision, amid all the political chaos following last week's snap election result, and we'll also get retail sales numbers for May.
The timing of the latest monetary policy decision from the BoE couldn't be much worse, as the country prepares to start Brexit negotiations without a stable government following the surprising snap election result. To make matters worse for policy makers, this comes as inflation has hit 2.9%, higher than what it anticipated would be the peak only a month ago.
While policy makers claimed after the last meeting that they would only need little upside news on growth or inflation to consider voting for tighter policy, I would be extremely surprised to see them act at this moment in time. The huge amount of economic uncertainty paired with the temporary drivers of inflation and lower growth prospects is surely a good enough reason to look through the current spike in prices. Should they not look beyond this and even signal a possible hike in the near-term, it would catch markets completely off guard which could provide a significant boost to sterling.
The Federal Reserve finds itself in a far more privileged position, albeit still not an ideal one, with growth prospects much better, the economy in better shape and inflation at a level that allows for tighter policy without necessitating the need for it. The FOMC raised interest rates for a second time this year on Wednesday – as was fully expected and priced in – and signalled an intention to do so again this year while laying out plans to begin reducing the size of its balance sheet.
Traders appear unconvinced by the possibility of another rate hike this year, despite what the Fed indicated, with the implied probability of one by December standing at below 50%. Investors appear concerned about the slowing pace of inflation but this doesn't seem to bother policy makers, who revised down their projection for this year to 1.6%, from 1.9% previously, while maintaining their forecasts of 2% for 2018 and 2019.
A strong jobs report boosted the Australian dollar overnight, as stronger gains in employment – boosted entirely by full time roles – brought the unemployment rate back to a four year low, while participation rose to its highest in almost a year.
Still to come today there's plenty of economic data being released, including retail sales from the UK, which are expected to have softened again in May following the Easter holiday driven spike in April. We'll also get plenty of numbers from the US this afternoon including jobless claims, Philly Fed manufacturing index and industrial production.
Daily Technical Analysis: EUR/USD Challenges 1.13 But Reverses With US Rate Hike
Currency pair EUR/USD
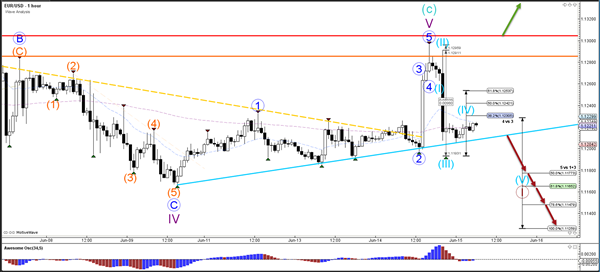
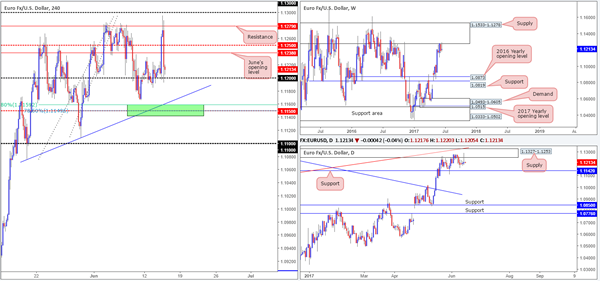
The EUR/USD challenged the key 1.13 resistance zone (red line) after weak inflation figures in the US were released yesterday. Despite the recent weakness in inflation levels, the US interest rates did increase from 1% to 1.25% later in the day which sparked a renewed US Dollar rally and hence a decline in the EUR/USD.
The EUR/USD is currently caught in between strong support and resistance and would need to break (arrows) these levels before a potential trend could start.
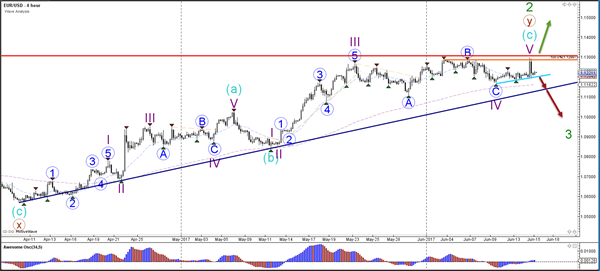
The EUR/USD wave 4 (blue) becomes unlikely if price manages to break above the 61.8% Fib level.
Currency pair GBP/USD
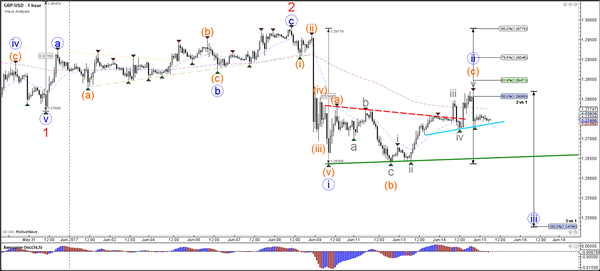
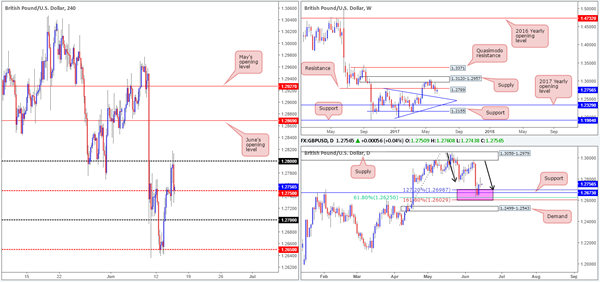
The GBP/USD has retraced to the 50% Fibonacci level of wave 2 (blue) via an ABC zigzag (orange). A bearish breakout (red arrows) could confirm wave 3 (red). The GBP/USD wave 2 is invalidated if price breaks (green arrows) above the 100% Fibonacci level.
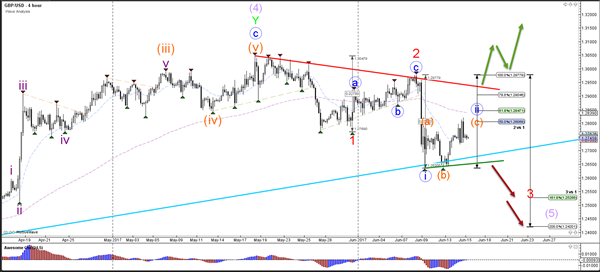
The GBP/USD needs to break below support (blue/green) to confirm a potential wave 3 (blue). The Fibonacci levels of wave 2 (blue) could act as resistance.
Currency pair USD/JPY
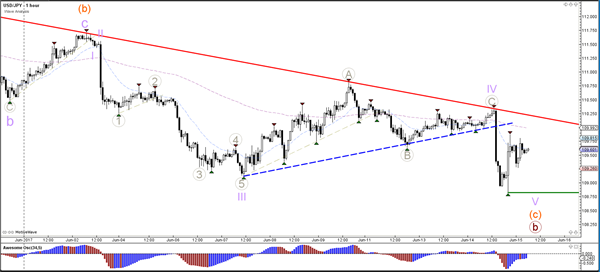
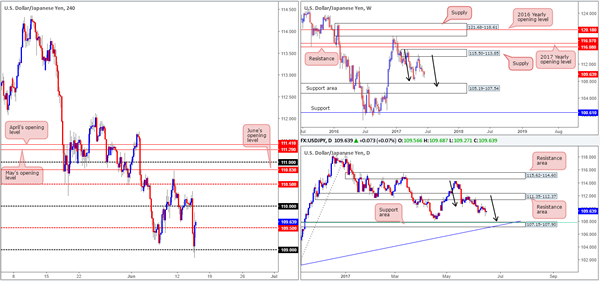
The USD/JPY broke the support trend line (dotted blue) which has reopened the correction within wave B (brown). Price has reached the 88.6% Fibonacci level which is the last Fibonacci level of this wave B and a major bounce (green arrows) or break (red arrows) zone.
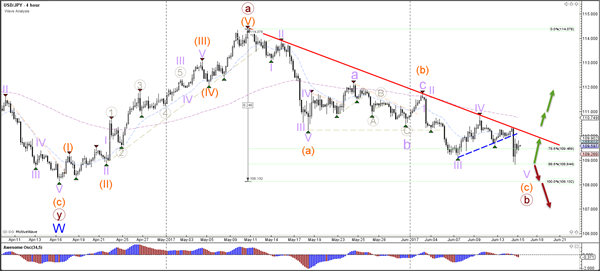
The USD/JPY needs to break above resistance (red) for a potential bullish trend or break below support (green) for a potential bearish trend.
Australian Unemployment Rate Hits Lowest Level Since 2013 In May
For the 24 hours to 23:00 GMT, the AUD rose 0.74% against the USD and closed at 0.7592.
LME Copper prices rose 0.5% or $25.5/MT to $5684.5/MT. Aluminium prices rose 0.5% or $9.5/MT to $1886.5/MT.
In the Asian session, at GMT0300, the pair is trading at 0.7613, with the AUD trading 0.28% higher against the USD from yesterday's close, following an upbeat Australian jobs report.
Early morning data showed that Australia's seasonally adjusted unemployment rate unexpectedly eased to 5.5% in May, dropping to its lowest level in four years, driven by a rebound in fulltime positions. Markets expected unemployment rate to remain steady at 5.7%. Additionally, the number of people employed climbed by 42.0K in May, following a revised gain of 46.1K in the prior month, whereas investors had envisaged for a rise of 10.0K.
On the other hand, the nation's consumer inflation expectations dropped to 3.6% in June, compared to a reading of 4.0% in the previous month.
The pair is expected to find support at 0.7552, and a fall through could take it to the next support level of 0.7491. The pair is expected to find its first resistance at 0.7655, and a rise through could take it to the next resistance level of 0.7697.
The currency pair is trading above its 20 Hr and 50 Hr moving averages.

Euro-Zone’s Industrial Output Rose For The Second Consecutive Month In April
For the 24 hours to 23:00 GMT, the EUR slightly rose against the USD and closed at 1.1212.
On the macro front, the Euro-zone's seasonally adjusted industrial production advanced for the second straight month, after it rose 0.5% on a monthly basis in April, meeting market expectations and following a revised gain of 0.2% in the previous month.
Separately, Germany's final consumer price index (CPI) climbed 1.5% YoY in May, rising at its weakest pace in six months and confirming the flash estimate. The CPI had advanced 2.0% in the prior month.
The US Dollar clawed back some of its losses against a basket of currencies, after the Federal Reserve (Fed) raised interest rates for the second time this year and painted a rosier picture of the US economy.
The Fed, at its latest monetary policy meeting, raised its benchmark interest rate by a quarter percentage point to a target range of 1.00% to 1.25%, citing continued US economic growth and job market strength. Additionally, it indicated plans to pare back its $4.5 trillion balance sheet this year if the economy evolves as the central bank expects. In a post-meeting statement, the Fed judged that the recent weakness in economic data is temporary and maintained the outlook for one more rate hike this year but did not shed light on the timing of the rate hike.
Meanwhile, in its latest quarterly economic forecasts report, the central bank stuck to its outlook of three interest rate hikes in 2018. Moreover, policymakers slightly raised their economic growth forecast for this year to 2.1% but kept the estimates for 2018 and 2019 unchanged at 2.1% and 1.9% respectively. Inflation is expected to be at 1.7% by the end of this year, down from the 1.9% previously forecast.
Prior to the Fed interest rate decision, the greenback declined against its major peers, after the US inflation and retail sales data surprised with an unexpected drop.
The US CPI unexpectedly eased 0.1% on a monthly basis in May, suggesting that inflationary pressures in the world's largest economy are moderating. The CPI had registered a rise of 0.2% in the prior month, while markets expected it to record a flat reading. Further, the nation's advance retail sales surprisingly declined 0.3% MoM in May, defying market consensus for a flat reading. Advance retail sales had recorded a rise of 0.4% in the previous month. Further, the nation's business inventories fell 0.2% in April, at par with market expectations. In the previous month, business inventories had advanced 0.2%.
In the Asian session, at GMT0300, the pair is trading at 1.1218, with the EUR trading marginally higher against the USD from yesterday's close.
The pair is expected to find support at 1.1175, and a fall through could take it to the next support level of 1.1133. The pair is expected to find its first resistance at 1.1278, and a rise through could take it to the next resistance level of 1.1339.
Going ahead, market participants will keep a close watch on the Euro-zone's trade balance for April, slated to release in a few hours. Moreover, the US initial jobless claims, industrial as well as manufacturing production for May and NAHB housing market index for June, set to release later in the day, will keep investors on their toes.
The currency pair is trading below its 20 Hr moving average and showing convergence with its 50 Hr moving average.

UK’s ILO Unemployment Rate Remained Steady At A 42-Year Low Level In The Three Months Through April
For the 24 hours to 23:00 GMT, the GBP rose 0.06% against the USD and closed at 1.2760, after UK's ILO unemployment rate remained steady at a 42-year low level of 4.6% in the three months ended April, meeting market expectations. However, the nation's average earnings including bonus advanced less-than-expected by 2.1% on an annual basis in the February-April 2017 period, rising at its slowest pace since February 2016, intensifying concerns about the outlook for consumers as inflation accelerates to a four-year high level. Markets anticipated average earnings to gain 2.4%, following a revised rise of 2.3% in the January-March 2017 period.
In the Asian session, at GMT0300, the pair is trading at 1.2747, with the GBP trading 0.1% lower against the USD from yesterday's close.
The pair is expected to find support at 1.2708, and a fall through could take it to the next support level of 1.2669. The pair is expected to find its first resistance at 1.2802, and a rise through could take it to the next resistance level of 1.2857.
Looking ahead, the Bank of England's (BoE) interest rate decision, due in a few hours, would possibly remain a low-key affair as the central bank is unlikely to be hawkish amid heightened political and economic uncertainty.
The currency pair is trading below its 20 Hr moving average and showing convergence with its 50 Hr moving average.

Japanese Yen Trading Lower In The Asian Session
For the 24 hours to 23:00 GMT, the USD declined 0.65% against the JPY and closed at 109.35.
In the Asian session, at GMT0300, the pair is trading at 109.56, with the USD trading 0.19% higher against the JPY from yesterday’s close.
The pair is expected to find support at 108.81, and a fall through could take it to the next support level of 108.07. The pair is expected to find its first resistance at 110.32, and a rise through could take it to the next resistance level of 111.09.
Moving ahead, traders would anxiously await the Bank of Japan’s (BoJ) monetary policy decision, scheduled tomorrow.
The currency pair is showing convergence with its 20 Hr moving average and trading below its 50 Hr moving average.

Swiss Franc Trading A Tad Higher, Ahead Of SNB’s Interest Rate Decision
For the 24 hours to 23:00 GMT, the USD rose 0.26% against the CHF and closed at 0.9713.
In the Asian session, at GMT0300, the pair is trading at 0.9712, with the USD trading slightly lower against the CHF from yesterday's close.
The pair is expected to find support at 0.9657, and a fall through could take it to the next support level of 0.9601. The pair is expected to find its first resistance at 0.9752, and a rise through could take it to the next resistance level of 0.9791.
Ahead in the day, investors will await the announcement of Swiss National Bank's (SNB) interest rate decision.
The currency pair is trading above its 20 Hr and 50 Hr moving averages.

Loonie Trading Lower, Ahead Of Canada’s Existing Home Sales Data
For the 24 hours to 23:00 GMT, the USD traded flat against the CAD and closed at 1.3235.
On the data front, Canada's Teranet/National Bank house price index recorded a rise of 2.2% MoM in May. In the prior month, the index had climbed 1.2%.
In the Asian session, at GMT0300, the pair is trading at 1.3244, with the USD trading 0.07% higher against the CAD from yesterday's close.
The pair is expected to find support at 1.3182, and a fall through could take it to the next support level of 1.3121. The pair is expected to find its first resistance at 1.3288, and a rise through could take it to the next resistance level of 1.3333.
Looking ahead, Canada's existing home sales data for May, slated to release later in the day, will be on investors' radar.
The currency pair is trading above its 20 Hr moving average and showing convergence with its 50 Hr moving average.

Daily Technical Outlook And Review: EUR/USD, GBP/USD, AUD/USD, USD/JPY, USD/CAD, USD/CHF, DOW 30, GOLD
A note on lower timeframe confirming price action...
Waiting for lower timeframe confirmation is our main tool to confirm strength within higher timeframe zones, and has really been the key to our trading success. It takes a little time to understand the subtle nuances, however, as each trade is never the same, but once you master the rhythm so to speak, you will be saved from countless unnecessary losing trades. The following is a list of what we look for:
- A break/retest of supply or demand dependent on which way you're trading.
- A trendline break/retest.
- Buying/selling tails ... essentially we look for a cluster of very obvious spikes off of lower timeframe support and resistance levels within the higher timeframe zone.
- Candlestick patterns. We tend to only stick with pin bars and engulfing bars as these have proven to be the most effective.
We typically search for lower-timeframe confirmation between the M15 and H1 timeframes, since most of our higher-timeframe areas begin with the H4. Stops are usually placed 1-3 pips beyond confirming structures.
EUR/USD
Following disappointing US inflation and retail sales data on Wednesday, the EUR/USD surged north from the 1.12 handle and topped just ahead of the 1.13 line. It was from this point that we saw the pair give back all of its daily gains as the FOMC decided to increase its benchmark rate by 25bps, consequently bringing price back down to the 1.12 handle going into the closing bell. Despite the gyrations seen during yesterday's segment, the unit, once again, found support off 1.12. With that in mind, much of the following report will echo similar thoughts put forward in Wednesday's analysis…
Directly overhead on the H4 chart we have June's opening level at 1.1238, followed closely by the mid-level resistance at 1.1250. Below 1.12, there's little support seen until price connects with the mid-level barrier at 1.1150.
A quick look at the weekly chart shows that the single currency remains trading around the underside of a major supply at 1.1533-1.1278. Managing to cap upside since May 2015, this is not an area one should overlook. Looking down to the daily timeframe, however, the candles are now seen sandwiched between supply coming in at 1.1327-1.1253 and support pegged at 1.1142.
Our suggestions: Based on the above notes our desk has shown interest around the 1.1150 neighborhood, due to the base converging with the following structures (green area):
- A H4 trendline support etched from the low 1.1075.
- A H4 61.8% Fib support at 1.1159 drawn from the low 1.1074.
- A H4 78.6% retracement level pegged at 1.1149 penciled in from the low 1.1109.
- A daily support level seen at 1.1142.
Seeing as how this zone is rather small, we will not be placing pending buy orders here. Instead, we've chosen to wait for a reasonably sized H4 bull candle to form, preferably a full-bodied candle. This will help prove buyer interest exists here which IS necessary due to where price is trading from on the weekly chart right now.
Data points to consider: US Weekly unemployment claims and the Empire state manufacturing index figures at 1.30pm, US Industrial production and Capacity utilization rate at 2.15pm GMT+1.
Levels to watch/live orders:
- Buys: 1.1150 region ([waiting for a reasonably sized H4 bull candle – preferably a full-bodied candle – to form before pulling the trigger is advised] stop loss: ideally beyond the candle's tail).
- Sells: Flat (stop loss: N/A).
GBP/USD
As expected, the GBP/USD took a similar path to the EUR/USD yesterday. Bouncing higher following dismal US inflation and retail sales data, the pair was able to connect with the 1.28 handle. Of course, this is not your average round number here, since it's positioned nearby weekly resistance pegged at 1.2789.
The pair, as you can see, turned lower from 1.28 and headed back down to the H4 mid-level support 1.2750 into the close, as the Fed, as anticipated, hiked its benchmark rate by 25bps.
If you take a quick look at the daily chart, however, the bulls bounced nicely from 1.2602/1.2698 (a daily zone marked in pink) on Tuesday. Comprised of a support level coming in at 1.2673, a 61.8% Fib support at 1.2625 (taken from the low 1.2365) and an AB=CD (black arrows) 127.2/161.8% ext. completion point seen at 1.2602/1.2698 (drawn from the high 1.3047),making this is a rather attractive buy zone!
Our suggestions: A difference of opinion is currently being seen on the higher timeframes. Judging direction can be tricky in situations like this. Therefore, we'll remain on the sidelines and wait for further developments before making any further decisions.
Data points to consider: UK Retail sales at 9.30am, MPC monetary policy summary at 12pm, BoE Gov. Carney speaks at 9pm. US Weekly unemployment claims and the Empire state manufacturing index figures at 1.30pm, US Industrial production and Capacity utilization rate at 2.15pm GMT+1.
Levels to watch/live orders:
- Buys: Flat (stop loss: N/A).
- Sells: Flat (stop loss: N/A).
AUD/USD
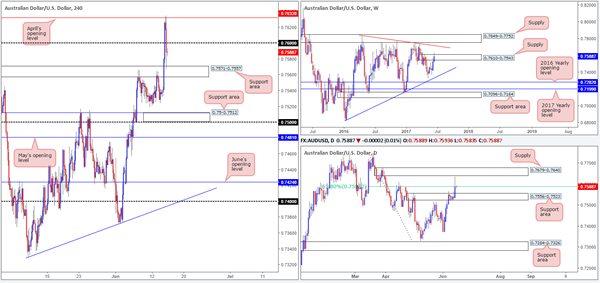
April's opening level at 0.7632 elbowed its way into the spotlight yesterday, following lower-than-expected US inflation and retail sales data. Thanks largely to the Fed increasing its benchmark rate by 25bps, 0.7632 held steady, forcing the commodity currency back below the 0.76 handle, and into a H4 support area at 0.7571-0.7557 by the day's end.
Wednesday's advance also saw weekly action pierce above supply coming in at 0.7610-0.7543, likely filling a huge amount of buy stops in the process. Looking down to the daily candles, nonetheless, the candle managed to hold below the 61.8% Fib resistance at 0.7588 taken from the high 0.7747, despite chalking in an aggressive whipsaw wick that almost tagged the underside of supply seen at 0.7679-0.7640. Traders may have also noticed that directly below the Fib level sits a daily support area coming in at 0.7556-0.7523.
Our suggestions: Given the H4 candles are now sandwiched between the aforementioned H4 support area and the 0.76 handle, movement is somewhat restricted for the time being. In addition to this, we're not too impressed with the structure seen on the higher timeframes at the moment. This – coupled with Aussie employment figures scheduled to be released in the next hour, we will humbly take a back seat today and look to reassess the market going into tomorrow's open.
Data points to consider: Australian employment change at 2.30am, RBA Assist Gov. Debelle speaks at 8.40am. US Weekly unemployment claims and the Empire state manufacturing index figures at 1.30pm, US Industrial production and Capacity utilization rate at 2.15pm GMT+1.
Levels to watch/live orders:
- Buys: Flat (stop loss: N/A).
- Sells: Flat (stop loss: N/A).
USD/JPY
The USD/JPY suffered a blow to mid-section yesterday after below par US inflation and retail sales data hit the wire. Pushing through both the 110 handle and also the H4 mid-level support at 109.50, the pair shook hands with the 109 handle as we entered the US segment. The Fed, as expected, lifted the benchmark interest rate by 25bps, confirming support around 109 and pushing price back above the 109.50 barrier by the close.
Weekly bears continue to remain in a relatively strong position after pushing aggressively lower from supply registered at 115.50-113.85. We know there's a fair bit of ground to cover here, but this move could possibly result in further downside taking shape in the form of a weekly AB=CD correction (see black arrows) that terminates within a weekly support area marked at 105.19-107.54 (stretches all the way back to early 2014). In conjunction with weekly flow, daily price also shows a potential AB=CD correction in the works taken from the high 114.36, which could see price drive lower to 107.15-107.90: a support zone that's glued to the top edge of the said weekly support area and holds a 61.8% Fib support at 107.81 taken from the low 101.19.
Our suggestions: In light of the above notes, our team has no interest in buying this market today. Instead, what we're looking for is a H4 close to print below 109.50. That way, we'd not only have space to sell down to at least 109, but we'd also be trading in line with higher-timeframe flow.
Data points to consider: US Weekly unemployment claims and the Empire state manufacturing index figures at 1.30pm, US Industrial production and Capacity utilization rate at 2.15pm GMT+1.
Levels to watch/live orders:
- Buys: Flat (stop loss: N/A).
- Sells: Watch for H4 price to engulf 109.50 and then look to trade any retest seen thereafter ([waiting for a lower-timeframe sell signal to form following the retest – see the top of this report – is advised] stop loss: dependent on where one confirms this level).
USD/CAD
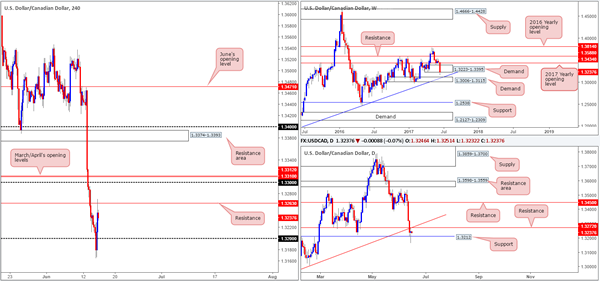
The USD/CAD erased some of its earlier losses (spurned on by lower-than-expected US inflation and retail sales data) after the Fed stepped in and lifted its benchmark interest rate by 25bps. This allowed the pair to trade back above the 1.32 handle and retest H4 resistance at 1.3263.
Despite the minor whipsaw seen through the lower edge of the weekly demand base at 1.3223-1.3395, the area remains in play. A closer look at price action on the daily chart, nevertheless, shows price is capped between support drawn from 1.3212 and resistance at 1.3272, which happens to converge with a trendline resistance extended from the low 1.2968.
Our suggestions: Given the uncertainty surrounding the weekly demand area, and daily price not showing much in the way of direction at the moment, looking to sell from the current H4 resistance is not something we'd consider high probability. As such, remaining flat until more conducive price action presents itself is the route we've chosen to take.
Data points to consider: US Weekly unemployment claims and the Empire state manufacturing index figures at 1.30pm, US Industrial production and Capacity utilization rate at 2.15pm. Canadian Manufacturing sales at 1.30pm GMT+1.
Levels to watch/live orders:
- Buys: Flat (Stop loss: N/A).
- Sells: Flat (Stop loss: N/A).
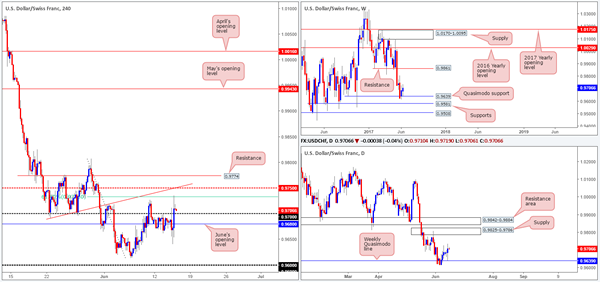
USD/CHF
Using a top-down approach this morning, we can see that the bulls continue to show promise after connecting with the weekly Quasimodo support level seen at 0.9639. To our way of seeing things, the next upside target on this scale does not come into view until weekly resistance located at 0.9861. It's much the same story on the daily chart, except the next upside hurdle is seen around supply coming in at 0.9825-0.9786.
Swinging over to the H4 chart, the US dollar turned to the upside yesterday following the Fed's decision to raise interest rates by a further 25bps. Running through offers around the 0.97 handle, the pair was able to connect with a H4 61.8% Fib resistance plugged at 0.9732.
Our suggestions: In light of the higher-timeframe picture, our desk is biased to the upside. Be that as it may, buying this market is a little challenging. Not only is there the aforementioned H4 61.8% Fib resistance lurking just ahead, but a few pips above that sits the H4 mid-level resistance at 0.9750 that merges with a H4 trendline resistance taken from the low 0.9691. Therefore, we're afraid that we have no interest in trading this market today.
Data points to consider: US Weekly unemployment claims and the Empire state manufacturing index figures at 1.30pm, US Industrial production and Capacity utilization rate at 2.15pm. SNB Monetary policy assessment at 8.30am GMT+1.
Levels to watch/live orders:
- Buys: Flat (stop loss: N/A).
- Sells: Flat (stop loss: N/A).
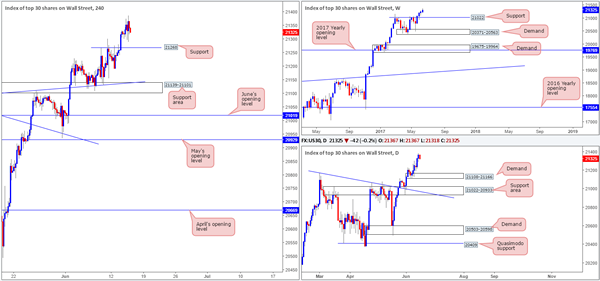
DOW 30
Although US equities pushed to a fresh record high of 21388 yesterday, the market took on more of a sober tone in comparison to Wednesday's trading. For those who have been following our reports over the past few days you may recall that our desk had recently taken a small long position at 21164 and placed stops below the H4 support area (21139-21101) at 21097. The position is still active, but we have liquidated 50% of the trade around the 21234 neighborhood.
Fortunately, the index continues to push higher as we are now looking to trail this market with the remainder of our position. The stop remains located below Monday's session low (21192) at 21188. Ideally, we're looking for H4 price to remain above the H4 support level coming in at 21268, as a close below here could imply that our stop-loss order is at risk of being filled.
Our suggestions: Should H4 action pullback and retest 21268 and hold as support, our team may, dependent on the time of day, consider adding to our position. A H4 bullish candle (preferably a full-bodied candle) would be a fantastic sight as this would be enough evidence to trigger an additional buy in this market.
Data points to consider: US Weekly unemployment claims and the Empire state manufacturing index figures at 1.30pm, US Industrial production and Capacity utilization rate at 2.15pm GMT+1.
Levels to watch/live orders:
- Buys: 21164 ([live] stop loss: 21188). 21268 region ([waiting for a reasonably sized H4 bull candle – preferably a full-bodied candle – to form before pulling the trigger is advised] stop loss: ideally beyond the candle's tail).
- Sells: Flat (stop loss: N/A).
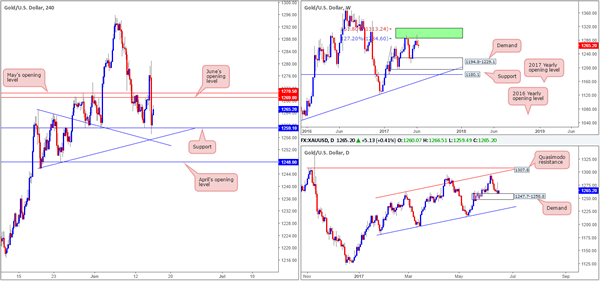
GOLD
As can be seen from the weekly timeframe, the bears continue to hold this market lower after connecting with an area comprised of two weekly Fibonacci extensions 161.8/127.2% at 1313.7/1285.2 taken from the low 1188.1 (green zone). From this scale, there's room for the precious metal to continue pumping lower until we reach the demand base coming in at 1194.8-1229.1.
Sliding down to the daily timeframe, bullion is seen trading within an ascending channel (1180.4/1263.7). The demand area coming in at 1247.7-1258.8 continues to hold firm. Pressure from weekly sellers could see this area consumed, however, which in turn would likely bring the candles down to the channel support taken from the low 1180.4.
Turning our attention to the H4 timeframe, support at 1259.1 remains intact, despite the whipsaw to lows of 1257.0. With this support level seen capping downside, and May/June's opening levels at 1270.5/1269.0 seen capping upside, where does one go from here?
Our suggestions: It's never ideal when the higher-timeframe picture shows conflicting signals. Of course, one could still look to trade from the above said H4 levels, but not knowing where the higher timeframes are likely headed, one should not really expect much more than a bounce. For us personally, we're going to take the side of caution and remain on the sidelines for the time being.
Levels to watch/live orders:
- Buys: Flat (stop loss: N/A).
- Sells: Flat (stop loss: N/A).
Elliott Wave View: GBPJPY Resuming Lower
Short term GBPJPY Elliott Wave view suggests the decline from 5/10 high shows a 5 swing sequence, thus favoring more downside. Decline from 5/10 high is unfolding as a double three Elliott Wave structure. Down from 5/10 peak (148.11), Minor wave W ended at 141.47 and Minor wave X ended at 143.96. Minor wave Y is currently in progress and has scope to retest 4/16 low (135.58). Support can be seen at 135.7 – 137.3 area for at least 3 waves bounce.
Subdivision of Minor wave Y is proposed to be unfolding as a triple three Elliott Wave structure. Down from 6/1 peak (143.96), Minute wave ((w)) ended at 140.68, Minute wave ((x)) ended at 142.77, Minute wave ((y)) ended at 139.52 and Minute second wave ((x)) is proposed complete at 140.9. While near term bounce stays below 142.75, and more importantly below 143.95, expect pair to extend lower. We don’t like buying the pair.
GBPJPY 1 Hour Elliott Wave Chart