Sample Category Title
Technical Outlook: EURUSD – Risk Of Deeper Pullback While 10SMA / Daily Tenkan-Sen Cap
The Euro returned to familiar levels around 1.1200 after Wednesday's attempt at 1.1300 zone target, driven by strong fall of dollar on disappointing US inflation data and subsequent pullback on FOMC rate hike that strengthened the greenback.
Underlying bull trend is still in play but repeated failures to close above 10SMA / daily Tenkan-sen (1.1231) could be seen as negative signal, as Wednesday's daily candle with long upper shadow on strong upside rejection weighs.
Firm break below 20SMA (1.1217) which tracks the action in past couple of days and extension below last Friday's low at 1.1166 is needed to generate stronger bearish signal and expose next pivotal support at 1.1109 (30 May trough/near Fibo 38.2% of 1.0820/1.1295 upleg).
Conversely, eventual close above 10 SMA/daily Tenkan-sen resistances would shift focus higher, however, sustained break above 1.1300 barrier is needed to signal bullish continuation.
Res: 1.1231, 1.1295, 1.1300, 1.1366
Sup: 1.1192, 1.1166, 1.1109, 1.1058
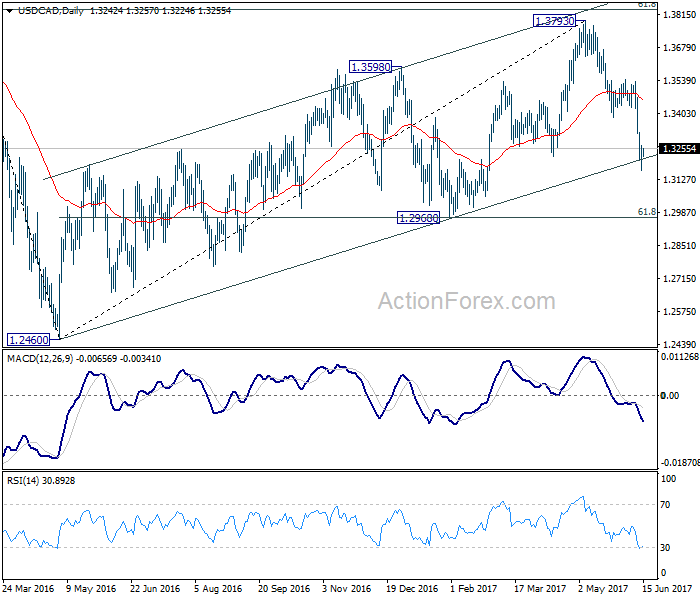
USD/CAD Daily Outlook
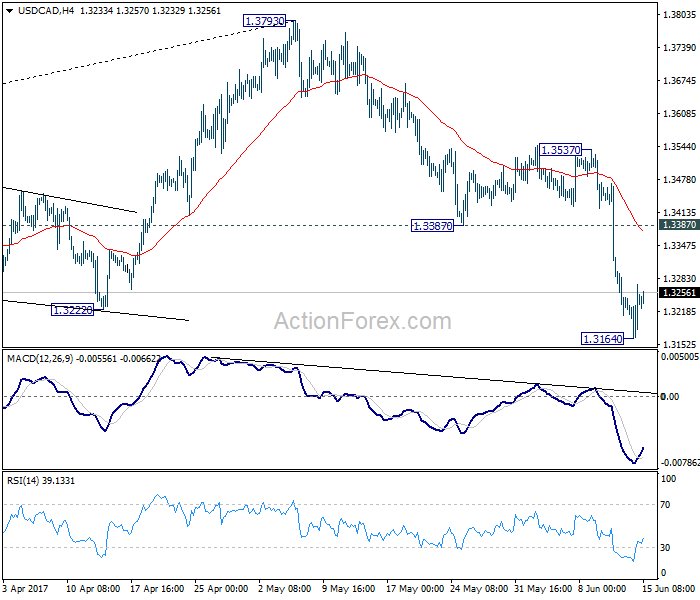
Daily Pivots: (S1) 1.3184; (P) 1.3227; (R1) 1.3291; More....
USD/CAD recovered after dipping to 1.3164 and intraday bias is turned neutral first. Some consolidation would be seen but recovery is expected to be limited by 1.3387 support turned resistance to bring fall resumption. Current development affirms our view that corrective rise from 1.2460 has completed at 1.3793. Below 1.3164 will target next key level at 1.2968 (38.2% retracement of 1.2460 to 1.3793 at 1.2969) for confirmation.
In the bigger picture, price actions from 1.4689 medium term top are seen as a correction pattern. The first leg has completed at 1.2460. Rise from 1.2460 is seen as the second leg and has completed at 1.3793, ahead of 61.8% retracement of 1.4689 to 1.2460 at 1.3838. Break of 1.3222 should now indicate the start of the third leg while further break of 1.2968 should confirm. In that case, USD/CAD should decline through 1.2460 support to 50% retracement of 0.9406 to 1.4869 at 1.2048.
Who Shall We Believe, The Fed Or Data?
The Federal Reserve's decision on Wednesday to raise interest rates by 25 basis points was widely anticipated, but markets were surprised by the hawkishness in the policy statement and Chair Janet Yellen's press conference.
Even though projections for inflation were lowered to 1.6% from 1.9% in 2017, the dot plot didn't change. Fed members still expect one more rate hike in 2017 and three in 2018. More interestingly, policy makers set out a detailed plan to shrink the $4.5 trillion balance sheet by gradually reducing security holdings.Although the date hasnot been specified, there's a very high chance the process will start in September.
It seems the Fed is no longer as data dependent as before and wants to carry on with the normalization process despite weakness seen in some economic releases. Yesterday's CPI and retail sales were both disappointing but didn't seem to worry Yellen.
This disconnect between what the markets expect and what the Fed is signaling may be explained in two theories. It's either that the recent wobble in economic data is temporary, and the next two months should prove it, or the Fed wants to have enough tools in case the economy fell into a new recession.
Although the dollar rallied after the statement release and Yellen's speech, the dollar index is still trading near a seven-month low. Fixed income traders are clearly unconvinced with the Fed's hawkishness. U.S. yields dropped across the curve on Wednesday and the spread between two and ten-year yields shrank to the lowest levels in overa year. However, equity investors seemed to take Yellen more seriously sending cyclical stocks lower driven by the tech sector. Many U.S. stocks will be vulnerable to an ongoing tightening in financial conditions especially those with overstretched valuations.
BoE rate decision
Attention today will shift to Bank of England's decision, and how policymakers will respond to the drop in consumer spending, negative real wages, and inflationary pressures. The weaker pound's impact on Britons' living standards started to reflect in the latest data releases and today's retail sales figure may fall sharply after increasing 2.3% in April. The BoE might underestimate the recent spike in prices, but if two or three MPC members see a need to follow the Fed by hiking rates the pound will appreciate sharply. However, with the increased risk of political turmoil, it's highly unlikely that the BoE will hike rates anytime soon unless inflation went out of control. Overall, I think politics will continue to be the primary driver for Sterling in the foreseeable future.
Dollar Recovers After Initial Sell-Off
The US dollar pared losses on Wednesday after initially falling sharply after the FOMC meeting. The Federal Reserve hiked interest rates on Wednesday and maintained its hawkish view on the economy. The US dollar index fell to a fresh 7-month low before pulling back higher towards the close.
Looking ahead the busy economic calendar continues with the SNB and the Bank of England monetary policy meetings lined up for today. The focus will, of course, turn to the Bank of England which will need to take a tough call given the recent decline in wages amid rising inflation. No changes to monetary policy are expected at today's meeting, but the BoE officials are likely to flag the downside risks, which increases the scope of possible policy easing.
The Swiss national bank is however expected to remain on the sidelines with no major changes expected. The SNB's 3-month LIBOR rate is expected to remain steady at -0.75%.
EURUSD intraday analysis
EURUSD (1.1222): The EURUSD rallied to a fresh 7-month high, rising to just below $1.1300 during the FOMC statement. The common currency, however, pulled back lower to close at 1.1218. Price action continues to trade within the rising wedge pattern forming on the daily chart. This suggests a possible downside break in the EURUSD. Watch for support at 1.1200. On the 4-hour chart, the resistance level at 1.1200 - 1.1245 was tested with price failing to hold on to the gains. This could potentially put further downside in EURUSD towards 1.1100 with the possibility of testing 1.1000.
GBPUSD intraday analysis
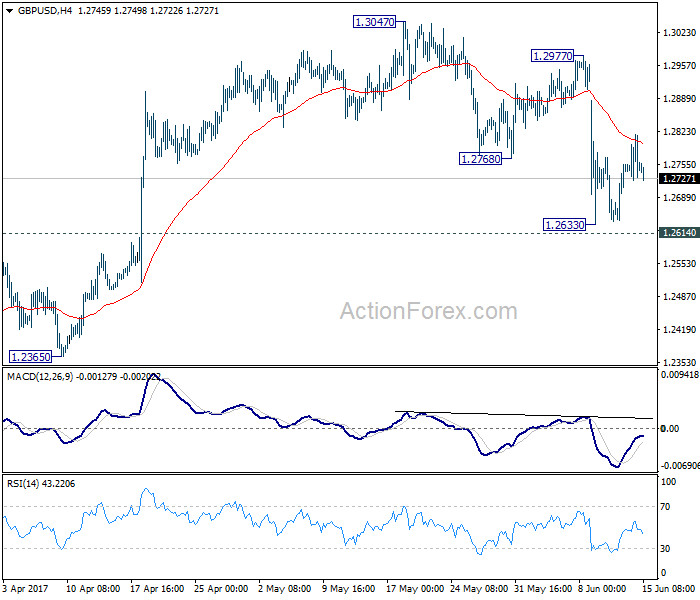
GBPUSD (1.2747): The British pound tested the neckline resistance level of 1.2800 yesterday. Price action closed with a doji at this level and a bearish close today could signal a decline to 1.2600 which is the measured target for the head and shoulders pattern on the daily chart. On the 4-hour chart, we can see that GBPUSD formed a temporary bottom above 1.2600. With the BoE meeting today, the GBPUSD could possibly push lower. This bias changes only on a daily close above 1.2800 and above yesterday's high of 1.2817.
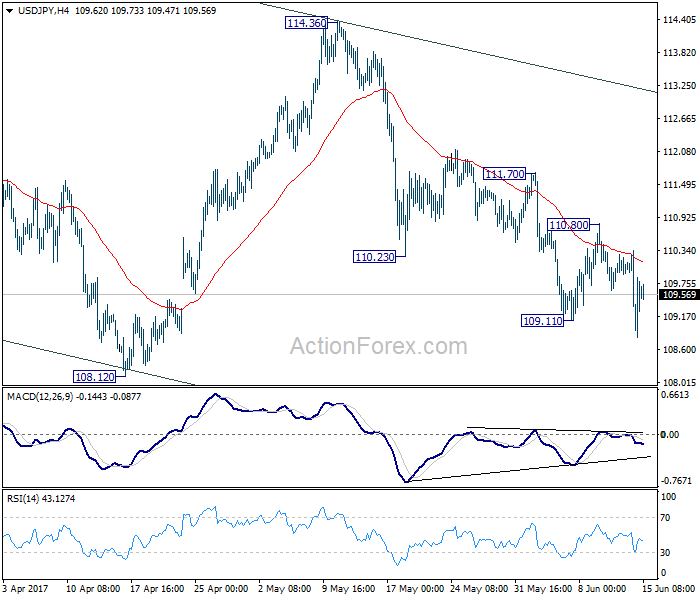
USDJPY intraday analysis
USDJPY (109.18): USDJPY fell to test the support level at 109.50 - 109.25. However, price action was maintained at this level and marks a second test of the support level. In the near term, a bullish continuation is required from this level in order for USDJPY to test 110.79. There is also the potential for USDJPY to break out above this resistance level and test the next main technical level at 112.00.
Trade Idea : USD/CHF – Stopped profit and buy at 0.9685
USD/CHF - 0.9723
Most recent candlesticks pattern : N/A
Trend : Near term up
Tenkan-Sen level : 0.9719
Kijun-Sen level : 0.9689
Ichimoku cloud top : 0.9683
Ichimoku cloud bottom : 0.9682
Original strategy :
Sold at 0.9720, stopped profit at 0.9715
Position : - Short at 0.9720
Target : -
Stop : - 0.9715
New strategy :
Buy at 0.9685, Target: 0.9785, Stop: 0.9650
Position : -
Target : -
Stop : -
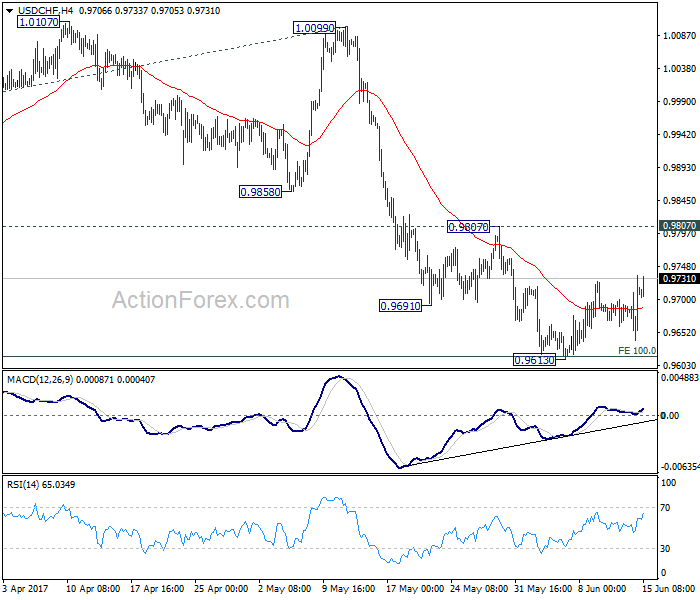
Although the greenback slipped to 0.9641, lack of follow through selling and the subsequent rally on dollar’s broad-based strength suggest low has been formed at 0.9613 last week and mild upside bias is seen for the erratic rise from there to extend gain to 0.9760-65, however, reckon resistance at 0.9808 would hold from here, bring retreat later.
In view of this, we re looking to buy dollar on pullback as 0.9680-85 should limit downside. Only break of said support at 0.9641 would abort and revive bearishness and suggest the rebound from 0.9613 has ended instead, bring retest of this level later.

USD/JPY Daily Outlook
Daily Pivots: (S1) 108.79; (P) 109.56; (R1) 110.34; More...
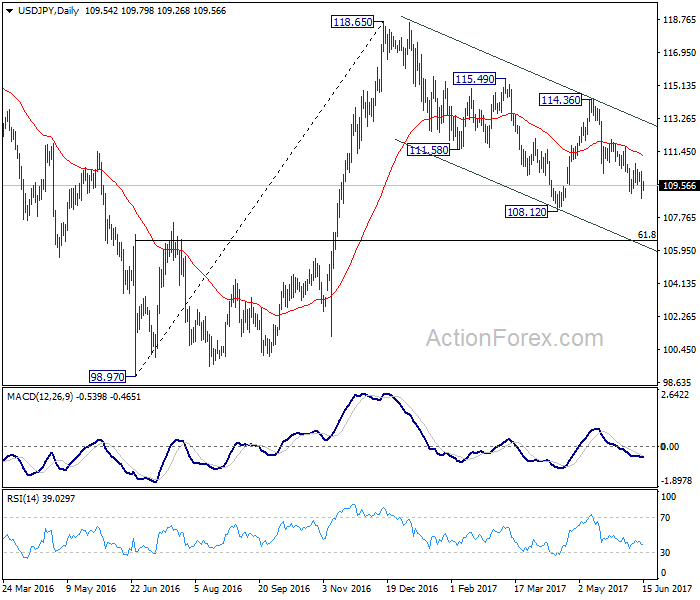
USD/JPY's fall from 114.36 resumed by taking out 109.11. Despite subsequent recovery, 4 hour MACD stays below signal line. Intraday bias remains on the downside for 108.12 low first. Break will extend the whole corrective fall from 118.65 to 61.8% retracement of 98.97 to 118.65 at 106.48. We will look for bottoming sign there. On the upside, break of 110.80 resistance is needed to indicate completion of fall from 114.36. Otherwise, outlook will stay bearish in case of recovery.
In the bigger picture, price actions from 125.85 high are seen as a corrective pattern. It's uncertain whether it's completed yet. But in case of another fall, downside should be contained by 61.8% retracement of 75.56 to 125.85 at 94.77 to bring rebound. Overall, rise from 75.56 is still expected to resume later after the correction from 125.85 completes.
Fed Hikes Despite Weaker Data
Market movers today
Please note that today at 09:00 CET we publish the Nordic Outlook, which is our quarterly publication that presents our view on the economic out look for the Nordic countries. The publication does not contain new financial forecasts.
In the UK, focus is on Bank of England meeting at 13:00 CET. It is one of the small meetings with an Inflation Report and a press conference, so focus will be solely on the tone in the summary and minutes, as no one expects any policy changes. Our base case is that BoE maintains the hawkish twist to its neutral stance but given Q1 GDP growth was revised down (and not up as BoE expected) and nominal wage growth has declined, risk is tilted towards a more dovish tone. Market pricing seems fair at the moment as the first full hike is not priced in before late 2019.
Also in the UK, we getretail sales for May at 10.30 CET.
In the US, focus is on the Empire and Philly Fed manufacturing indices (both due at 14:30 CET), which may give us some indication about what to expect of ISM manufacturing in May. We also get actual industrial production data for May at 15:15 CET.
Selected market news
Fed hikes despite weaker data, provides details on quantitative tightening. As was generally expected, the Fed delivered its second 25bp rate hike so far this year (only Kashkari dissented). Thereby, the Fed defied the recent trend lower in inflation, as both CPI and PCE are below 2%, and the general softening in US economic data witnessed as of late. At the press conference, Fed Chair Yellen was relatively hawkish, referring to the decline in inflation as 'noise', while repeatedly referring to the low unemploymentrate. The 'dots' were unchanged in projecting one more hike this year, three hikes next year and a neutral Fed funds rate at 3%. Interestingly, however, the Fed issued an addendum to it s 'Policy Normalization Principles and Plans', providing details on how it expects to shrink its balance sheet in a process that should start later this year. For more information, 15 June 2017.
Market sends USD stronger, US fixed income holds on to gains. EUR/USD dipped back towards the 1.12 level, after rising earlier in the day on the weak US May inflation print (core CPI lower to 1.7% y/y vs. expectations of 1.9 % and 1.9% in April). US Treasuries sold off slight ly on Fed, but still trade richer over the day. The S&P500 index closed the day 0.1% lower, with losses driven by the energy sector.
USD/CHF Daily Outlook
Daily Pivots: (S1) 0.9654; (P) 0.9694; (R1) 0.9749; More.....
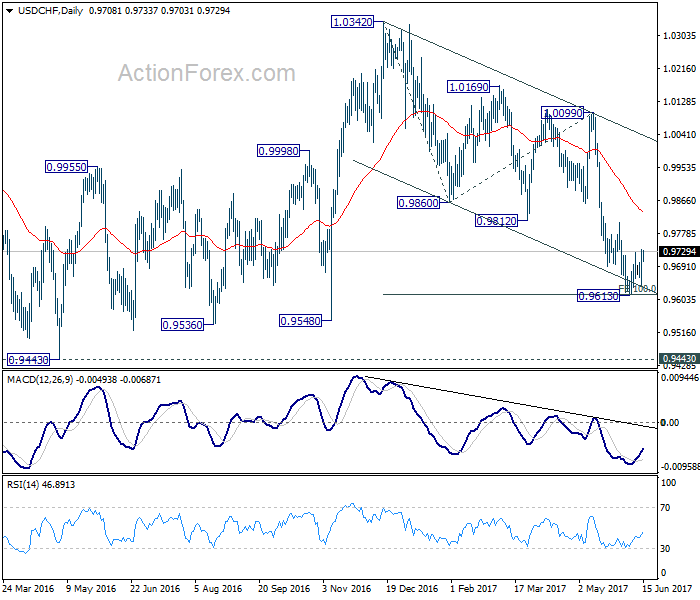
USD/CHF's recovery from 0.9613 is still in progress. But upside is limited well below 0.9807 resistance so far. Intraday bias stays neutral at this point. As long as 0.9807 resistance holds, outlook remains cautiously bearish and deeper fall is expected. Break of 0.9613 will extend the whole decline from 1.0342 to 0.9548 support and below. We'd start to look for bottoming signal again as it approaches 0.9443 key support level. However, considering bullish convergence condition in 4 hour MACD, break of 0.9807 will indicate near term reversal and turn outlook bullish for 1.0099 resistance next.
In the bigger picture, USD/CHF is still bounded in medium term range of 0.9443/1.0342 for the moment. Consolidative trading would likely continue and medium term outlook remains neutral. Break of 1.0342 key resistance is needed to confirm underlying bullish momentum in the pair. Meanwhile, downside attempts should be contained by 0.9443 key support level. However, sustained break of 0.9443 will carry larger bearish implication and target 0.9 handle.
Trade Idea : GBP/USD – Sell at 1.2790
GBP/USD - 1.2729
Most recent candlesticks pattern : N/A
Trend : Near term down
Tenkan-Sen level : 1.2742
Kijun-Sen level : 1.2771
Ichimoku cloud top : 1.2724
Ichimoku cloud bottom : 1.2704
Original strategy :
Sell at 1.2850, Target: 1.2750, Stop: 1.2885
Position : -
Target : -
Stop : -
New strategy :
Sell at 1.2790, Target: 1.2690, Stop: 1.2825
Position : -
Target : -
Stop : -
As the British pound ran into resistance at 1.2818 yesterday and has retreated on dollar’s broad-based strength after Fed rate hike, suggesting the rebound d from 1.2635 has ended there and consolidation with mild downside bias remains for weakness to 1.2700, however, break of 1.2680 is needed to retain bearishness and bring further fall to 1.2650, then towards said support at 1.2635.
In view of this, we are looking to sell cable on recovery as 1.2790-00 should limit upside. Above said resistance at 1.2818 would defer and risk a strong rebound to 1.2845-50 (61.8% Fibonacci retracement of 1.2978-1.2635) but upside should be limited to 1.2870-80.

GBP/USD Daily Outlook
Daily Pivots: (S1) 1.2710; (P) 1.2764; (R1) 1.2804; More...
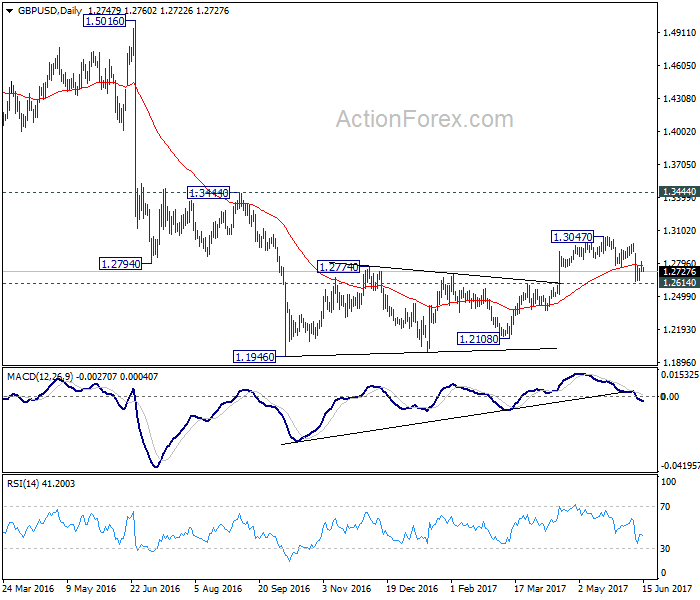
GBP/USD failed to sustain above 4 hour 55 EMA and retreats. At this point, intraday bias remains neutral and the consolidation from 1.2633 temporary low might extend. Near term outlook remains bearish with 1.2977 resistance intact. We continue to favor the case that consolidation pattern from 1.1946 has completed at 1.3047 already. Decisive break of 1.2614 resistance turned support would confirm our bearish view and target a test on 1.1946 low next. However, break of 1.2977 will dampen our view and turn bias back to the upside for 1.3047 and above.
In the bigger picture, fall from 1.7190 is seen as part of the down trend from 2.1161. Price actions from 1.1946 medium term low are seen as a consolidation pattern, which could have completed after hitting 55 week EMA. Break of 1.1946 low will target 61.8% projection of 1.5016 to 1.1946 from 1.3047 at 1.1150 next. In case the consolidation from 1.1946 extends, outlook will stay remain bearish as long as 1.3444 resistance holds.