Sample Category Title
Gold Analysis: Near Levels Of Significance
On Wednesday morning the yellow metal was in a decline down to the 1,290 mark. The reason for that from a technical perspective could be explained by the fact that the commodity price had overextended its gains. Such a fact is hinted by the fact that the only notable resistance, which the metal faced, when it changed its direction, was the upper Bollinger band of the hourly chart. Most likely this is the beginning of a short consolidation, as the metal had been trading in limbo between the various support levels that were providing resistance on Tuesday. Due to these reasons combined the previous target of the weekly R3 near the 1,307 mark remains intact. However, market participants should watch closely, where the rebound occurs
USD/JPY Analysis: Struggles To Hold Above 109.00
The USD/JPY pair behaved in accordance with expectations yesterday, being that the monthly S1 at 109.22 was the level that managed to prevent the pair from edging lower. Although the monthly S1 managed to limit the losses on Tuesday, risks remain skewed to the downside, meaning that the given demand level could fail today. A breach of this support would open the door for a drop beyond 109.00, with the second closest strong support being only under 108.00. Technical studies do suggest the bearish momentum is to prevail today, but given the latest USD movements, a positive development would not be a surprise. The recovery, however, would just be a bullish correction from the recent declines and could well take place if the given trend-lines prove to be viable.
GBP/USD Analysis: To Trade Flat For Another Day
The Cable experienced minor volatility on Tuesday, with the exchange rate mostly gravitating towards the monthly pivot point. Flat trade could indicate that the Pound’s bullish momentum is nearing its end, even though technical studies suggest the opposite. In either case, the Sterling is likely to consolidate for another day, with trade anchored around the 1.29 major level and the three-month up-trend remaining a strong support, which is to limit any losses should those occur today. Gains, however, are unlikely to exceed the 1.2940 handle, as the British currency struggled to climb over this area through all of the previous week. Meanwhile, traders retain a neutral outlook towards the GBP/USD pair, as 52% of all open positions are long.
Trade Idea: GBP/JPY – Sell at 142.00
GBP/JPY - 141.10
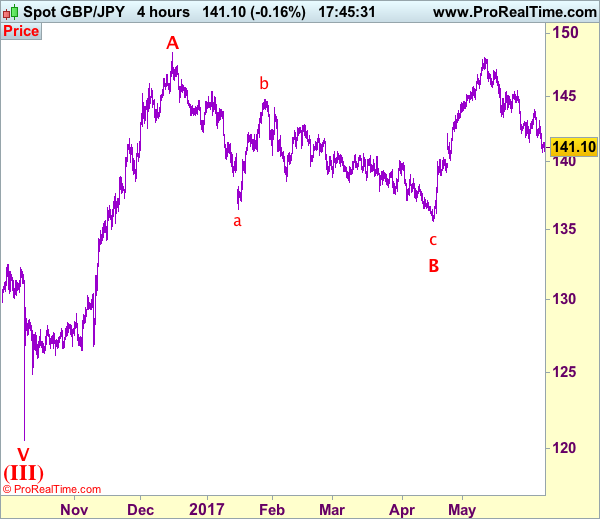
Recent wave: Medium term low formed at 120.50 and (A)-(B)-(C) major correction has commenced with (A) leg ended at 148.45, hence wave (B) is unfolding for retreat to 131.00-10.
Trend: Near term up
Original strategy:
Sold at 143.65, met target at 141.65
Position: - Short at 143.65
Target: - 141.65
Stop: -
New strategy :
Sell at 142.00, Target: 140.00, Stop: 142.60
Position: -
Target: -
Stop:-
As sterling has remained under pressure after recent anticipated selloff, suggesting recent selloff from 148.10 top is still in progress and bearishness remains for this move to extend weakness to 140.50-55, then towards psychological support at 140.00, however, near term oversold condition should prevent sharp fall below previous support at 139.20, risk from there has increased for a rebound later.
In view of this, would not chase this fall here and would be prudent to sell sterling again on recovery as 142.00-10 should limit upside and bring another decline later. Above 142.55-60 would suggest low is possibly formed, risk a stronger rebound towards resistance at 143.10 but a sustained breach above there is needed to confirm, bring a stronger rebound towards resistance at 143.95-00.
Our preferred count is that larger degree wave V with circle is unfolding from 251.12 with wave (I) 219.34, (II): 241.38 and wave (III) is subdivided into 1: 192.60, 2: 215.89 (23 Jul 2008) and wave 3 ended at 118.87 earlier in 2009. The correction from there to 162.60 is wave 4 which itself is a double three and is labeled as first a-b-c ended at 151.53, followed by wave x at 139.03, 2nd a ended at 162.60, 2nd b at 146.75 and 2nd c leg of wave 4 ended at 163.00. Therefore, the decline from 163.00 to 116.85 is now treated as wave 5 which also marked the end of larger degree wave (III), hence wave (IV) major correction has commenced for retracement of the wave (III) from 241.38 and upside target at 183.95-00 (50% Fibonacci retracement of the wave (II) from 241.38) had been met, a drop below 160.00 would suggest wave (IV) has ended at 195.85, bring decline in wave (V) for initial weakness to 130 (already met) and 120.
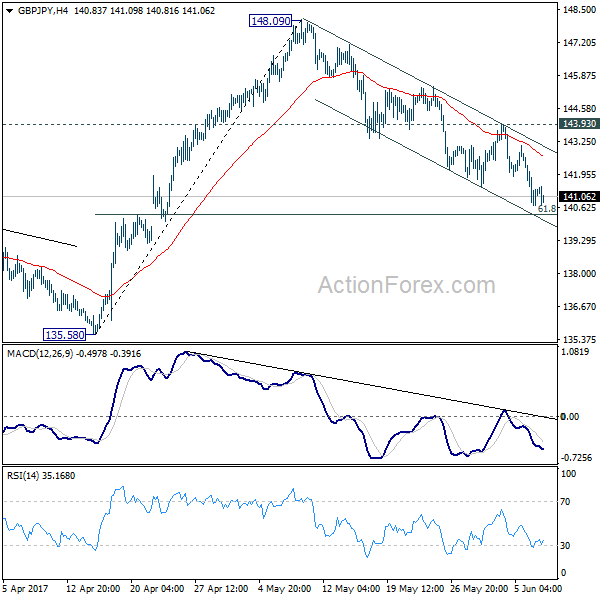
GBP/JPY Daily Outlook
Daily Pivots: (S1) 140.39; (P) 141.51; (R1) 142.32; More....
Intraday bias in GBP/JPY remains on the downside for 61.8% retracement of 135.58 to 148.09 at 140.35. At this point, we'd continue to look for bottoming around there and bring rebound. Break of 143.93 will indicate near term reversal and turn bias back to the upside. However, sustained break of 140.35 will bring deeper fall to 135.58 key support level.
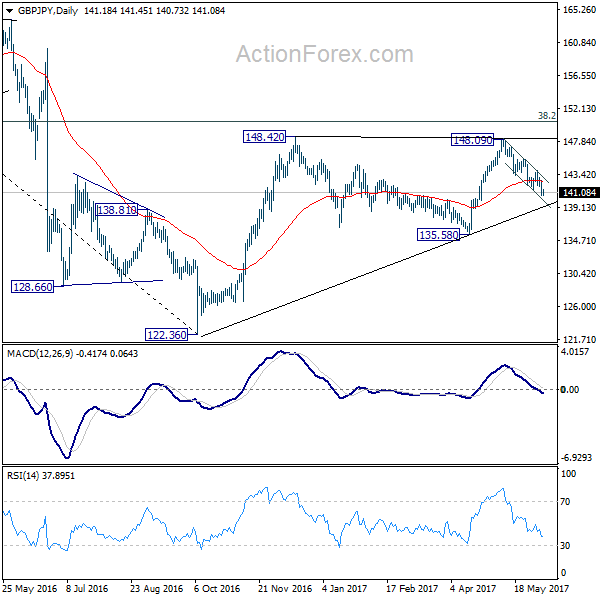
In the bigger picture, rise from 122.36 medium term bottom is still expected to extend to of 195.86 to 122.36 at 150.42. And decisive break there could pave the way to 61.8% retracement at 167.78. However, as the cross is starting to lose upside momentum, rejection below 150.42 and break of 135.58 support will indicate reversal and bring deeper fall back to retest 122.36 instead.
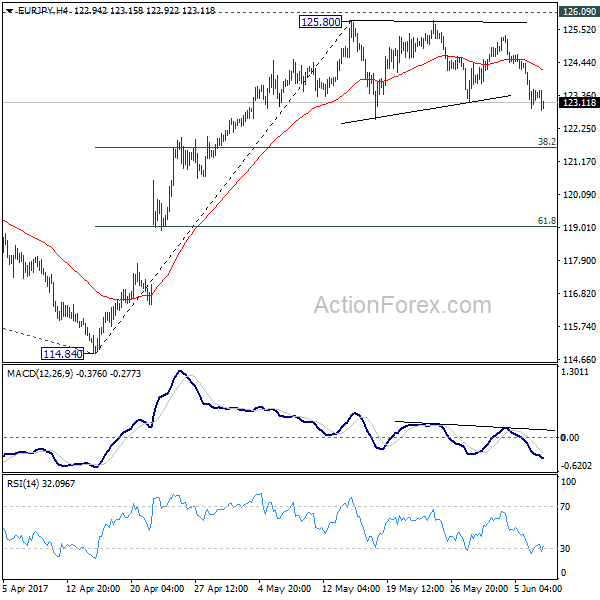
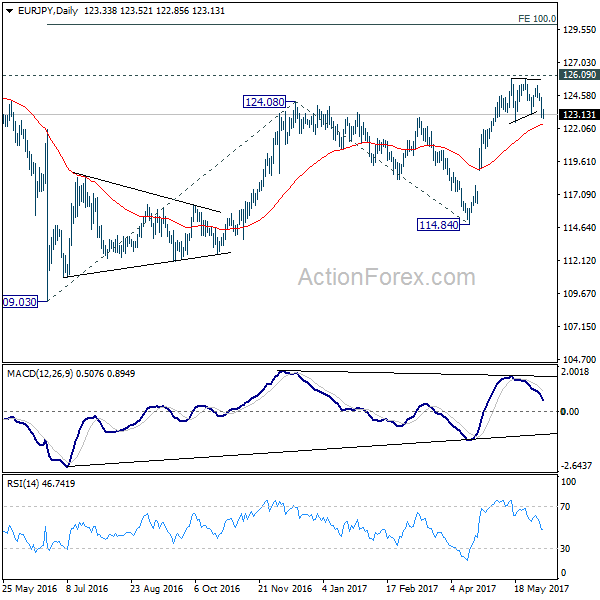
EUR/JPY Daily Outlook
Daily Pivots: (S1) 122.73; (P) 123.56; (R1) 124.19; More...
No change in EUR/JPY's outlook as consolidation from 125.80 is still in progress. Deeper fall could be seen but downside should be contained by 38.2% retracement of 114.84 to 125.80 at 121.61 to bring rise resumption. We're staying mildly bullish in the cross. And, break of 126.09 key resistance will extend the whole rebound from 109.03 to 100% projection of 109.03 to 124.08 from 114.84 at 129.89. Nonetheless, firm break of 121.61 will dampen our bullish view and bring deeper fall to 61.8% retracement at 119.02.
In the bigger picture, focus is staying on 126.09 support turned resistance. Decisive break there will confirm completion of the down trend from 149.76. And in such case, rise from 109.20 is at the same degree and should target 141.04 resistance and above. Meanwhile, rejection from 126.09 and break of 114.84 will extend the fall from 149.76 through 109.20 low.
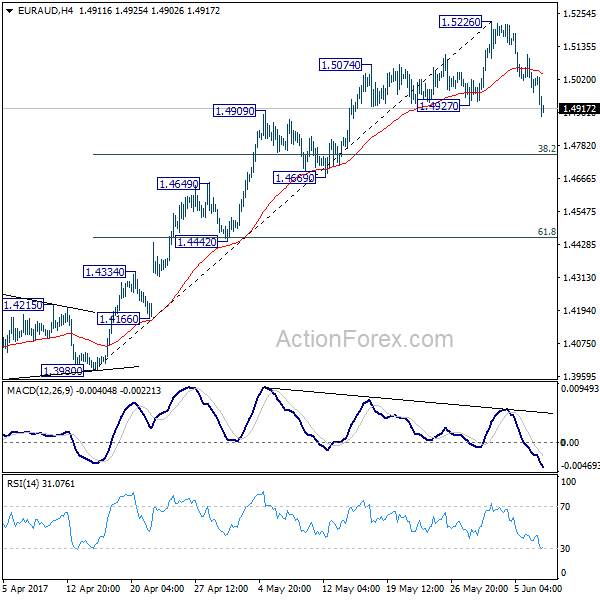
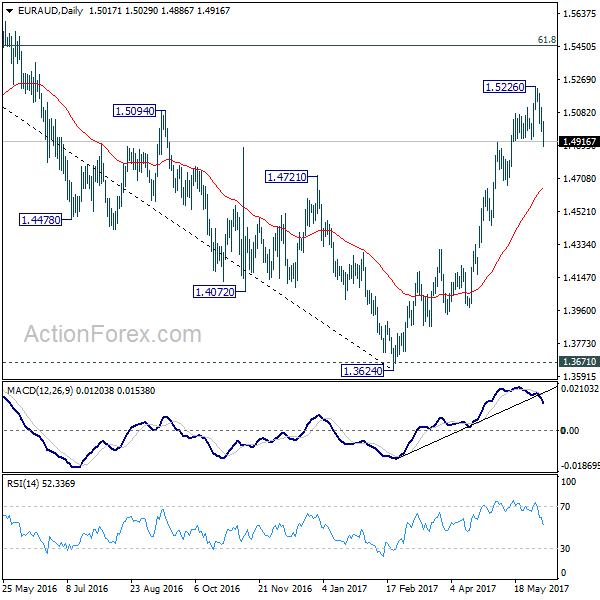
EUR/AUD Daily Outlook
Daily Pivots: (S1) 1.4961; (P) 1.5034; (R1) 1.5095; More...
The break of 1.4927 support in EUR/AUD indicates short term topping at 1.5226, on bearish divergence condition in 4 hour MACD. Intraday bias is turned to the downside for deeper pull back to 38.2% retracement of 1.3980 to 1.5226 at 1.4750. At this point, we'd expect strong support from 1.4669 to contain downside and bring rebound. Larger rise from 1.3642 is expected to resume later after the pull back completes.
In the bigger picture, price actions from 1.6587 medium term top are viewed as a corrective pattern. Such correction should be completed at 1.3624 after defending 1.3671 key support. Rise from 1.3642 is now expected to target 61.8% retracement of 1.6587 to 1.3624 at 1.5455. Sustained break there will pave the way to retest 1.6587. In any case, outlook will now stay cautiously bullish as long as 1.4669 support holds.
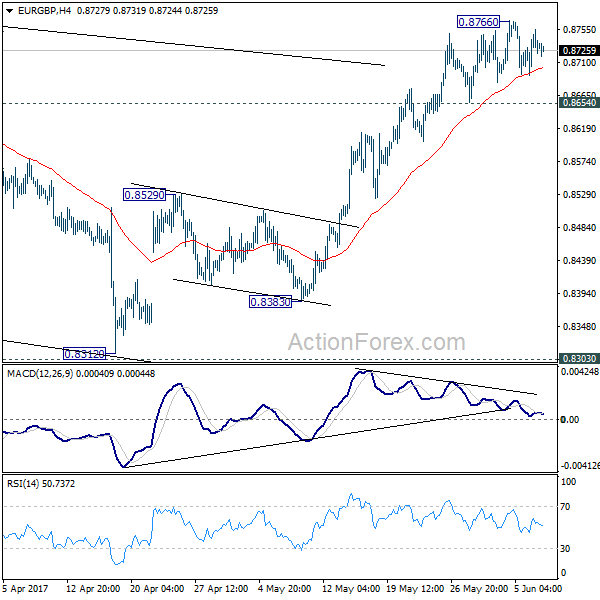
EUR/GBP Daily Outlook
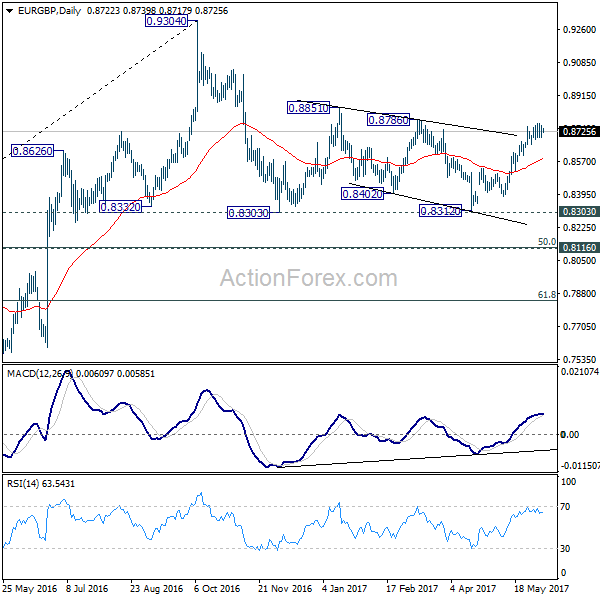
Daily Pivots: (S1) 0.8700; (P) 0.8727; (R1) 0.8763; More...
Intraday bias in EUR/GBP remains neutral for consolidation below 0.8766 temporary top. Further rally is still expected as long as 0.8654 support holds. Above 0.8766 will target 0.8786 resistance and then 0.8851. Decisive break of 0.8851 will pave the way to retest 0.9304 high. However, break of 0.8654 will indicate short term topping on bearish divergence condition in 4 hour MACD. In such case, intraday bias will be turned back to the downside for 55 day EMA (now at 0.8585).
In the bigger picture, price actions from 0.9304 are viewed as a medium term corrective pattern. The leg from 0.9304 should have completed after testing 0.8332 structural support. But it's too early to say that larger rise from 0.6935 is resuming. Rejection from 0.9304 will extend the consolidation with another falling leg. Meanwhile, firm break of 0.9304 will target 0.9799 (2008 high). In case of another decline, we'd expect strong support from 0.8116 cluster support (50% retracement of 0.6935 to 0.9304 at 0.8120) to contain downside and bring rebound.
EUR/CHF Daily Outlook
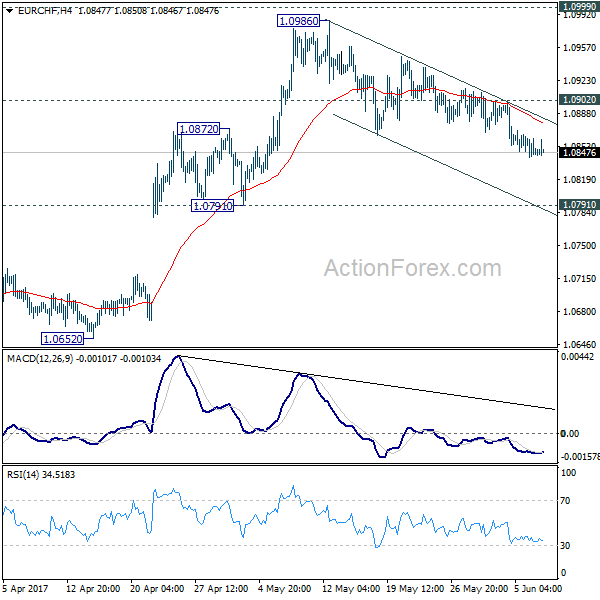
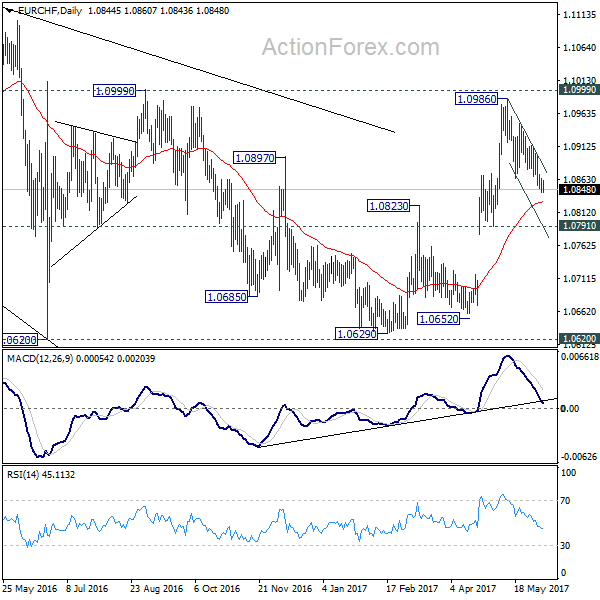
Daily Pivots: (S1) 1.0836; (P) 1.0850; (R1) 1.0860; More...
No change in EUR/CHF's outlook. Corrective fall from 1.0986 might extend. But downside downside should be contained by 1.0791/0872 support zone, probably around 55 day EMA (now at 1.0829). Rise from 1.0629 is expected to resume later. Above 1.0902 minor resistance will turn bias back to the upside for 1.0986/0999.
In the bigger picture, the price actions from 1.1198 are seen as a corrective move. Such correction could have completed after defending 38.2% retracement of 0.9771 to 1.1198 at 1.0653. Decisive break of 1.0999 resistance will target a test on 1.1198 high. For now, this will be the preferred case as long as 1.0791 support holds.
GBPUSD in Consolidation Around 1.29; Uptrend from March Intact
GBPUSD remains neutral in the near-term while maintaining a medium-term bullish market structure.
The pair has been pivoting around the key 1.2900 level while trading in a range since mid-April between 1.2755 and 1.3045. The market is waiting for a catalyst for the next sustained directional move.
Upside momentum could challenge the May 18 high of 1.3046. A break above this resistance level would trigger a move towards 1.3450, close to the top of a previous range (from July to September 2016).
Support lies at the bottom end of the current range near 1.2755. A deeper decline would target 1.2574 – which is the 50% Fibonacci level of the upleg from 1.2108 to 1.3046.
The broader technical picture looks bullish and the market has only retraced 23.6% of the rise from 1.2108 to 1.3046, keeping the uptrend still intact. There was a bullish crossover of the 50-day moving average with the 200-day MA. This suggests there will be relatively limited downside risk for GBPUSD in the near-term, although a flat RSI indicates that the consolidation phase will likely continue for now.
A drop below the 200-day MA and the 50% Fibonacci would negate the bullish structure from March.