Sample Category Title
Trade Idea: EUR/JPY – Stand aside
EUR/JPY - 123.04
Recent wave: wave v of (C) ended at 94.12 and major correction in wave A has ended at 149.79
Trend: Near term up
Original strategy:
Bought at 123.75, stopped at 123.15
Position: - Long at 123.75
Target: -
Stop: - 123.15
New strategy :
Stand aside
Position: -
Target: -
Stop:-
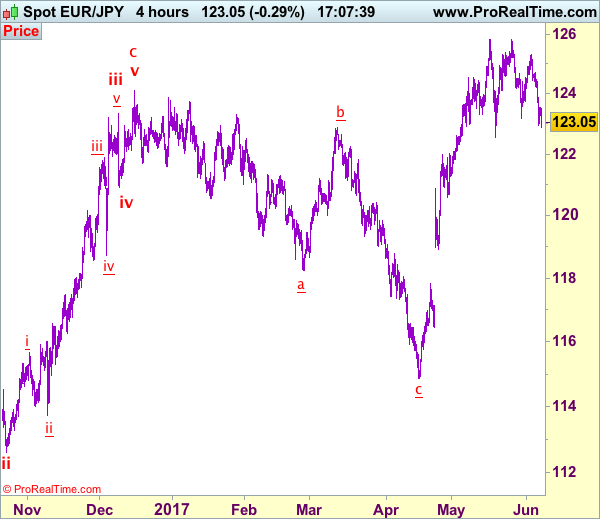
As the single currency has fallen again after brief recovery and indicated previous support at 123.16 was penetrated, suggesting further consolidation below recent high of 125.82 top would be seen and test of another previous support at 122.56 cannot be ruled out, however, break there is needed to retain near term bearishness for the erratic fall from 125.82 to bring retracement of early upmove to 122.00, then towards 121.25-30 with is likely to hold from here.
In view of this, would not chase this fall here and would be prudent to stand aside in the meantime. Above 123.55-60 would bring recovery to 124.00, however, only break of 124.70-75 would suggest the retreat from 125.31 has ended, bring a stronger rebound to 125.00 and possibly towards 125.31. Looking ahead, above 125.31 would extend gain towards strong resistance at 125.82 but break there is needed to confirm recent upmove has resumed and extend headway to 126.20-30 and possibly 126.60-70.
Our latest preferred count is that wave (ii) is ABC-X-ABC which ended at 123.33 and wave (iii) is unfolding with wave iii ended at 100.77, followed by wave iv at 111.57 and wave v as well as the wave (iii) has ended at 97.04, followed by wave (iv) at 111.43 and wave (v) has ended at 94.12 which is also the end of the larger degree v, this also implied the major wave (C) has also ended there, hence major correction has commenced from there with (A) leg unfolding in its lower degree wave c which has possibly ended at 145.69. Under this count, A-B-C wave (B) has commenced with A leg ended at 136.23, wave B at 143.79 and wave C has possibly ended at 149.79.
Our larger degree count is that the decline from 139.26 is wave (C) and is sub-divided into a diagonal triangle i-ii-iii-iv-v with wave i - 105.44, wave ii- 123.33, wave iii - 97.03, wave iv - 111.43, followed by the final wave v as well as the end of wave (C) at 94.12, this also mark the bottom of larger degree wave B. Under this count, major rise in wave C has commenced as an impulsive wave with minor wave III ended at 145.69, wave V is still in progress for further gain to 150.00. Having said that, this so-called wave V could well be the first leg of larger degree 5-waver wave C and this wave C should bring at least a retest of wave A top at 169.97 (July 2008).
Aussie Jumps on GDP; Gold at 1-Month High ahead of Risk Events
The Australian dollar rallied on upbeat GDP data while the greenback steadied after sharp declines this week. Upcoming key risk events tomorrow dampened risk appetite in the markets as investors were cautious ahead of the UK elections, the European Central Bank meeting, and the testimony to a Senate committee by former FBI Director James Comey. This helped support gold near seven-month highs.
The aussie was one of the best performing major currencies against the US dollar in the Asian session as it rose to a one-month high of $0.7543 from $0.7500. Markets were expecting a weaker GDP number but data showed the Australian economy grew 0.3% over the first quarter versus 0.2% anticipated and 1.7% in the year to March compared to a 1.5% rise that was forecast.
Sterling remained resilient ahead of the UK general election tomorrow and traded in a tight range against the dollar, close to the key $1.2900 level.
The euro has been moving sideways all week just below $1.1285. Focus is shifting to the ECB policy meeting tomorrow and expectations are for the central bank to have a more hawkish tone with regards to the Eurozone economy and may even hint that it is exiting from its quantitative easing program soon.
The dollar stabilized against the yen after a big sell-off yesterday and hovered near six-week lows of 109.20 yen. The greenback is being weighed by uncertainty around Thursday's testimony at a Senate Intelligence Committee hearing by James Comey, the former FBI Director who was fired by President Donald Trump. He is expected to testify whether Trump asked him to drop the FBI investigation into former national security adviser Michael Flynn.
Gold gained 1% yesterday to reach its highest level since early November at $1295.97 an ounce. Prices steadied in Asian trading today but the safe haven asset remains supported due to risk aversion and a broadly weaker dollar.
WTI oil prices rebounded to test the $48 a barrel level but gains were capped as the commodity is being put under pressure by tensions in the Middle East amongst oil producers due to a diplomatic rift with Qatar.
Trade Idea: AUD/USD – Buy at 0.7500
AUD/USD – 0.7556
Recent wave: Wave 5 ended at 1.1081 and major correction has commenced for fall to 0.7000 and then towards 0.6500-10
Trend: Near term down
Original strategy :
Buy at 0.7420, Target: 0.7570, Stop: 0.7360
Position: -
Target: -
Stop: -
New strategy :
Buy at 0.7500, Target: 0.7650, Stop: 0.7440
Position: -
Target: -
Stop:-
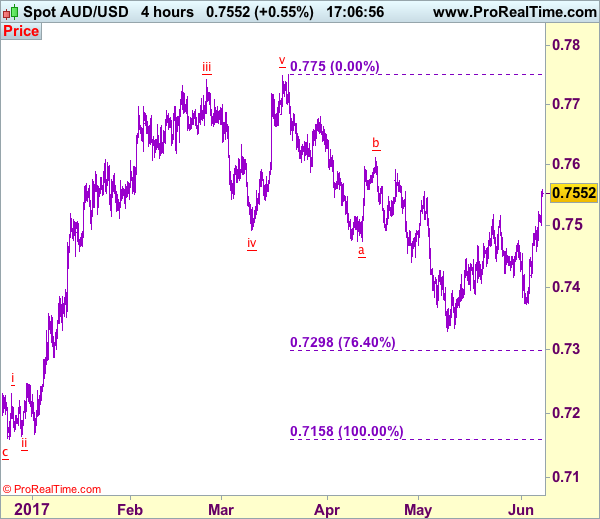
As aussie has surged again after brief pullback and the breach of indicated resistance at 0.7518 confirms our view that another leg of rise from 0.7329 low is underway and bullishness remains for this move to extend headway towards 0.7592, then test of resistance at 0.7611, however, break of latter level is needed add credence to this bullish count and encourage for subsequent upmove towards resistance at 0.7680 but price should falter below chart point at 0.7750.
In view of this, we are looking to buy aussie on dips as 0.75000 should limit downside and bring another rise. Below support at 0.7457 would abort and suggest top is possibly formed, bring weakness to 0.7415-20 but price should stay well above key support at 0.7372, bring another rebound later.
On the 4-hour chart, the move from 0.8066 is the wave 5 with i: 0.8860, ii: 0.8315, wave iii is an extended move ended at 1.0183, iv: 0.9706 and wave v has ended at 1.1081 (also the top of entire wave 5). The subsequent selloff is the major correction which is unfolding as ABC-X-ABC and 2nd A leg has ended at 0.8848, followed by a-b-c wave B which ended at 0.9758, hence, 2nd C wave is now in progress and indicated downside target at 0.7000 and 0.6950 had been met, so further fall to 0.6710-20 cannot be ruled out.
All Eyes On The Upcoming General Election
The market-focused UK general election date is tomorrow, Thursday, June 8th.
The left-wing Labour party's manifesto includes cancellations of university tuition, free school meals, increasing government spending on social benefits, nationalising and capping fares of train companies, water utilities and energy utilities.
In general, the Conservatives lead Labour across all ages, apart from the 18 to 34-year-old groups. As Labour focuses are on the welfare of the middle and lower classes which are widely welcomed by most citizens and young people.
Compared to Theresa May's Brexit negotiation stance of “no deal is better than a bad deal”, the Labour Party will strive to keep the UK a major driver in the single market and the custom union. The latter is beneficial to the UK trade; however, it will likely result in the UK paying a hefty bill to leave the EU.
The Labour Party plans to fund their plans by increasing government borrowing, corporate tax and income tax for those earning more than £80,000 a year. If the Labour Party wins the election, it will benefit most citizens. Nevertheless, we will likely see a surge in government deficit. In addition, some corporations and high earners will likely move abroad to avoid higher taxes.
The weather this week has been changing. If the weather on the election day (Thursday, June 8th) is poor, then it will likely reduce the turnout ratio of voters, especially for young age group, which will likely affect Labour's young vote.
GBP/USD has been oscillating in a range between 1.2850 – 1.2950, and EUR/GBP has been oscillating in a range between 0.8700 – 0.8760 over the past two days. Markets appear to hold ahead of the election unless there are further polls to be released.
Former FBI Director James B. Comey will testify under oath before the Senate Intelligence Committee on Thursday June 8th. He is expected to be questioned about whether Russia interfered in the US presidential election. Trump fired Comey in May as he was probing into the Former National Security Adviser, Michael Flynn. Trump fired Flynn in February after it was revealed that Flynn had conversations with Russian Ambassador Sergey Kislyak in December about lifting US sanctions.
On Tuesday, the dollar index hit a new post US presidential election low of 96.45. It was reported that Comey will likely reveal some details about his interaction with Trump related to the Russian leak scandal. If there the findings are adverse to Trump it will likely result in a falling USD. USD prospects appear to be under pressure during the investigation process.
Foreign Exchange Market Commentary: EUR/USD, USD/JPY, GBP/USD, GOLD, WTI CRUDE, DJIA, FTSE100, DAX
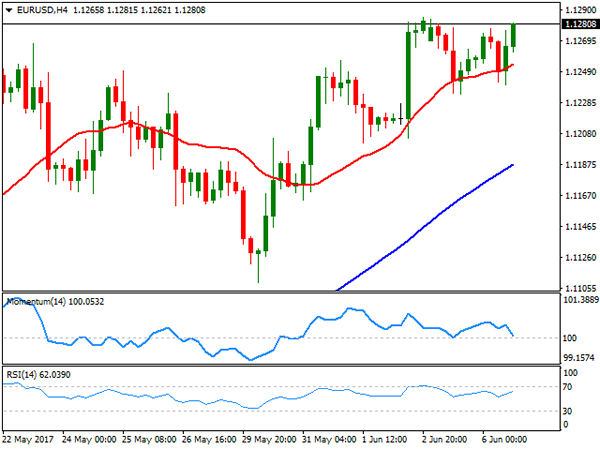
EUR/USD
Majors had quite an active day, although the common currency saw little action against the greenback. The EUR/USD pair traded within a tight 40 pips range this Tuesday, ending it higher, and a couple of pips below its yearly high. The cautious stance ahead of the ECB prevailed alongside with broad dollar's weakness. Risk aversion was a theme, following news that several Middle East countries cut ties with Qatar, accusing this last of backing religious extremism, and leading to equities' losses worldwide, and sharp gains in safe-havens yen and gold.
In the data front and specifically for the EUR/USD pair, the Euro Area released April Retail Sales figures, presenting a modest uptick in the month that missed expectations. Sales rose by 0.1% when compared to March, and by 2.5% when compared to a year earlier, while a local investors' confidence index up to 28.4 from previous 27.4 for June, in line with latest growth supportive data in the region.
The technical picture keeps favoring the upside, as intraday buying interest surged on approaches to the 20 SMA in the 4 hours chart, while the RSI indicator maintains its upward slope, currently at 59. The Momentum indicator in the same time frame eased towards its mid-line, rather reflecting the limited interest around the pair than suggesting an upcoming slide. Holding at highs, the pair needs to break through 1.1299, the high posted as an immediate reaction to US election outcome, to be able to extend its advance towards 1.1460 a long term strong static resistance.
Support levels: 1.1220 1.1180 1.1125
Resistance levels1.1300 1.1345 1.1390
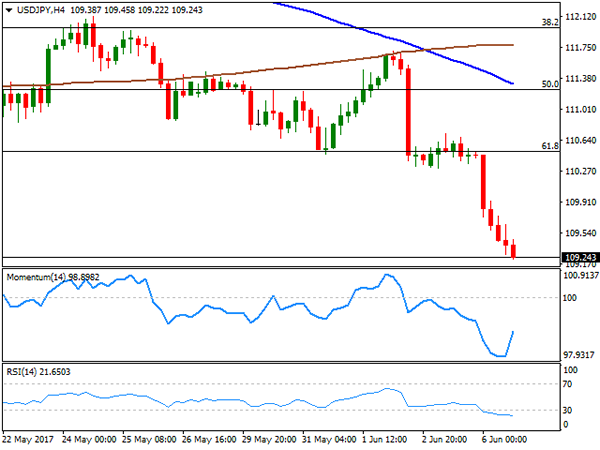
USD/JPY
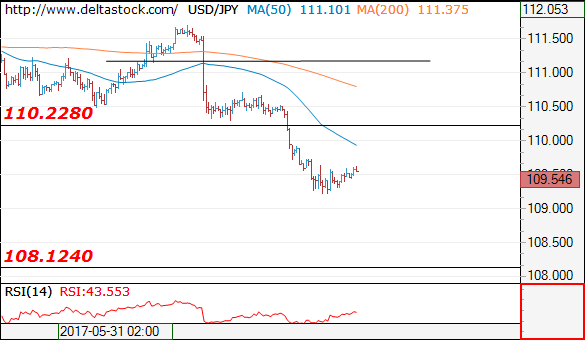
The USD/JPY pair entered a selling spiral this Thursday, trading at fresh 2-month lows ahead of the Asian opening near 109.20, with the Japanese yen benefited by a risk-averse environment. Tensions in the Middle East coupled with critical events later this week, which include former FBI director Comey testimony before the Senate intelligence committee. Bonds were on demand, resulting ht eh 10-year note benchmark falling down to 2.129% intraday, its lowest since the US presidential election last November. Japan will release its preliminary April leading index during the upcoming Asian session, although seems more than likely that the pair will continue to react to sentiment. Technically, the pair is now poised to retest this year low set last month at 108.12, although some consolidation could be expected ahead of another leg lower. In the 4 hours chart, the price is now developing well below its 100 and 200 SMAs, with the shortest accelerating below the largest, whilst the RSI indicator continues heading lower, despite being at 22, while the Momentum indicator turned strongly higher, still within positive territory, this last showing decreasing selling interest at this point.
Support levels: 109.20 108.85 108.50
Resistance levels: 109.75 110.10 110.50
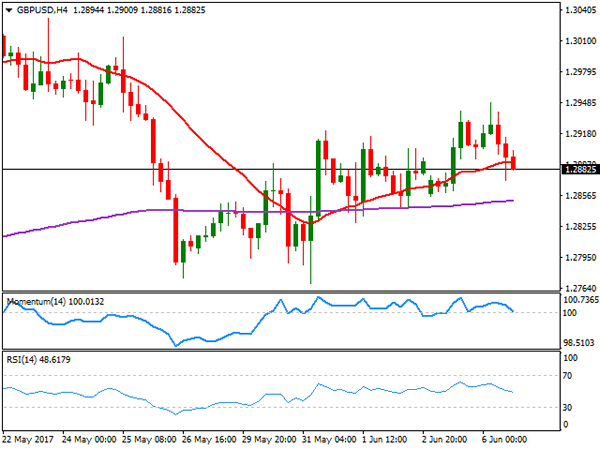
GBP/USD
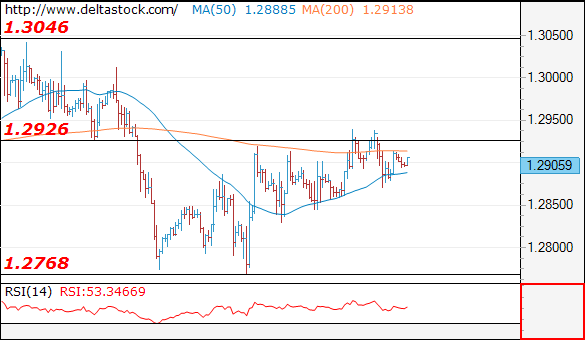
The GBP/USD pair retreated from a fresh weekly high of 1.2949 achieved early Asia to end the day in the red and in the 1.2880 region, flat for the week. Poll's headlines kept leading the way for Pound, with the latest showing that the Labour party keeps closing the gap on Conservatives, these lasts barely 1 point ahead on intention vote. Also, a YouGov opinion model showed that May's Conservative party is likely to fall 22 seats short of majority in the upcoming June 8th election, all of which weighs on Pound. If the slide is contained, is just because dollar's broad weakness. From a technical point of view, intraday readings favor the downside, given that in the 4 hours chart, the price has settled below its 20 SMA, whilst technical indicators are crossing their mid-lines, entering negative territory. The pair has an immediate support at 1.2840, a magnet level for these past two weeks, while a break below 1.2800 is required to confirm a new leg lower that can extend down to the 1.2750/60 price zone.
Support levels: 1.2840 1.2800 1.2760
Resistance levels: 1.2920 1.2950 1.3000
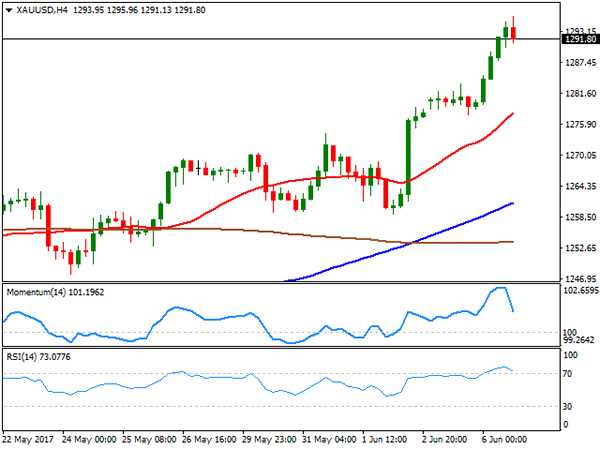
GOLD
Spot gold surpassed its previous 2017 high by a few cents this Tuesday, as political uncertainty fueled demand for the safe-haven commodity. Gold traded as high as $1,295.96 a troy ounce before retreating modestly, to settle at 1,291.40, still sharply higher on the day. Mounting geopolitical tensions in the Middle East alongside with cautious mood ahead of the upcoming US ex-FBI director Comey before the US Senate, favored the bright metal. Having stalled below the 1,300.00 threshold, the risk is clearly towards the upside according to technical readings, given that in the daily chart, the 20 SMA heads north well below the current level and above the 100 and 200 SMAs, whilst technical indicators turned north, with the RSI at a fresh 2-month high around 68. Shorter term, and according to the 4 hours chart, the upside is also favored, as the 20 SMA gathered upward momentum well below the current level, whilst technical indicators have eased from extreme overbought readings, but remain well into positive territory, and far from suggesting an upcoming downward corrective move.
Support levels: 1,287.80 1,276.60 1,266.90
Resistance levels: 1,295.90 1,303.10 1311.80
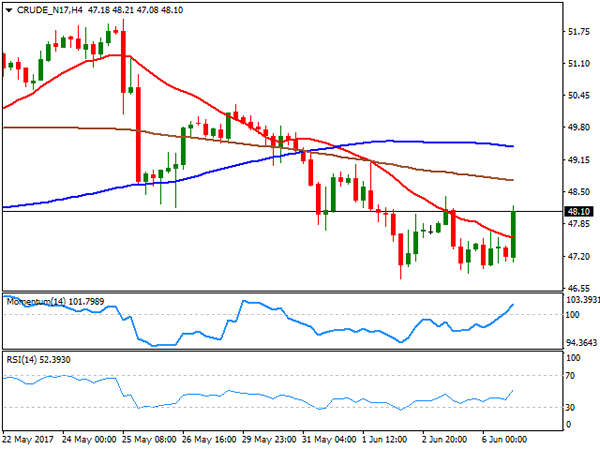
WTI CRUDE OIL
Crude oil prices edged higher on Tuesday, with West Texas Intermediate crude futures ending the day at $48.10 a barrel, as despite tensions in the Middle East, traders are looking forward, pricing in another weekly draw-down in oil stockpiles. The EIA report is expect to show a 3.4 million barrels' drop for the week ended June 2nd. In the meantime the US Energy Information raised its U.S. production outlook for 2018, according to a monthly report issued this Tuesday, up to 10.01 million barrels a day for the year, up 0.4% from the previous outlook, which should keep gains in check, despite the ongoing turmoil in the energy market. Technically, the daily chart shows that the recovery stalled below Monday's intraday high, whilst the price keeps developing far below its moving averages, as technical indicators consolidate within bearish territory, all of which maintains the risk towards the downside. In the 4 hours chart, the price settled above a bearish 20 SMA, but remains below the 100 and 200 SMAs, whilst technical indicators lost upward momentum after entering positive territory, indicating decreasing buying interest at this point.
Support levels: 47.90 47.20 46.65
Resistance levels: 48.60 49.30 50.10
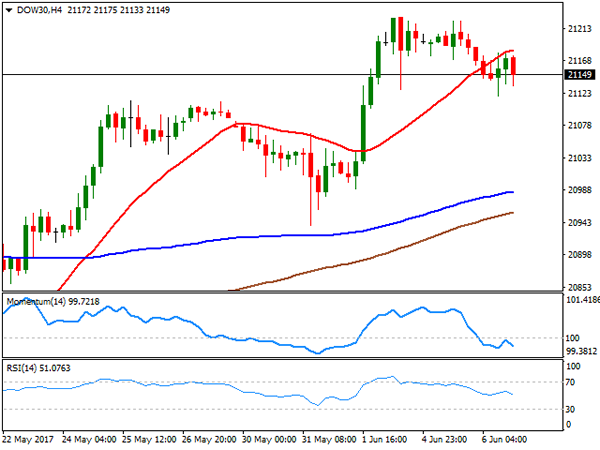
DJIA
US equities edged lower this Tuesday, weighed by political woes denting investors' mood and with retailers suffering the most. The Dow Jones Industrial Average lost 47 points and settled at 21.136.23, while the Nasdaq Composite lost 0.33%, to 6,257.06. The S&P lost 6 points and closed the day 2,429.33. Wall Street followed the lead of its overseas counterparts, down on Middle East tensions, weighed additionally by mounting concerns over Trump's leadership, ahead of former FBI director Comey testimony before a Senate special committee. Wall-Mart led declines within the Dow, shedding 1.67%, followed by Boeing that closed 1.12% lower. Exxon Mobile was the best performer, up 1.30%, followed by Chevron that added 0.3%. The daily chart for the Dow shows that technical indicators have retreated modestly, but are still well above their mid-lines, whist the index keeps developing above its moving averages. In the 4 hours chart, the scale leans towards the downside, as technical indicators head south below their mid-lines, whilst intraday advances were contained by selling interest around the 20 SMA.
Support levels: 21,125 20,080 20,041
Resistance levels: 21,184 21,228 21,260
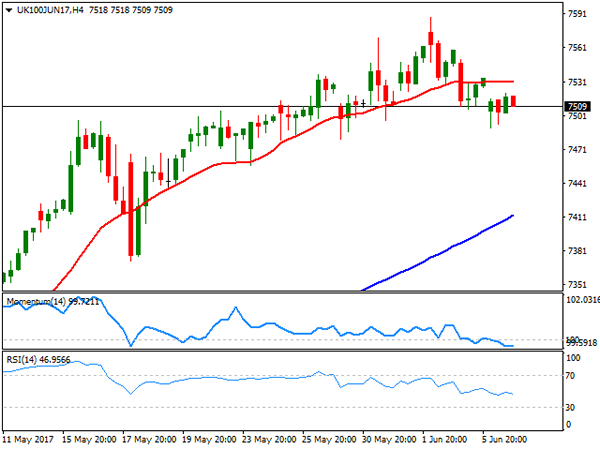
FTSE100
The FTSE 100 closed the day virtually unchanged at 7,524.95, down 0.01%. Sharp losses from ConvaTec, down by 3.95%, after two investors sold a stake in the firm and Burberry that shed 3.7% after HSBC cut its rating on the company to "reduce" from "hold" were offset by soaring mining-related equities. Fresnillo topped gainers list, up 3.21%, followed by Randgold Resources that added 2.67%, and Anglo American, up by 1.85%. A weaker Pound by the end of the day, help maintaining the index afloat. The daily chart for the index shows that it fall further towards a bullish 20 SMA, holding near its weekly lows, as technical indicators keep retreating within positive territory, in line with further declines. In the 4 hours chart, technical readings present a neutral-to-bearish stance, as the index stands right below a horizontal 20 SMA, whilst technical indicators present modest bearish slopes within neutral territory.
Support levels: 7,492 7,457 7,405
Resistance levels: 7,541 7,588 7,620
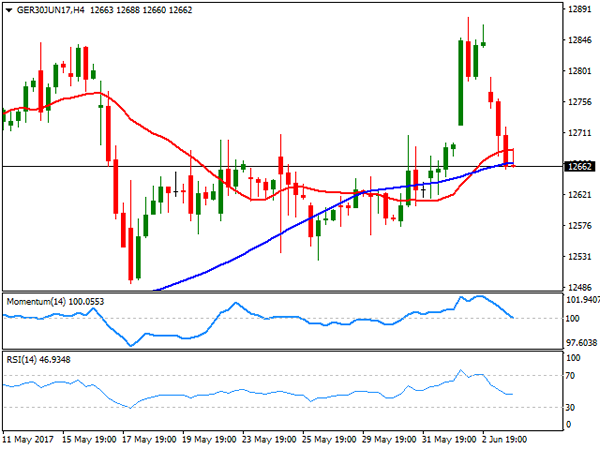
DAX
The German DAX fell 131 points or 1.04%, ending the day at 12,690.12 as risk aversion led equity traders ever since Monday's headlines announcing geopolitical woes in the Middle East. Healthcare equities were among the worst performers, while mining-related ones led advancers. Within the DAX, only five components closed with gains, with RWE AG leading winners' list with a 2.99% advance, followed by E.ON that added 2.22%. Volkswagen led decliners with a 2.07% lost, followed by Deutsche Bank that shed 1.98% and Bayer, down 1.80%. The daily chart for the index shows that it extended its slide in after hours trading, now standing a few pips below a horizontal 20 DMA, whilst the RSI indicator heads south around 53 as the Momentum retreats from its 100 line, both anticipating additional declines. Shorter term, and according to the 4 hours chart, the downward risk is also present, as the index is trading right below its 20 and 100 SMAs, whist technical indicators are crossing their mid-lines into negative territory.
Support levels: 12,620 12,575 12,521
Resistance levels: 12,707 12,760 12,810
Daily Technical Analysis: EUR/USD Flat Top Ascending Triangle Consolidation
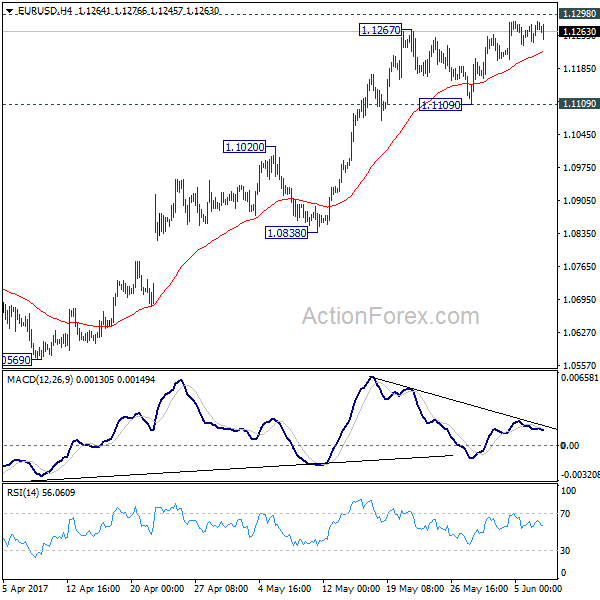
The EUR/USD has been one of the slowest moving pairs recently. The ATR of 69 for the last 14 days suggests easy going price where investors and traders might possibly waiting for the breakout. Previous bullish SHS pattern (inverted head and shoulders) made the pair spike to 1.1284 where it formed a flat top ascending triangle. By it's standard definition, the triangle s bullish and bulls could go for a triangle breakout if it happens. The breakout of 1.1290 should target 1.1320-30 zone (D H5/W H3) and eventually on a 4h close above 1.1320 the target is 1.1375. Because the EUR/USD is kept in a consolidation mode inside a bullish triangle a break below 1.1225 would possibly negate a bullish scenario.
EUR/USD Daily Outlook
Daily Pivots: (S1) 1.1250; (P) 1.1267 (R1) 1.1294; More....
EUR/USD lost much moment with 4 hour MACD crossed below signal line, ahead of 1.1298 key resistance. Intraday bias is turned neutral. Further rise will remain in favor as long as 1.1109 support holds. Decisive break of 1.1298 will carry larger bullish implication and target 1.1615 resistance next. Nonetheless, we'd stay cautious on rejection from 1.1298. Break of 1.1109 will indicate short term topping and turn bias back to the downside.
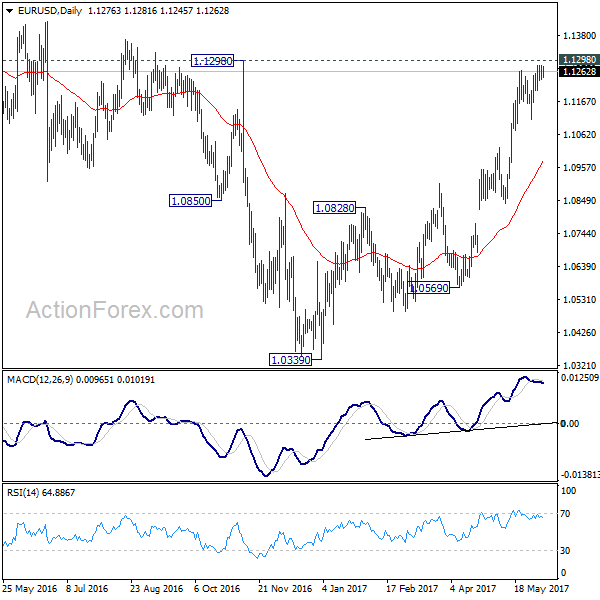
In the bigger picture, the case for medium term reversal continues to build up with EUR/USD staying far above 55 week EMA (now at 1.0888). Also, bullish convergence condition is seen in weekly MACD. Focus will now be on 1.1298 key resistance. Rejection from there will maintain medium term bearishness and would extend the whole down trend from 1.6039 (2008 high). However, firm break of 1.1298 will indicate reversal. In such case, further rally would be seen back to 1.2042 support turned resistance next.
Forex Technical Analysis: EUR/USD, USD/JPY, GBP/USD
EUR/USD
Current level - 1.1265
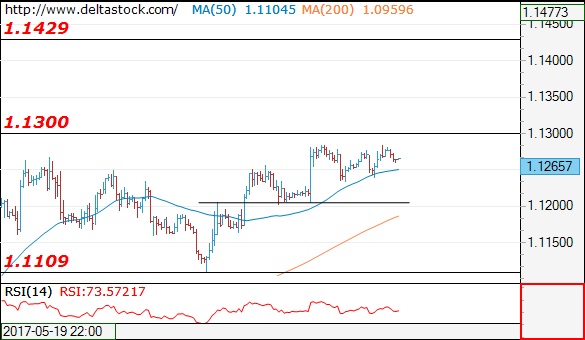
The pair is still struggling below 1.1300 major resistance and another dip to 1.1205 minor support is possible, before breaking higher, towards 1.1430 mark. An eventual slide below 1.1205 will challenge 1.1108 low.
| Resistance | Support | ||
| intraday | intraweek | intraday | intraweek |
| 1.1300 | 1.1360 | 1.1205 | 1.1022 |
| 1.1430 | 1.1610 | 1.1165 | 1.0838 |
USD/JPY
Current level - 109.54
The downtrend is intact, with a major resistance at 110.20 and the slide is targeting 108.12 low.
| Resistance | Support | ||
| intraday | intraweek | intraday | intraweek |
| 110.20 | 114.30 | 109.20 | 109.40 |
| 112.10 | 115.60 | 108.12 | 108.12 |
GBP/USD
Current level - 1.2905
Yesterday's minor reversal at 1.2940 signals a negative bias, for a break through 1.2850, towards 1.2770 area.
| Resistance | Support | ||
| intraday | intraweek | intraday | intraweek |
| 1.2940 | 1.3120 | 1.2850 | 1.2770 |
| 1.2930 | 1.3500 | 1.2770 | 1.2610 |
GBP/USD Daily Outlook
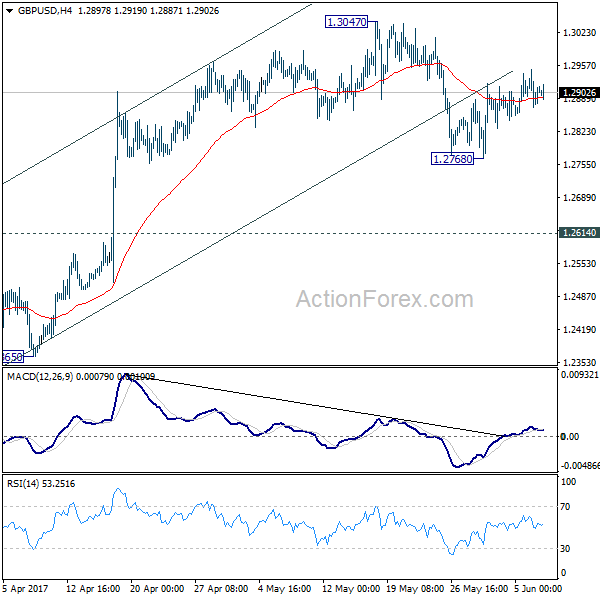
Daily Pivots: (S1) 1.2868; (P) 1.2909; (R1) 1.2946; More...
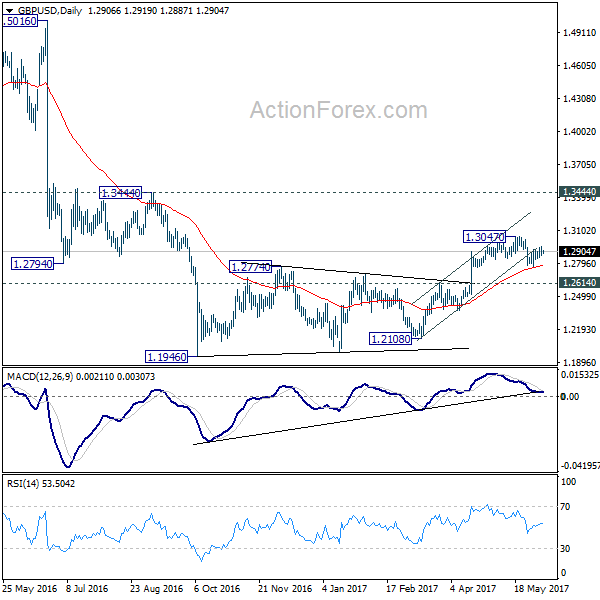
Intraday bias in GBP/USD is turned neutral again with 4 hour MACD dropped below signal line. On the downside. below 1.2768 minor support will extend the fall from 1.3047 to 1.2614 resistance turned support. Decisive break there should confirm completion of the consolidation pattern from 1.1946 and resume the larger down trend through this low. On the upside, break of 1.3047 will extend the correction with another rise towards 1.3444 key resistance.
In the bigger picture, fall from 1.7190 is seen as part of the down trend from 2.1161. The rejection from 55 week EMA is maintaining bearishness in the pair. Also, at this point, as long as 1.3444 resistance holds, fall from 1.7190 is still expected to continue. Break of above mentioned 1.2614 support will affirm this bearish case.
USD/CHF Daily Outlook
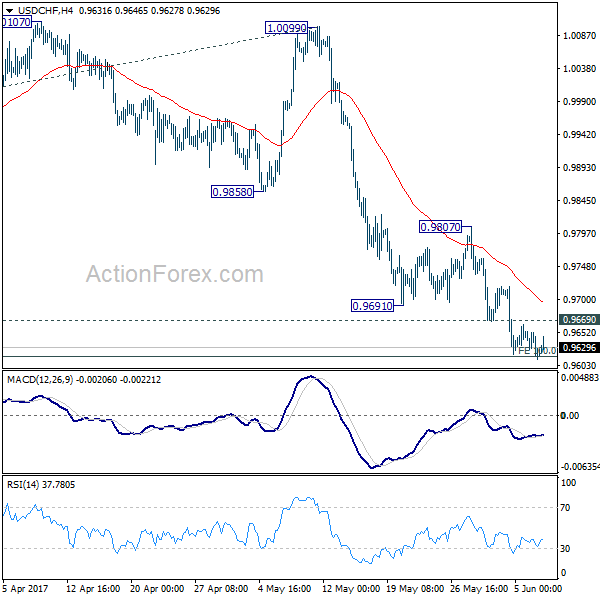
Daily Pivots: (S1) 0.9603; (P) 0.9628; (R1) 0.9643; More.....
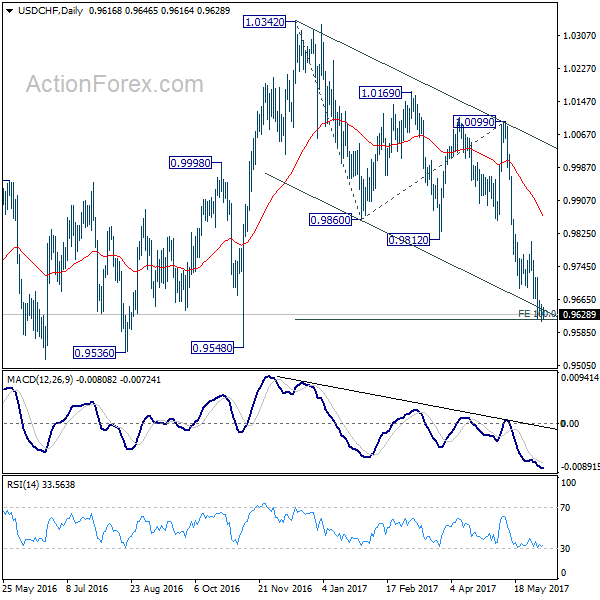
USD/CHF lose some downside momentum as it hits 100% projection of 1.0342 to 0.9860 from 1.0099 at 0.9617. But with 0.9669 minor resistance intact, deeper fall is still expected. We'd start to look for bottoming signal again as it approaches 0.9443 key support level. On the upside, above 0.9669 minor resistance will now indicate short term bottoming. In such in case, intraday bias will be turned back to the upside for 0.9807 resistance and above.
In the bigger picture, USD/CHF is still bounded in medium term range of 0.9443/1.0342 for the moment. Consolidative trading would likely continue and medium term outlook remains neutral. Break of 1.0342 key resistance is needed to confirm underlying bullish momentum in the pair. Meanwhile, downside attempts should be contained by 0.9443 key support level. However, sustained break of 0.9443 will carry larger bearish implication and target 0.9 handle.