Sample Category Title
GOLD Riding Within Uptrend Channel, SILVER Testing 61.8% Fibonacci Retracement, CRUDE OIL Strong Volatility.
GOLD Riding within uptrend channel.
Gold is pushing higher within uptrend channel. Hourly support is located at 1246 (18/05/2017 low). Stronger support is given at 1195 (10/03/2017 low). Expected to show further upside pressures.
In the long-term, the technical structure suggests that there is a growing upside momentum. A break of 1392 (17/03/2014) is necessary ton confirm it, A major support can be found at 1045 (05/02/2010 low).
SILVER Testing 61.8% Fibonacci retracement.
Silver declines. Strong support is given at 15.63 (20/12/2017 low). Closest support is given at 16.20 (04/05/2017 low). Key resistance is given at a distance at 19.00 (09/11/2017 high). Expected to push back towards 61.8% Fibonacci retracement around 17.75.
In the long-term, the death cross indicates that further downsides are very likely. Resistance is located at 25.11 (28/08/2013 high). Strong support can be found at 11.75 (20/04/2009).
CRUDE OIL Strong volatility.
Crude oil is now moving sideways after the recent collapse from $52. Support is given at a distance 43.76 (05/05/2017 low). The technical structure suggests decline towards 43.76.
In the long-term, crude oil has recovered after its sharp decline last year. However, we consider that further weakness are very likely. Strong support lies at 24.82 (13/11/2002) while resistance can now be found at 55.24 (03/01/2017 high). 07 June 2017 DAILY
EUR/CAD Elliott Wave Analysis
EUR/CAD – 1.5075
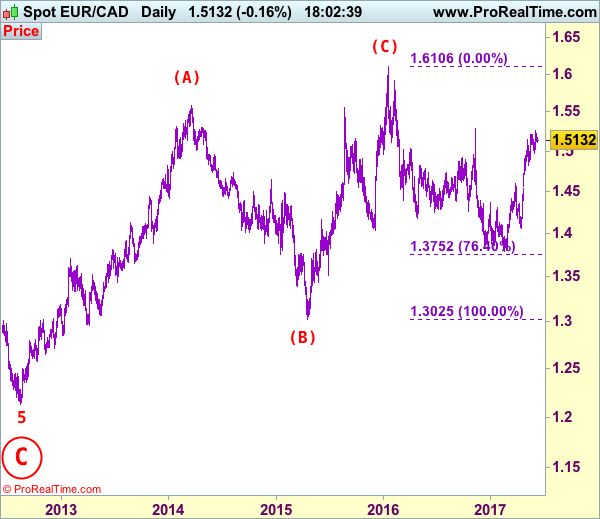
EUR/CAD: Wave 4 ended at 1.4380 and wave 5 as well as circle wave C has possibly ended at 1.2129, major (A)-(B)-(C) correction has commenced and indicated target at 1.6000 had been met.
Although the single currency did find renewed buying interest at 1.4969 and has resumed recent upmove in line with our bullish expectation (our long position entered at 1.5000 met target at 1.5250), lack of follow through buying and current retreat from 1.5259 suggest consolidation below this level would be seen and pullback to 1.5000 cannot be ruled out, however, break of support at 1.4969 is needed to signal top is formed, bring retracement of recent upmove to 1.4900 but support at 1.4825 (previous 4th of a lesser degree) should hold from here.
Our latest preferred count is that larger degree wave [C] from 1.3289 as well as circle wave B ended at 1.7509 in Dec 2008 with (A): 1.6325, (B): 1.4719 followed by wave (C) at 1.7509, hence circle wave C is unfolding with wave 1 ended at 1.5186 (diagonal wave 1), wave 2 at 1.6096, impulsive wave 3 has ended at 1.2451, followed by wave 4 at 1.4380, in view of recent strong rebound, we are now treating the wave 5 as well as larger degree circle wave C has ended at 1.2129, hence (A)-(B)-(C) correction has commenced from there with impulsive wave (C) now unfolding and indicated initial upside target at 1.6000 had been met and reckon 1.6500 would hold.
On the upside, whilst recovery to 1.5160-70 cannot be ruled out, upside should be limited to 1.5200-10 and bring further consolidation below 1.5259. Only a break of this level would revive bullishness and signal recent upmove has resumed for headway to 1.5350 and possibly 1.5400 but price should falter well below 1.5500, risk from there is seen for a retreat later.
Recommendation: Long entered at 1.5000 met target at 1.5250 with 250 points profit.
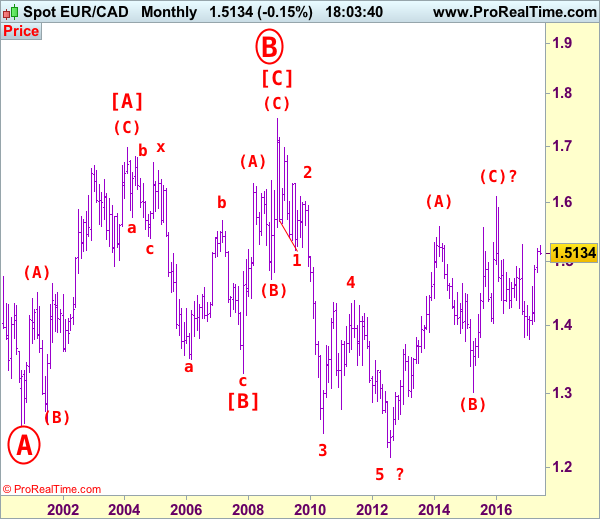
On the bigger picture, our long-term count on the monthly chart is that a big sideways consolidation from 2000 low of 1.2557 has possibly ended at 1.7509 as circle wave B with [A]: 1.6976 ( (A): 1.4513, (B): 1.2612, (C): 1.6976), wave [B]: 1.3289 is a double three with 1st a-b-c: 1.5384, x: 1.6709 and 2nd a-b-c: 1.3289. As indicated above, the wave [C] has ended at 1.7509. The selloff from there is now unfolding which itself should be labeled as an impulsive wave with wave 1: 1.5186 (diagonal wave 1), followed by wave 2: 1.6096 and wave 3: 1.2451, wave 4: 1.4380, wave 5 as well as larger degree circle wave C has possibly ended at 1.2129 and major correction has possibly commenced for retracement of recent decline towards 1.4000, then 1.4180-90 (38.2% Fibonacci retracement of 1.7509-1.2129). Below said support at 1.2129 would risk weakness to psychological support at 1.2000 and then 1.1851 (50% projection of 1.7509-1.2451 measuring from 1.4380) but reckon 1.1500 would remain intact, bring reversal later.
Market Update – European Session: Markets Await Super Thursday
Notes/Observations
'Super Thursday' events loom (UK elections, ECB, former FBI chief Comey testimony)
China FX Reserves rise for the 4th straight increase for its longest streak since Jun 2014)
Germany Factory Orders decline sharply in Apr; likely impacted by Easter
India's RBI keeps policy steady (as expected) and maintains its neutral bias
Overnight
Asia:
Australia Q1 GDP YoY reading beats expectations (Y/Y: 1.7% v 1.6%e) but still the slowest annual pace since 2009
Europe:
PM May: ready to change UK human rights laws in order to do more to fight extremism
Opinium UK general election poll: Conservatives 43% (unchanged), Labour 36% (-1)
Ashcroft UK election model: UK conservatives to win total 357 seats in Parliament for a 64 seat majority (**Note: compares with 60 projected on June 2nd)
Americas:
S&P affirmed United States of America sovereign rating at AA+; outlook remains stable
US Treasury Sec Mnuchin: pleased with the direction the US is heading with China; US must increase exports to address imbalance in trade with China. Market access to China is definitely an issue; seeks a reciprocal trade relationship
Energy:
Weekly API Oil Inventories: Crude: -4.6M v -8.7M prior (3rd straight draw)
Russia Energy Min Novak: Russia doesn't plan to call for extraordinary meeting with OPEC over Qatar dispute; OPEC/non-OPEC deal should continue despite problems between the Gulf states
Economic Data
(DE) Germany Apr Factory Orders (miss) M/M: -2.1% v -0.3%e; Y/Y: 3.5% v 4.7%e
(RO) Romania Q1 Preliminary GDP (2nd reading) Q/Q: 1.7% v 1.7%e; Y/Y: 5.7% v 5.7%e
(CH) Swiss May Foreign Currency Reserves (CHF): 693.7B v 696.6B prior
(UK) May Halifax House Price (beat) M/M: +0.4% v -0.2%e; 3M/Y: 3.3% v 3.0%e
(SE) Sweden Apr Industrial Production M/M: -2.4% v +0.3%e; Y/Y: 0.8% v 4.1%e
(TW) Taiwan May Trade Balance: $3.5B v $3.2Be, Exports Y/Y: 8.4% v 7.0%e, Imports Y/Y: 10.2% v 9.6%e
(CH) China May Foreign Reserves (beat): $3.054T v $3.046Te (4th straight rise and longest streak since Jun 2014)
(IN) India Central Bank (RBI) left its Repurchase Rate unchanged at 6.25%(as expected)
Fixed Income Issuance:
(VN) Vietnam sold total VND4.13T in 5-year, 7-year, 20-year and 30-year bonds
(EU) ESM opened book to sell 1.8% Nov 2046 bond via syndicate; guidance seen 20bps to mid-swaps
(IT) Italy Debt Agency (Tesoro) opened its book to sell new Mar 2048 BTP bond via syndicate; guidance seen +12bps to mid-swaps
(IN) India sold total INR140B vs. INR140B indicated in 3-month and 12-month Bills
(DK) Denmark sold total DKK3.35B in 2020 and 2027 bonds
(SE) Sweden sold SEK10B vs. SEK10B indicated in 6-month Bills; Avg Yield: -0.7361% v -0.6603% prior; bid-to-cover: 3.48x v 1.74x prior
SPEAKERS/FIXED INCOME/FX/COMMODITIES/ERRATUM
Equities
Indices [Stoxx50 flat at 3555, FTSE +0.2% at 7539, DAX -0.1% at 12681, CAC-40 +0.3% at 5287, IBEX-35 -0.4% at 10838, FTSE MIB +0.5% at 20855, SMI -0.1% at 8899, S&P 500 Futures flat]
Market Focal Points/Key Themes European indices trade mixed this morning, with out performance in Italy, and France whilst the Dax and Swiss SMI and IBEX trade slightly lower. Recent speculation over the future of Banco Popular was resolved following its acquisition by Santander, with a €7B capital raise announced to help fund the acquisition. Else where European utilities trade at 1 and half year highs, up 22% since the November lows after the German constitutional court ruled against the Nuclear fuel tax with companies expected to be refunded taxes paid plus interest. Notable risers include RWE, EON and EDF.
Equities
Industrials: [RPC [RPC.UK] -2.5% (FY Earnings) ]
Financials: [ Santander [SAN.ES] -2.4% (To acquire Banco Popular; To raise €7B in capital raise to fund transaction), Workspace Grp [WKP.UK] +2.3% (Earnings)]
Healthcare: [Covestro [1COV.DE] -4.4% (Bayer to sell 17.25M shares, reduces stake to 44.8%), Astrazeneca [AZN.UK] -1.5% (Signs agreement with Grünenthal for rights to Zomig; Grünenthal will pay $200M upon completion)]
Energy: [RWE [RWE.DE] +4.4%, EON [EOAN.DE] +4.4%, EDF [EDF.FR] +1.2% (German Constitutional Court strikes down nuclear fuel tax; companies to receive interest on paid taxes)]
Speakers
OECD updated its Economic Outlook which raised its 2017 Global GDP forecasts from 3.3% to 3.5% while maintaining the 2018 forecast at 3.6%
Norway FSA: Signs that mainland activity was picking up but vulnerability of financial system had risen. Development in consumer loans was a concern
India Central Bank (RBI) Policy Statement noted that its stance was neutral.
India Central Bank (RBI) Gov Patel post rate decision press conference noted that Apr inflation surprised to the downside but awaited for greater clarity on data (refers to maintaining its neutral stance)
China FX regulator SAFE noted that it saw stabilizing capital flows: Forex supply and demand are basically balanced. USD currency depreciation and asset price rise were among reasons for rising forex reserves
China PBOC adviser Huang Yiping urged forex reform in China
Currencies
Overall FX price action remained subdue ahead of 'super Thursday' which will UK Parliamentary elections, ECB rate decision and former FBI chief Comey testimony in Congress. Gold held near 7-month high as political worries buoyed safe-haven demand.
EUR/USD was just off its 7-month high and holding around 1.1250 area. Dealers are focused on any tweaking of the ECB's forward guidance which currently stands that rates to stay low or lower beyond the forecast horizon period.
USD/JPY was slightly softer at 109.20. Dealers noted that the recent yen's strength was being driven by risk and safe-haven flows. The lower US yields are also a catalyst after reports that China could be ready to buy more Treasuries as yuan currency stabilized.
Fixed Income
Bund futurestrade at 164.92 up 3 ticks, after hitting a new high at 165.03 and appears to well supported at the moment. Resistance lies near the 165.95 level followed by 167.79. A break of the 162.65 support level could see lows target 159.96 followed by 157.50.
Gilt futurestrade at 129.43 down 4 ticks, as investors take cover ahead of Thursday's election. Last week's decline fell back below both the 129.00 handle and the 129.14 April 18th high. Price finds key support at the 128.27 support level. An acceleration lower could test the 127.43 region. Resistance remains the noted 129.00/129.14 region, then 129.75 followed by 130.28.
Wednesday's liquidityreport showed Tuesday's deposits dropped rose to €597.6B from €592.6B prior. Use of the marginal lending facility increased to €285M from €221M prior.
Corporate issuancesaw over $5.65B come to market via 6 issues headlined by Citibank $2.5B in an 2-part 3-year notes offering and Coach $1B in a 2-part unsecured senior note offering
Looking Ahead
(IL) Israel May Foreign Currency Balance: No est v $105.1B prior
(FI) Finland announces upcoming RAGB bond for Jun 14th
(NL) Netherlands Debt Agency (DSTA) announces upcoming DSL auction for Jun 13th
05:30 (ZA) South Africa May Sacci Business Confidence: No est v 94.9 prior
05:30 (DE) Germany to sell €3.0B in 0% Apr 2022 BOBL
06:00 (PL) Poland Central Bank (NBP) Interest Rate Decision: Expected to leave Base Rate unchanged at 1.50%
06:00 (IE) Ireland Apr Property Prices M/M: No est v 0.1% prior; Y/Y: No est v 9.6% prior
06:00 (RU) Russia to sell combined RUB35B in 2024 and 2033 OFZ bonds
06:45 (US) Daily Libor Fixing
07:00 (UK) Prime Minister's Question Time in House of Commons
07:00 (US) MBA Mortgage Applications w/e Jun 2nd: No est v -3.4% prior
07:00 (BR) Brazil May FGV Inflation IGP-DI M/M: -0.6%e v -1.2% prior; Y/Y: 1.0%e v 2.7% prior
07:45 (DE) German Chancellor Merkel on EU matters in Berlin
08:00 (PL) Poland May Official Reserves: No est v $109.4B prior
08:00 (HU) Hungary Central Bank (NBH) May Minutes
08:15 (UK) Baltic Dry Bulk Index
08:30 (CA) Canada Apr Building Permits M/M: +3.0%e v -5.8% prior
08:30 (CL) Chile May Trade Balance: $0.5Be v $0.5B prior, Total Exports: $5.4Be v $5.0B prior, Total Imports: $5.0Be v $4.5B prior, Copper Exports: No est v $2.2B prior
08:30 (CL) Chile May International Reserves: No est v $39.0B prior
09:00 (RU) Russia May Official Reserve Assets: $404.8Be v $401B prior
09:00 (CL) Chile Apr Nominal Wage M/M: No est v 0.8% prior; Y/Y: 4.2%e v 4.3% prior
09:30 (SE) Sweden Central bank (Riksbank) Dep Gov Skingsley participates in panel debate
10:00 (PL) Poland Central Bank Gov Glapinski to hold post rate decision press conference
10:30 (US) Weekly DOE Crude Oil Inventories
12:00 (CA) Canada to sell 2-Year Bonds
15:00 (US) Apr Consumer Credit: $15.0Be v $16.4B prior
EUR/JPY Downside Pressures, EUR/GBP Fading, EUR/CHF Continued Weakness.
EUR/JPY Downside pressures.
EUR/JPY is trading lower. Hourly support is given at 122.56 (18/05/2017 low). Hourly resistance can be found at 125.82 (16/05/2017 high). Major support is given at 114.90 (18/04/2017low).
In the longer term, the technical structure validates a medium-term succession of lower highs and lower lows. As a result, the resistance at 149.78 (08/12/2014 high) has likely marked the end of the rise that started in July 2012. Strong support at 94.12 (24/07/2012 low) looks nonetheless far away.
EUR/GBP Fading.
EUR/GBP's bullish momentum is fading. The technical structure had turned positive since the pair has broken resistance at 0.8530 (25/04/2017 low). Strong support can be found at 0.8304 (05/12/2017 low). Expected to see a further bullish breakout towards resistance at 0.8787 (13/03/2017 high).
In the long-term, the pair has largely recovered from recent lows in 2015. The technical structure suggests a growing upside momentum. The pair is trading above from its 200 DMA. Strong resistance can be found at 0.9500 psychological level.
EUR/CHF Continued weakness.
EUR/CHF is trading lower. The pair has broken support given at 1.0866 (18/05/2017 low). We believe that the medium-term pattern suggests us to see continued bearish pressures towards hourly support that can be found at 1.0792 (03/05/2017 low).
In the longer term, the technical structure is mixed. Resistance can be found at 1.1200 (04/02/2015 high). Yet,the ECB's QE programme is likely to cause persistent selling pressures on the euro, which should weigh on EUR/CHF. Supports can be found at 1.0184 (28/01/2015 low) and 1.0082 (27/01/2015 low).
AUD/USD Elliott Wave Analysis
AUD/USD – 0.7562
AUD/USD – Wave 5 of C and (B) has possibly ended at 1.1081
Aussie found decent demand at 0.7372 and has staged a stronger-than-expected rebound, the breach of previous resistance at 0.7518 signals the fall from 0.7750 has ended at 0.7329 and mild upside bias is seen for further gain towards resistance at 0.7611, however, break there is needed to retain bullishness and signal the fall from 0.7750 has ended there, bring further gain towards another previous resistance at 0.7680 but price should falter below said resistance at 0.7750.
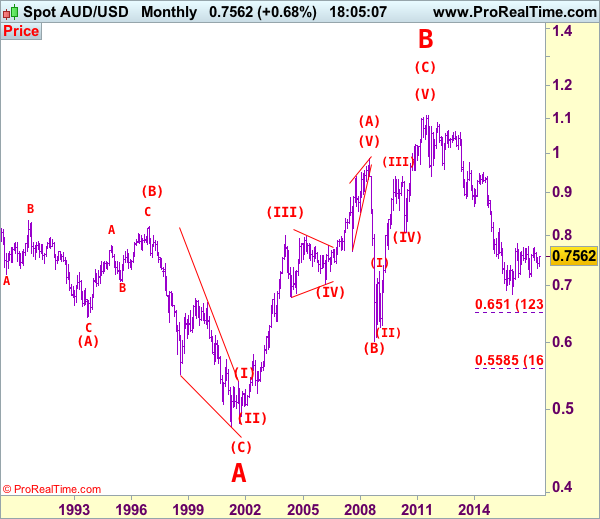
We are keeping our count that top has been formed at 1.1081 (wave 5 of V) and major correction (A-B-C-X-A-B-C) has commenced, indicated downside targets at 0.7945 (61.8% Fibonacci retracement of entire rise from 0.6007-1.1081) and 0.7750 had been met and downside bias is seen for further weakness to 0.6800, then 0.6700 but reckon 0.6500 would hold from here.
Our preferred count is that the rally from 0.6007 to 0.7270 (7 Jan 2009) is marked as wave A, the retreat to 0.6248 (2 Feb 2009) is wave B and the subsequent upmove is labeled as wave C with wave (iii) and wave (iv) ended at 0.8265 and 0.7700 respectively and wave (v) as well as 3 ended at 0.9407, then wave 4 ended at 0.8066 (instead of 0.8578). The wave 5 has met our indicated projection target of 1.1060 and could ended at 1.1081, this level is now treated as the peak of wave (C) as well as larger degree wave B, hence major fall in wave C has commenced, our initial downside target at psychological support at 0.7000 has just been met and further weakness to 0.6500 would be seen later.
On the downside, whilst pullback to 0.7500 cannot be ruled out, reckon downside would be limited to 0.7455-60 and bring another rise later. Only below support at 0.7415 would abort and suggest top is possibly formed, bring weakness towards said strong support at 0.7372 which is likely to hold from here. Looking ahead, a break below this support is needed to signal the rebound from 0.7329 has ended and revive bearishness for retest of this level later.
Recommendation: Exit short entered at 0.7490 and stand aside.
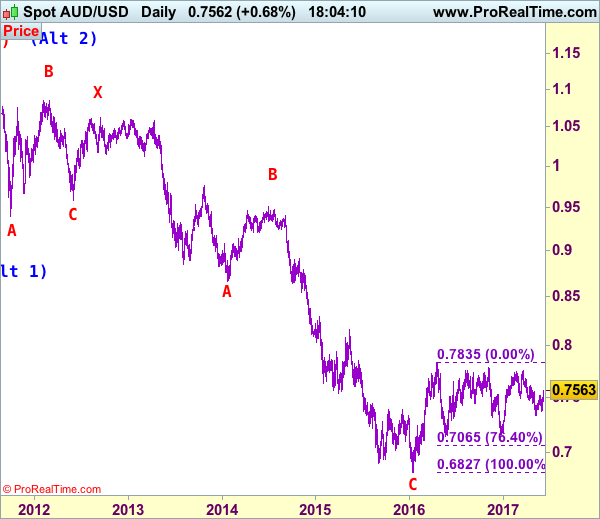
Our alternate count on the daily chart treated the top formed in 2008 at 0.9851 could be a larger degree wave I and was followed by a deep and sharp correction in wave II to 0.6007 and wave III is unfolding from there.
The long-term uptrend started from 0.4775 (2 Apr 2001) with an impulsive structure. Wave I is labeled as 0.4775 to 0.9851 (15 Jul 2008), wave II has ended at 0.6007 (Oct 2008) and wave III is still in progress which may extend further gain to 1.1265.
USD/CHF Heading Lower, USD/CAD Edging Lower, AUD/USD Strong Upside.
USD/CHF Heading lower.
USD/CHF continues its decline below support given at 0.9692 (22/05/2017 low). Strong resistance is given at 1.0107 (10/04/2017 high). Expected to show continued weakness towards hourly support at 0.9550 (09/11/2017 low).
In the long-term, the pair is still trading in range since 2011 despite some turmoil when the SNB unpegged the CHF. Key support can be found 0.8986 (30/01/2015 low). The technical structure favours nonetheless a long term bullish bias since the unpeg in January 2015.
USD/CAD Edging lower
USD/CAD is trading below 1.3500. The pair has exited short-term uptrend channel. Hourly support can be found at 1.3424 (28/05/2017 low) then 1.3388 (25/01/2017 high). Expected to show continued very short-term bearish pressures.
In the longer term, there is now a death cross with the 50 dma crossing below the 200 dma indicating further downside pressures. Strong resistance is given at 1.4690 (22/01/2016 high). Long-term support can be found at 1.2461 (16/03/2015 low).
AUD/USD Strong upside.
AUD/USD is pushing higher since the pair has failed to reach hourly support given at 0.7329 (09/05/2017 low). As long as prices remain below resistance at 0.7608 (17/04/2017 high), there are nonetheless strong downside risks.
In the long-term, we are waiting for further signs that the current downtrend is ending. Key supports stand at 0.6009 (31/10/2008 low) . A break of the key resistance at 0.8295 (15/01/2015 high) is needed to invalidate our long-term bearish view.
EUR/USD Stalling Below 1.1300, GBP/USD Sideways Price Action, USD/JPY Continued Bearish Pressures.
EUR/USD Stalling below 1.1300.
EUR/USD is consolidating below strong resistance given at 1.1300 (09/11/2017 high). Hourly support is given at 1.1110 (22/05/2017 low) has been broken. Stronger support lies at 1.0842 (11/05/2017 low) and key support is given at 1.0494 (22/02/2017 low). Expected to show continued bullish pressures.
In the longer term, the death cross late October indicated a further bearish bias. The pair has broken key support given at 1.0458 (16/03/2015 low). Key resistance holds at 1.1714 (24/08/2015 high). Expected to head towards parity.
GBP/USD Sideways price action.
GBP/USD keeps on bouncing from hourly support given at 1.2757 (21/04/2017 low). Hourly resistance lies at 1.3046 (18/05/2017 high). Expected to show continued bullish pressures.
The long-term technical pattern is even more negative since the Brexit vote has paved the way for further decline. Long-term support given at 1.0520 (01/03/85) represents a decent target. Long-term resistance is given at 1.5018 (24/06/2015) and would indicate a long-term reversal in the negative trend. Yet, it is very unlikely at the moment.
USD/JPY Continued bearish pressures.
USD/JPY is trading lower. The road seems wide open towards strong support located at 108.13 (17/04/2017 low). Hourly resistance is given at 112.13 (24/05/2017 high). Other key supports lie at a distance 106.04 (11/11/2016 low).
We favor a long-term bearish bias. Support is now given at 96.57 (10/08/2013 low). A gradual rise towards the major resistance at 135.15 (01/02/2002 high) seems absolutely unlikely. Expected to decline further support at 93.79 (13/06/2013 low).
AUD Better Bid After Upside Surprise In 1Q GDP
AUD rose to a one-month high amid solid GDP estimates
The Australian dollar rose 0.64% on Wednesday amid the release of solid growth figures for the first quarter. The better-than-expected GDP figures caught investors off guard as many were expecting the Australian economy to have suffered more during the first three months of the year. The gross national product rose 1.7% y/y compared to 1.6% median forecast. On a quarter-over-quarter basis, the economy grew 0.3% (seasonally adjusted).
Looking at the detail, the picture is not that rosy as consumer spending slowed down in the first quarter, capital expenditures were quite soft and mining inventories exploded. Today's figures were indeed good news, however the weakness seems to be broad based, suggesting that an acceleration in growth is more than unlikely.
The appreciation of the Aussie over the last week looks mad and we believe this is more due to the broad USD weakness rather than due to Australian fundamentals. Investors are looking for yields and the AUD is still an interesting alternative, especially against the backdrop of failing Trumponomics.
After rallying 2.5% since June 1st, AUD/USD is currently testing the 0.7556 resistance (high from May 2nd). A break of the latter would open the road toward the following resistance area at around 0.76. On the downside, a support lies at 0.7469 (Fibonacci 38.2% on May-June rally).
EURCHF remains marginally stable
Global risk appetite remains shaky heading into an event filled Thursday. S&P fell 0.4% while US long end yields fell 5bp - both clearly suggesting risk aversion. The concern around the pace of the Fed tightening cycle and low inflation print combined with general risk off sentiment has allowed JPY to gain nearly 4.50% against the USD. However, the other major safe-haven cross EURCHF has not benefited as aggressively. CHF has only gained 1.30% against the EUR which is surprising considering the size of the broader FX moves.
One rationale is the SNB remains active in managing any CHF appreciation (although SNB FX reserves fell marginally) while the other is that there is increased expectation that the ECB era of unorthodox policy is heading, albeit slowly, to a close. There is increasing probability that at tomorrow's ECB meeting Draghi could take the first baby step towards removing emerging monetary policy. This could come in a shift in wording on the balance of risk or stating that interest rate are less likely to go lower.
But to investors that would be as clear a signal as ending asset purchases or rising interest rates. In addition, trading EU will always come with perpetual political risk and now is not different. Yet, in the near term European political risk has declined which lessens capital flight pressure. ECB tapering sentiment increase should rise the threshold for disruptive social / political risks and allow EURCHF to steadily appreciate.
Germany Factory orders disappoint
German Factory orders declined - surprisingly - more than expected in April at -2.1% m/m. Indeed, recent economic data was on the strong side and showed that Germany was on a strong recovery road.
The Factory Orders forecast, even though negative, was way more optimistic. Markets estimated the data to slightly decline to -0.3%. We now wonder whether there is a reason to worry after the very positive first half of the year. It is anyway important to notice that the annualized data remains largely positive with a +3.5% print.
As explained above, other economic fundamentals are positive. Growth is running at a strong pace above Eurozone average at 0.6% for Q1 and the labour market is widely recovering. Unemployment has never been so low. So today’s Factory Orders seem to be contradicting the current momentum in Germany.
Amid the release of this German data, the single currency is trading mixed and remains below 1.1300. Markets are optimistic of the Eurozone recovery and continue pricing in US difficulties.
Safe Havens Rally Ahead Of Risk Events
Safe haven assets came under renewed buying interest yesterday while riskier assets like equities underperformed, as investors sought to insulate their portfolios ahead of three major risk events tomorrow. The UK General Election, the highly anticipated ECB policy decision and a testimony by former FBI Director James Comey all have the potential to rattle financial markets.
Markets will probably focus on how big of a majority Theresa May will manage to secure, if the ECB will drop aspects of its dovish forward guidance, and on whether Comey will confirm that Trump attempted to influence an FBI investigation. Without anything notable on the agenda today, we think that investors could keep their gaze locked on these major events. As such, this risk-averse mood could linger today as well, and we may experience similar market moves.
Gold surged yesterday, clearing the downside resistance line taken from the peak of the 6th of July 2016. The price broke two resistance (now turned into support) barriers in a row, to stop near 1295 (R1). The short-term path appears positive, but given that our short-term momentum studies show signs of topping, we see the case for a corrective setback before the bulls decide to take the reins again. Switching to the daily chart, we see that the metal is getting very close to the important psychological zone of 1300 (R2). Therefore, we prefer to wait and see whether the bulls will appear strong enough to overcome that key obstacle, especially with tomorrow’s risk events looming.
Australia’s GDP beats consensus, AUD gains further
Overnight, the Australian dollar extended its latest gains, following the release of the nation’s GDP data for Q1. Even though GDP growth slowed notably from the previous quarter, the print was a touch better than expected. Nonetheless, we doubt this will be any surprise for the RBA, which in its policy statement yesterday noted that it expected GDP growth to have slowed in Q1, and that it views this slowdown as transitory. With regards to the Bank, we maintain our view that policymakers will probably remain on hold for the foreseeable future.
AUD/USD managed to overcome the downside resistance line taken from the peak of the 17th of April, and hit the resistance (now support) zone of 0.7515 (S1) ahead of the release of Australia’s GDP data. As soon as the data were out, the rate rallied, broke above 0.7515 (S1), and now looks to be headed towards our next resistance hurdle of 0.7550 (R1). In our view, the break above the aforementioned downside line has turned the short-term outlook positive and as such, we see the prospect for the pair to continue trading higher for a while. A decisive break above 0.7550 (R1) is likely to set the stage for more bullish extensions, perhaps towards the 0.7600 (R2) territory.
Today’s highlights:
The European morning is very quiet in terms of data releases, as we mostly get second-tier economic indicators. In Germany, factory orders for April are expected to have fallen, a turnaround from previously.
From Sweden, we get industrial production for April and the forecast is for a modest acceleration.
In Eurozone, the final GDP print for Q1 is anticipated to confirm the 2nd estimate and as such, any reaction in EUR may remain limited.
From Canada we get building permits for April, although no forecast is available.
XAU/USD
Support: 1288 (S1), 1282 (S2), 1278 (S3)
Resistance: 1295 (R1), 1300 (R2), 1308 (R3)
AUD/USD
Support: 0.7515 (S1), 0.7500 (S2), 0.7455 (S3)
Resistance: 0.7550 (R1), 0.7600 (R2), 0.7625 (R3)
Trade Idea: GBP/USD – Stand aside
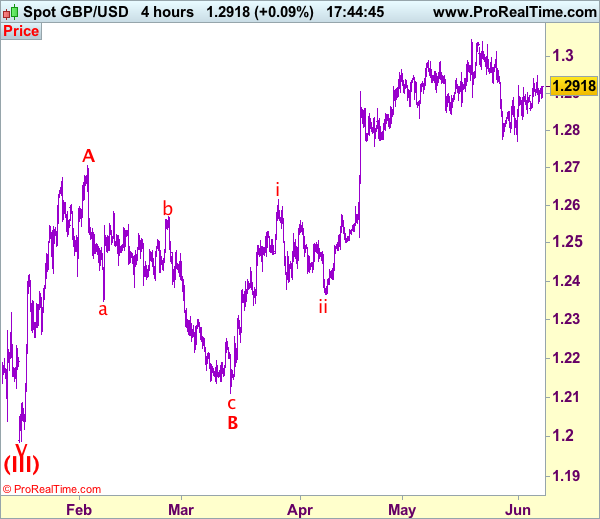
GBP/USD – 1.2918
Recent wave: Wave V of larger degree wave (III) has ended at 1.1986 and major correction has commenced from there for gain to 1.3000 and 1.3140-50
Trend: Near term up
New strategy :
Stand aside
Position: -
Target: -
Stop:-
The British pound met resistance at 1.2950 and retreated, suggesting minor consolidation below this level would be seen and weakness to 1.2870-75 cannot be ruled out, however, break of 1.2845-50 is needed to signal top is formed, bring test of indicated support at 1.2830, only a break below support at 1.2830 would revive bearishness and signal the rebound from 1.2769 low has ended, bring further fall to 1.2800 first.
Our preferred count on the daily chart is that cable's rebound from 1.3500 (wave (A) trough) is unfolding as a wave (B) with A ended at 1.7043, followed by triangle wave B and wave C as well as wave (B) has ended at 1.7192, the subsequent selloff is the larger degree wave (C) which is still unfolding with minor wave (III) of larger degree wave 3 ended at 1.1986, hence wave (IV) correction is in progress which could either be a triangle wave (IV) of a complex formation but upside should be limited to 1.3500 and price should falter well below 1.4000, bring another decline in wave (V) of 3 for weakness to 1.1500, then 1.1200.
On the upside, above said resistance at 1.2950 would signal the rebound from 1.2769 low is still in progress and may extend gain to 1.2975-80, however, reckon resistance at 1.3015 would limit upside, bring further choppy trading later. Only a break of said resistance at 1.3015 would signal the correction from 1.3048 top has ended, bring resumption of upmove for retest of this level first.