
Sample Category Title
British Services Activity Falls In May Amid Pre-Election Jitters
'The pullback in the services PMI in May from April's four-month high is a setback to widespread hopes that the economy's slowdown in the first quarter will be fleeting.' - Samuel Tombs, Pantheon Macroeconomics
British services activity fell more than expected last month amid the upcoming 2017 General Election, official figures revealed on Monday. Markit reported that its Purchasing Managers' Index for the UK services sector dropped to 53.8 points in May, following the preceding month's 55.8 and falling behind expectations for 55.1. The weaker-than-expected figure smashed analysts' hopes for the Q2 rebound, as services activity accounts for about 70% of the British economy. Moreover, Monday's PMI data offset the better-than-expected PMI for both construction and manufacturing sector released last week. Nevertheless, Markit reported that prices charged by services providers increased at the slowest pace since November, suggesting that inflation pressures began to wane. New orders grew at the slowest pace since February last month. Some companies blamed election jitters for their sluggish performance. Apart from that, the Society of Motor Manufacturers and Traders reported on Monday that demand for cars dropped 8.5% in May amid the upcoming June 8 Election.
US Services Activity Slows In May But Remains In Good Shape
'Overall, business conditions the past month were flat as compared with several months of growth. While levels haven't decreased, it may be that overall conditions have reached a high watermark.' - Retail Trade
Business activity in the US non-manufacturing sector fell last month but remained in the expansion territory for the 89th straight month. The Institute for Supply Management reported on Monday that its PMI for the US services sector dropped to 56.9 in May from the prior month's 57.5, whereas analysts anticipated a slighter decrease to 57.1 points during the reported month. The ISM said that 17 non-manufacturing industries reported growth last month. The New Orders Index fell to 57,7 from April's 63.2, whereas the Prices Index declined to 49.2 in May from 57.6, marking the first drop in 13 months. Meanwhile, the Employment Index surged to 57.8 from the preceding month's 51.4, surprising markets after the weak NFP Report released last week. Analysts said that growth in the non-manufacturing sector remained solid despite May's drop, as the growth rate and the Employment Index remained high. Moreover, 15 industries reported employment growth, while just one posted an employment fall. The following employment figures suggested that weak slow job creation in the private sector would be temporary.
Forex Technical Analysis: EUR/USD, USD/JPY, GBP/USD
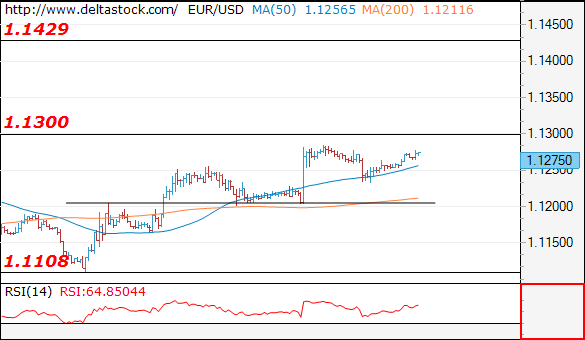
EUR/USD
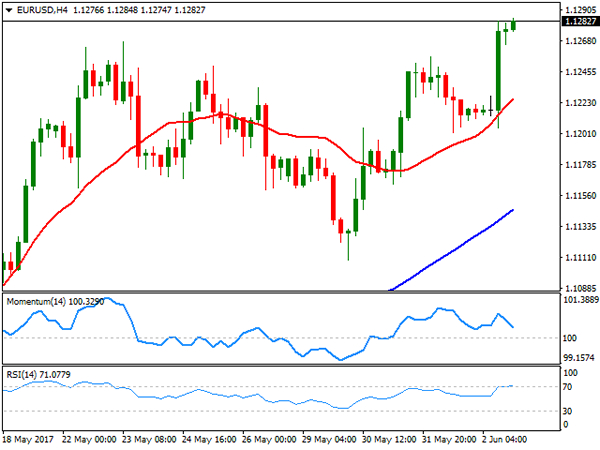
Current level - 1.1275
The pair is still struggling below 1.1300 major resistance and another dip to 1.1205 minor support is possible, before breaking higher, towards 1.1430 mark. An eventual slide below 1.1205 will challenge 1.1108 low.
| Resistance | Support | ||
| intraday | intraweek | intraday | intraweek |
| 1.1300 | 1.1360 | 1.1205 | 1.1022 |
| 1.1430 | 1.1610 | 1.1165 | 1.0838 |
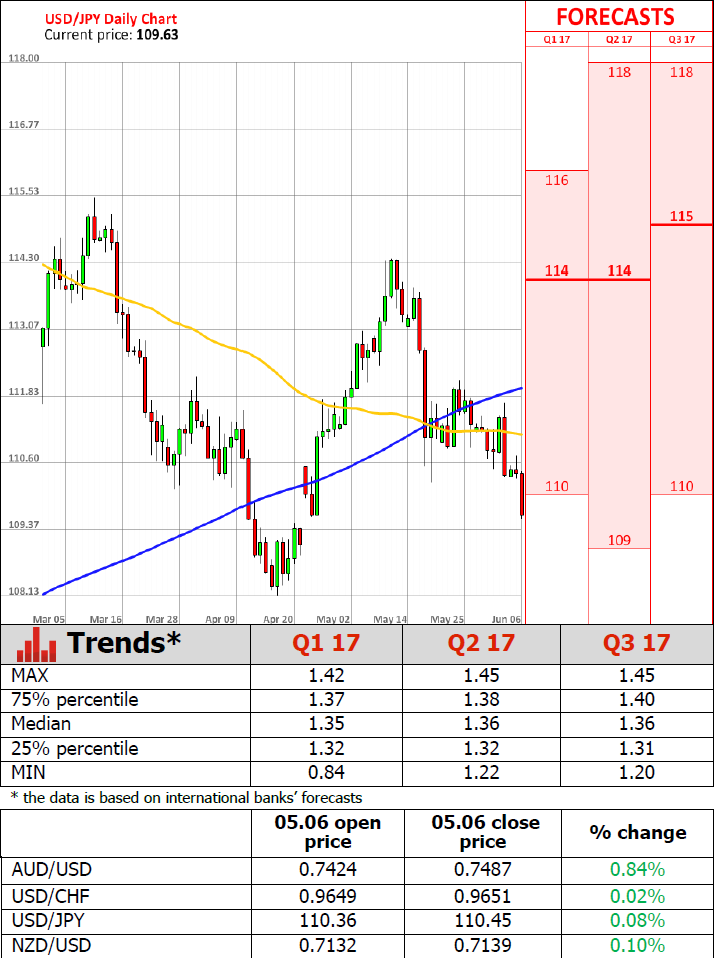
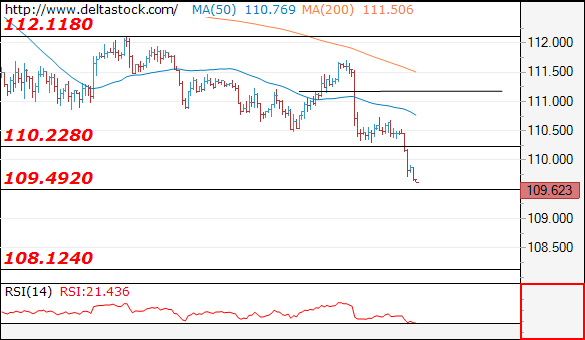
USD/JPY
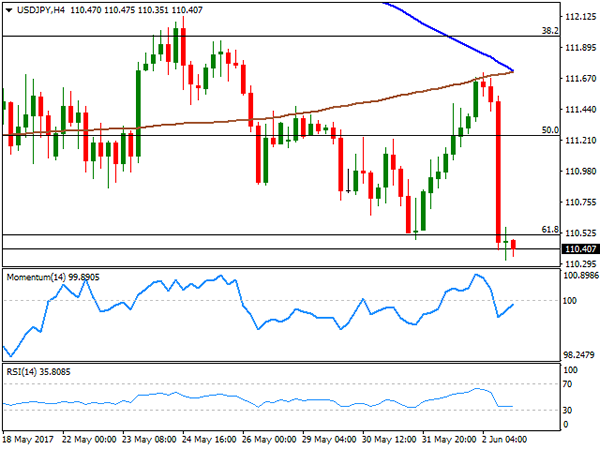
Current level - 119.62
The bias remains bearish below 110.20, for a break through 109.50, towards 108.12 low. Crucial on the upside is 110.70.
| Resistance | Support | ||
| intraday | intraweek | intraday | intraweek |
| 110.20 | 114.30 | 109.50 | 109.40 |
| 112.10 | 115.60 | 108.12 | 108.12 |
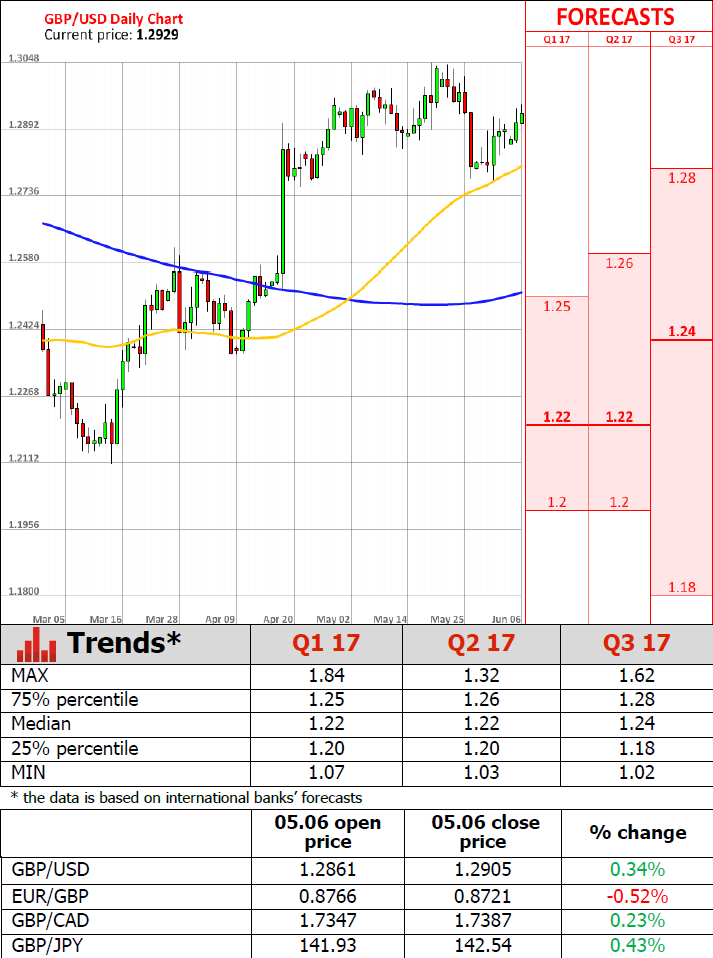
GBP/USD
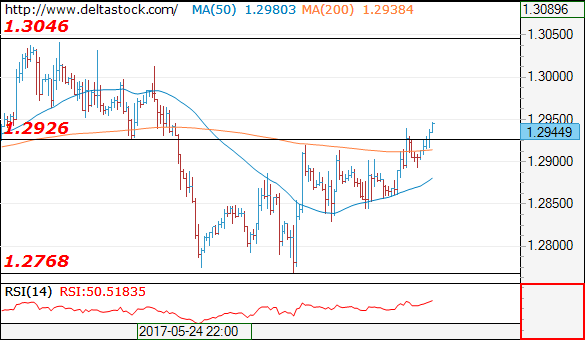
Current level - 1.2944
Despite the positive intraday bias my outlook is counter-trend, for a break through the crucial 1.2850, towards 1.2705.
| Resistance | Support | ||
| intraday | intraweek | intraday | intraweek |
| 1.3050 | 1.3120 | 1.2850 | 1.2770 |
| 1.2930 | 1.3500 | 1.2770 | 1.2610 |
Risk-off Sentiment Lifts Safe Havens
Safe havens have strengthened across the board as the recent risk events have lifted markets' risk off sentiment. Notably the London terror attack, gulf states cut diplomatic ties with Qatar, and the upcoming UK general election.
On Tuesday, June 6th, spot gold rallied 0.8%, hitting a high of $1289.55, last seen on April 19. JPY gained 0.8% to the USD with USD/JPY hitting a low of 109.55, last seen on April 21st. As a result USD/JPY broke the significant support line at 110.00 for the first time since the end of April. JPY gained 0.87% to the EUR with EUR/JPY hitting a 1-week low of 123.21.
US ISM non-manufacturing PMI for May was released yesterday at 56.9, lower than the expectations of 57.00 and the previous figure of 57.50. On Tuesday, June 6th, in early European session, the dollar index hit a new post US presidential election low of 96.47. It saw a subsequent rebound currently trading around 96.65.
The latest poll conducted by Guardian/ICM released on Monday June 5th, shows the Conservatives Party's lead of 11%. The breakdown of the approval rating is: Tory 45%, Labour 34%, Liberal Democrats 8% & UKIP 5%. The release of the poll has provided some support to GBP. GBP/USD hit a 1-and-a-half-week high of 1.2949 on Tuesday morning during early European session.
Recent polls conducted by different institutions have shown various outcomes. Although the Conservative Party still has a lead over all parties, this lead ranges from 1% to 11%. The “poll of polls” released on May 31, showed the Tory's lead at 9%, which appears to be a more objective figure, as the calculation was based on an average of all recent polls.
The Conservative Party is still expected to win the election; however, the victory seems to be less certain now. It would be surprising, although, not impossible for the Labour Party to win the final victory. Per YouGov's seats forecasts released the end of May the Conservative Party might keep a narrow majority even after the election. In this situation, potential hurdles and disagreements from other parties over Brexit issues are foreseeable, which will likely result in the impending 2-year Brexit negotiation process being difficult and weighing on GBP's prospects.
Foreign Exchange Market Commentary: EUR/USD, USD/JPY, GBP/USD, GOLD, WTI CRUDE, DJIA, FTSE100, DAX
EUR/USD
The American dollar closed the week lower against its major rivals, suffering a major setback after the release of softer-than-expected US employment data. The Nonfarm Payroll report showed that in May, the world's largest economy added 138,000 new jobs, well below the 185K expected, while April reading was downwardly revised to 174K from previous estimate of 211K. The unemployment rate fell to 4.3%, the lowest in 16 years, but wages' growth disappointed again, up 2.5% when compared to a year earlier. Euro's rally was limited by poor PPI figures released early Friday. Inflation at factory levels remained flat in April, whilst the year-on-year reading came in at 4.3%, below the 4.5% expected, although above previous 3.9%. Still, the numbers came following a disappointing May preliminary inflation reading in the region, somehow denting hopes the ECB will have to retrieve QE sooner than planned. The Central Bank has its monetary policy meeting next Thursday, and speculative interest may remain cautious ahead of the event.
The EUR/USD pair remains biased towards the upside, trading at its highest for this 2017, and near the key 1.1300 figure, the high set last November following news that Donald Trump won the US election. In the daily chart, the RSI indicator has turned modestly higher near overbought levels,, while the Momentum remains flat above its 100 level, this last, reflecting the range bound trading seen last week. In the same chart, a strongly bullish 20 DMA leads the way higher, now providing support around 1.1130, while the longer ones stand well below this last. Shorter term, technical readings also lack directional momentum, but particularly the RSI indicator consolidates around 71, while a bullish 20 SMA contained the downside on Friday, now around 1.1220. Stops should be large above 1.1300, and if they get triggered, the pair has scope to advance up to the 1.1460 region this week, the level that pretty much capped rallies since January 2015.
Support levels: 1.1260 1.1220 1.1180
Resistance levels1.1300 1.1345 1.1390
USD/JPY
The USD/JPY pair closed the week at 110.40, barely above May's low of 110.23 and a couple of pips below 110.50, the 61.8% retracement of its April/May rally between 108.12 and 114.36. The pair shed over 100 pips on Friday, following the release of a disappointing US employment report as the country created less jobs than expected, while wages remained subdued. Speculation that the US is close to full employment and therefore the sector will grow at a slower pace throughout 2017, dented further confidence in the greenback. Treasury yields plunged to fresh 2017 lows with the news, with the 10-year note yield ending the week at 2.16%, its lowest since last November. The 30-year note benchmark settled at 2.81% from previous 2.87%. From a technical point of view, the pair is poised to extend its decline, particularly on a break below the mentioned May low. In the daily chart, the price is developing below its 100 and 200 DMAs, while the RSI indicator accelerated its decline, now heading south around 39, also in line with a new leg lower. In the 4 hours chart, the 100 SMA accelerated its decline far above the current level, now converging with the 200 SMA around 111.70, while technical indicators have lost their downward strength, but remain within negative territory, also maintaining the risk towards the downside.
Support levels: 110.20 109.80 109.30
Resistance levels: 110.50 110.90 111.40
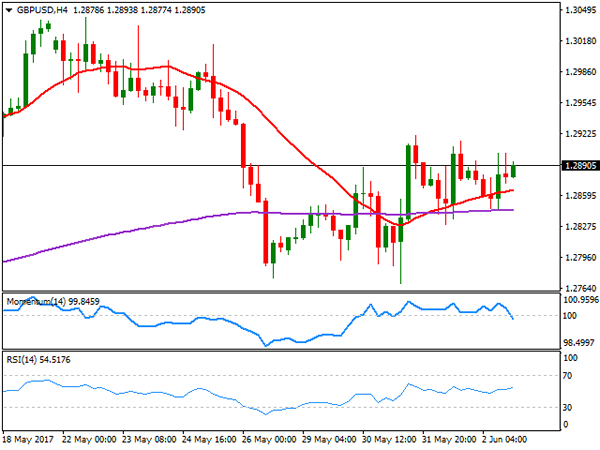
GBP/USD
The GBP/USD pair managed to close the week marginally higher, but below the 1.2900 level, helped by a weaker greenback and despite undergoing political woes. Ahead of the General Election that will take place this Thursday, polls show that PM May's Conservative party has been losing the lead, rising concerns over a possible hung Parliament. A poll released over the weekend, shows that Conservatives have the 40% of voters' intention, while the Labour party advanced to get at this point 39%. Adding to political woes, the UK suffered another terror attack on Saturday that led to at least seven dead, although seems unlikely that May will delay the election. Headlines on election will likely dominate the pair ahead of the event, with wild spikes expected any side of the board and cautious recommended. Technically, the pair maintains a neutral stance, as in the daily chart, is holding right below a flat 20 DMA, providing resistance at 1.2920, while technical indicators head marginally lower around their mid-lines. In the 4 hours chart, the price has been holding above a horizontal 200 EMA at 1.2840, and now stands above a modestly bullish 20 SMA, but the Momentum indicator heads south around its 100 level whist the RSI stands at 54, diverging from each other, and therefore failing to provide clues on what's next for the pair.
Support levels: 1.2840 1.2800 1.2760
Resistance levels: 1.2920 1.2960 1.3000
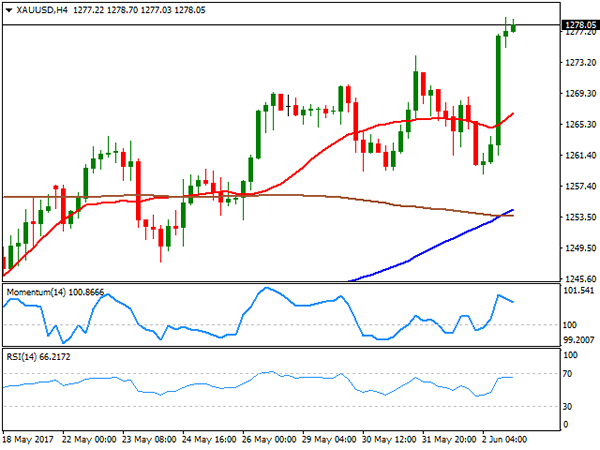
GOLD
Gold prices rallied to fresh 6-week highs on Friday, with spot settling at $1,278.05 a troy ounce. The commodity rallied after US employment data disappointed, as doubts arose about Fed's upcoming decisions on tightening. A June rate hike has been largely priced in, but has now become less of a certainty, while speculative interest is questioning if the US Central Bank will be able to maintain its tightening policy, particularly if data remain soft. Gold is bullish according to technical readings in the daily chart, as the price accelerated above a bullish 20 SMA that is advancing above the larger ones, whilst the RSI indicator turned north, now around 63, its highest since last April. In the 4 hours chat, the 100 SMA is crossing above the 200 SMA far below the current level, also below the 20 SMA, while technical indicators lost upward strength near overbought territory, but are far from suggesting an upcoming downward move.
Support levels: 1,274.05 1,265.90 1,254.60
Resistance levels: 1,283.10 1,295.40 1,307.15
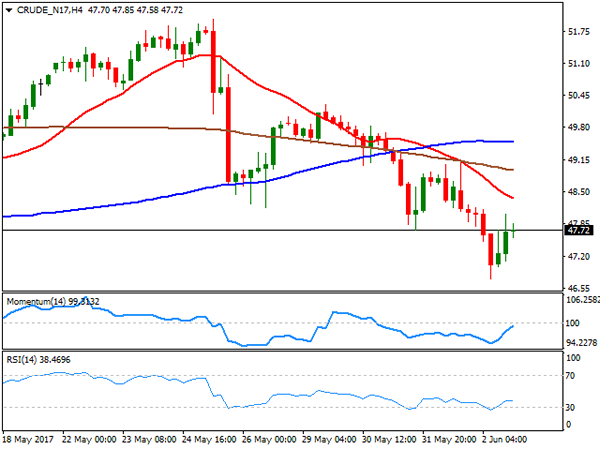
WTI CRUDE OIL
Crude oil prices edged lower for a second consecutive week, with West Texas Intermediate crude futures ending it at $47.42 a barrel, after printing 46.73 on Friday. The commodity remained under pressure after the EIA updated its International Petroleum statistics, upgrading its oil production forecast, while news that the US is leaving the Paris climate deal spurred concerns of further increase in US production. Additionally, the Baker Hughes report showed that the number of oil rigs increased to 733 from 722 in the previous week. Daily basis, the commodity has fallen steadily for the last five days and retains its bearish stance, with technical indicators heading south within negative territory and the price developing well below its moving averages. In the 4 hours chart, the 20 SMA gains bearish strength below the 100 and 200 SMAs, with the shortest offering a dynamic resistance around 48.60, while technical indicators have bounced from oversold territory, but lost upward strength within negative territory, maintaining the risk towards the downside.
Support levels: 47.20 46.65 44.85
Resistance levels: 48.60 49.30 49.90
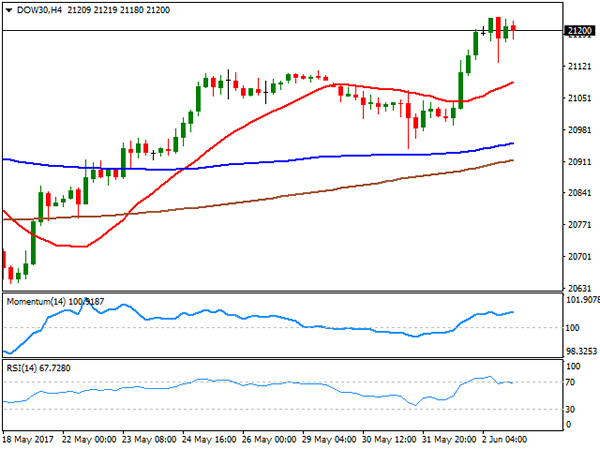
DJIA
US equities managed to advance on Friday, with all of the three main indexes closing in the green and at record highs, despite soft local data. Not only the monthly employment report missed expectations, but also the trade balance deficit widened beyond expected in April, printing $-47.6B. The Dow Jones Industrial Average closed at 21,206.29, up by 62 points, whilst the Nasdaq Composite added 59 points or 0.94%, to 6,305.80. The S&P gained 9 points and closed at 2,439.07. Microsoft was the best performer within the Dow, adding 2.37%, followed by Boeing which gained 1.55%. Exxon Mobil and Chevron topped losers' list amid falling oil prices, shedding 1.49% and 1.11% respectively. In the daily chart, the Momentum indicator heads sharply higher within positive territory, the RSI indicator consolidates around 66, whilst the index stands above its moving averages, all of which favors additional advances ahead. In the shorter term, and according to the 4 hours chart the upside is also favored, with indicators holding near overbought territory, while the 20 SMA accelerated its advance below the current level.
Support levels: 21,175 21,128 20,080
Resistance levels: 21,228 21,260 21,200
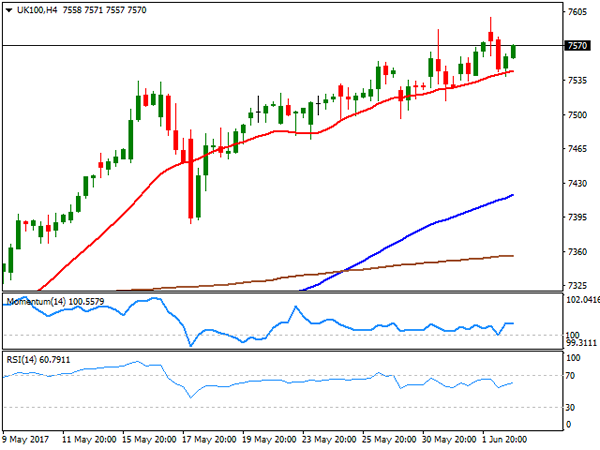
FTSE100
The FTSE 100 added 0.05% on Friday, closing the day at 7,547.63, pulling back, however, from fresh intraday record highs. Mining and financial-related equities contributed the most to the advance, with European markets following the strong lead of their Asian counterparts. Within the Footsie, Randgold Resources led gainers with a 4.01% gain, followed by Fresnillo that added 3.77%. Taylor Wimpey led decliners with a 2.74% loss, followed by Marks & Spencer that shed 2.03%. Technically, the daily chart shows that the Momentum indicator keeps retreating from overbought levels, but holding far above its mid-line, while the RSI indicator hovers around 71 as the index remains far above moving averages, maintaining the risk towards the upside. In the 4 hours chart, the technical picture is neutral-to-bullish as the index keeps developing above a bullish 20 SMA, while technical indicators hold within positive territory, although with no directional strength.
Support levels: 7,550 7,515 7,490
Resistance levels: 7,588 7,620 7,660
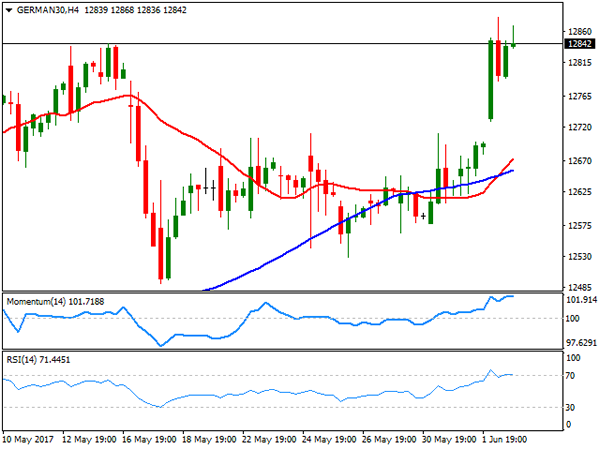
DAX
European equities closed higher on Friday, with the German DAX adding 160 points or 1.25%, to settle at 12,822.94, a record high, boosted by strong gains in the automotive and pharmaceutical sectors. Siemens was the best performer with a 2.12% gain, followed by Bayer that added 1.2%. Only three components closed lower, including Deutsche Bank and Commerzbank, down 0.48% and 0.27% respectively. The market ignored the soft producer price index in the region, as latest local data maintained optimism high among local investors. The index is bullish daily basis, having accelerated above a bullish 20 SMA, also far above the larger ones, whilst technical indicators have entered positive territory with a strong upward momentum. In the 4 hours chart, technical indicators have partially lost upward strength near overbought levels, but are far from anticipating a downward move, whilst the index stands far above its moving averages, in line with the longer term outlook.
Support levels: 12,788 12,729 12,657
Resistance levels: 12,881 12,930 12,975
RBA Meeting Packs No Surprises
The RBA remained on hold today, as was widely anticipated. In the statement accompanying the decision, policymakers maintained a balanced tone overall, offering very little new information regarding the next policy move. The Bank was slightly more upbeat on the labor market, while there was no mention to the recent signs of a slowdown in China, making the tone of the statement appear somewhat more sanguine than previously.
As a result, the Aussie gained somewhat on the decision, recovering some losses it posted a couple of hours earlier after trade data for Q1 missed their forecast, generating concerns that tomorrow’s GDP print for Q1 may be weaker than previously anticipated. In any case, given the lack of any worried signals and the Bank’s overall balanced bias, we think that AUD could remain supported for a while, at least ahead of tomorrow’s GDP data.
AUD/USD edged north yesterday, after it hit support near 0.7420 (S2). However, the advance was halted by the downside resistance line drawn from the peak of the 17th of April, where traders awaited for the RBA policy meeting. At the event, the pair rose little as the Bank offered no surprises. We believe it may continue higher and perhaps break above the aforementioned downside line. Such a break may encourage the bulls to challenge the 0.7515 (R1) resistance, marked by the highs of the 23rd and 25th of May. Another break above that level is possible to pave the way for the next resistance of 0.7550 (R2).
Decent wage data lift the yen
The Japanese currency came under renewed buying interest overnight, following the release of the nation’s wage data for April. Average cash earnings rose by more than expected, while last month’s rate was revised higher. Even though JPY has not really responded to economic data ever since the BoJ introduced QQE with yield-curve control, considering that wage growth is seen as a signal of future inflation, this may have fueled bets regarding a potential pick-up in inflationary pressures.
Indeed, Japan’s labor market is extremely tight at the moment, with the unemployment rate resting at a 22-year low of 2.8%. We will keep a close eye on upcoming wage growth and inflation prints. Any further signs in coming months that wage and/or inflationary pressures are picking up could raise speculation with regards to a less dovish stance by the BoJ in the not-too-distant future.
USD/JPY tumbled overnight, breaking below the key support (now turned into resistance) of 110.30 (R1) to stop near our next obstacle of 109.70 (S1). The break signals the downside exit of the sideways range that contained the price action since the 17th of May, which in our view turns the short-term outlook back to the downside and increases the probability for further declines. Even if the pair rebounds to recover some of the overnight losses, we believe that there is the likelihood for the bears to take control again near the 110.30 (R1) zone and push the rate lower for another test near 109.70 (S1). A decisive break below that level is possible to initially aim for our next support of 109.35 (S2).
Today’s highlights:
During the European day, the economic calendar is relatively quiet. The only noteworthy indicator we get is Eurozone’s retail sales for April, though this is usually not a major market mover.
In the US, JOLTS jobs openings for April are due out and the forecast is for a decline in the figure.
From Canada, we get the Ivey PMI for May. Expectations are for the index to have declined, albeit slightly. Even though something like that could prove negative for the Loonie, considering that the figure is expected to have remained at a very elevated level, we don’t expect any negative reaction to be major.
AUD/USD
Support: 0.7455 (S1), 0.7420 (S2), 0.7395 (S3)
Resistance: 0.7515 (R1), 0.7550 (R2), 0.7600 (R3)
USD/JPY
Support: 109.70 (S1), 109.35 (S2), 108.90 (S3)
Resistance: 110.30 (R1), 110.75 (R2), 111.25 (R3)
Technical Outlook: EURUSD – Range Trading Ahead Of ECB
The Euro is holding within narrow consolidation under fresh high at 1.1285, as traders are awaiting signals from ECB on Thursday.
Overall bullish structure remains intact, underpinned by rising 10SMA (1.1219) and eyes immediate targets at 1.1299 (09 Nov post-US election high) and 1.1313 (Fibo 76.4% of 1.1614/1.0340 descend).
Extended directionless trading is expected ahead of ECB, with shallow dips to be contained above 10SMA/daily Tenkan-sen (1.1219/1.1197), as the pair so far ignores overbought conditions.
Near-term direction will depend from the ECB's decisions on Thursday's meeting. Markets are expecting more hawkish tone to further boost the single currency for 1.1300+ gains.
On the other side, softer tone from the central bank would disappoint traders and likely spark fresh weakness.
Loss of 1.1200 handle would generate initial bearish signal and risk extension towards key 1.1109 support (30 May trough).
Res: 1.1277, 1.1285, 1.1313, 1.1366
Sup: 1.1236, 1.1219, 1.1197, 1.1164
GBP/USD Elliott Wave Analysis
GBP/USD – 1.2919
GBP/USD – Wave 4 is unfolding as an (A)-(B)-(C) and could have ended at 1.7192
The British pound found support at 1.2769 and has rebounded, however, reckon upside would be limited to 1.2960-70 and resistance at 1.3015 should hold, bring further consolidation below recent high at 1.3048. Only a daily close above 1.3015 would signal pullback from 1.3048 has ended, bring retest of this level, break there would extend recent upmove from 1.1986 low to 1.3140-50 (38.2% Fibonacci retracement of 1.5018-1.1986) and possibly 1.3200, however risk from there has increased for a retreat later.
Our preferred count on the daily chart is that cable's rebound from 1.3500 (wave (A) trough) is unfolding as a wave (B) with A ended at 1.7043, followed by triangle wave B and wave C as well as wave (B) has possibly ended at 1.7192, below support at 1.4232 would add credence to this count, then further fall to 1.4000 level would follow but reckon downside would be limited to 1.3655 support and price should stay above previous support at 1.3500.
On the downside, expect pullback to be limited to 1.2830 and bring another recovery. Below 1.2830 would bring test of 1.2757-69 support area, break there would signal a temporary top has been formed, bring retracement of recent rise to previous resistance at 1.2706 (now support), then towards 1.2650-60 but previous resistance at 1.2616 (tentatively wave i top) should remain intact.
Recommendation: Stand aside for this week.

Longer term - Cable's rise from 1.0520 (Feb 1985) to 2.0100 (September 1992) is seen as [A], the decline to 1.3682 is labeled as (B) and (C) wave rally has ended at 2.1162 (9 Nov, 2007) which is also the top of larger degree wave B with circle. The selloff from there is a 5-waver with wave (A) ended at 1.3500 (23 Jan 2009), wave (B) itself is labeled as A: 1.6733, triangle wave B: 1.4813 and wave C as well as top of wave (B) ended at 1.7192 (2014), hence the selloff from there is an impulsive wave (C) with wave I : 1.4566, wave II 1.5930, an extended wave III is unfolding and already exceeded our downside target at 1.3500 and 1.3000, hence weakness to 1.2500 and possibly 1.2000 cannot be ruled out, however, price should stay well above psychological level at 1.0000.

GBP/CHF Elliott Wave Analysis
GBP/CHF – 1.2470
GBP/CHF – Circle wave v ended at 0.9106 and major correction has commenced for subsequent gain to 1.5547.
Sterling continued heading south after last month’s selloff fro1.3069, adding credence to our view that top has been formed there and bearishness remains for this decline to extend weakness to 1.2340-50, then towards support at 1.2285, however, oversold condition should prevent sharp fall below previous chart support at 1.2215, risk from there has increased for a rebound to take place later this month.
To recap the larger degree count, the selloff from 2.4965 (July 2007) is the beginning of wave V with circle and is labeled as 1: 2.3760, 2: 2.4425, wave 3 extension ended at 1.1470, followed by wave 4 at 1.5547, the quick rebound from 0.9106 suggests wave 5 as well as entire circle wave V could have ended there, hence consolidation with mild upside bias is seen for major correction to take place, bring initial test of 1.5547 (previous 4th of a lesser degree).
On the upside, whilst initial recovery to 1.2535-40 cannot be ruled out, reckon upside would be limited to 1.2595-00 and bring another decline later. Only a daily close above resistance at 1.2690-95 would abort and suggest first leg of decline from 1.3069 has ended, bring a stronger rebound to 1.2740-50, however, as top has been formed at 1.3069, still reckon upside would be limited to 1.2785-90 and price should falter below 1.2850-60, bring another decline later.
Recommendation: Sell at 1.2700 for 1.2500 with stop below 1.2800.

On the Monthly chart, the longer-term count is that major downtrend is under way with circle wave I at 2.8645 (Sep 1.978), then wave II with circle at 4.6175 (Feb 1981), the wave III with circle ended at 1.7425 (Nov 1995) and followed by wave IV with circle at 2.4965 (July 2007 with a short wave C) and wave V with circle has possibly ended at 0.9106. A monthly close above 1.5547 would add credence to this view, bring major correction to 1.7000, then towards psychological level at 2.0000.

Trade Idea: GBP/USD – Stand aside
GBP/USD – 1.2925
Recent wave: Wave V of larger degree wave (III) has ended at 1.1986 and major correction has commenced from there for gain to 1.3000 and 1.3140-50
Trend: Near term up
Original strategy :
Sold at 1.2920, stopped at break-even
Position: - Short at 1.2920
Target: -
Stop: - 1.2920
New strategy :
Stand aside
Position: -
Target: -
Stop:-
The British pound has risen again in part due to cross-buying in sterling and the breach of resistance at 1.2921 signals the rebound from 1.2769 low is still in progress, hence upside risk remains for further gain to 1.2955-60 and then 1.2975-80, however, reckon resistance at 1.3015 would limit upside, bring further choppy trading later. Only a break of said resistance at 1.3015 would signal the correction from 1.3048 top has ended, bring resumption of upmove for retest of this level first.
Our preferred count on the daily chart is that cable's rebound from 1.3500 (wave (A) trough) is unfolding as a wave (B) with A ended at 1.7043, followed by triangle wave B and wave C as well as wave (B) has ended at 1.7192, the subsequent selloff is the larger degree wave (C) which is still unfolding with minor wave (III) of larger degree wave 3 ended at 1.1986, hence wave (IV) correction is in progress which could either be a triangle wave (IV) of a complex formation but upside should be limited to 1.3500 and price should falter well below 1.4000, bring another decline in wave (V) of 3 for weakness to 1.1500, then 1.1200.
On the downside, aspect pullback to be limited to 1.2890-95 and 1.2845-50 should hold, bring further consolidation. Only below support at 1.2830 would revive bearishness and signal the rebound from 1.2769 low has ended, bring further fall to 1.2800 first.
