
Sample Category Title
Arab Gulf’s Banning over Qatar Might Help Australia’s LNG Exports
Geopolitical uncertainty in the Middle East lifted Australian dollar. A boycott over Qatar is expected to disrupt the country's exports, benefitting its rival, Australia, over LNG exports. Aussie, however, retreated on 'Tuesday, using RBA announcement as an excuse. The central bank reiterated that the global economy continued the "broad-based pick-up", suggested that the domestic economic transition from mining investment has "almost complete" and maintained a neutral tone on the monetary policy. Yet, it remained concerned that low household income growth would constrain consumption. We are skeptical over RBA's forecast that Australia's economy growth would reach+3% p.a. and cast doubt over how long it can refrain from cutting the policy rate further so as to prevent the property bubble.
Australia and Qatar: Rivals in Natural Gas Exports
Aussie's rebound accelerated on Monday amidst news that Arab Gulf countries cut diplomatic ties with Qatar and suspended Doha-bound flights. A statement issued by the Saudi government accused Qatar of collaborating with "Iranian-backed terrorist groups" in the eastern region of Qatif and in Bahrain, while Qatar called the accusation "unjustified" and with "no basis in fact".
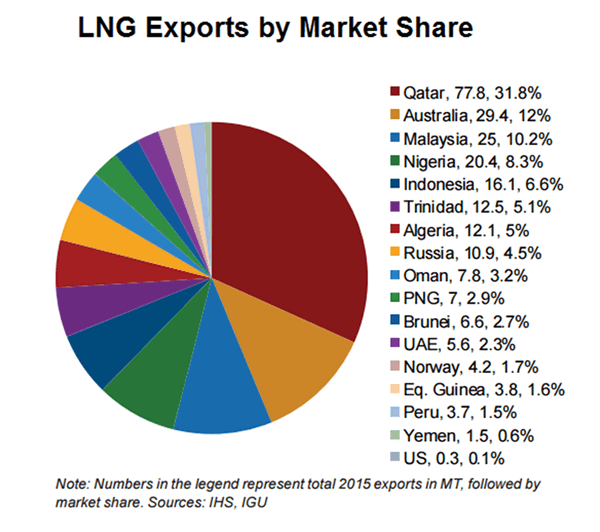
Australia and Qatar are trading partners. Australia's exports to Qatar amounted to AU$ 0.55B, and its imports from Qatar amounted to AU$ 0.45B, in 2015-16. Total merchandise trade was approximately at AU$ 1B during that period. Exports are dominated by meat, motor vehicles and live animals. Imports from Qatar are almost entirely fertilisers and LNG products. Yet, these figures were insignificant when compared with the trade relations between Australia and China. Australia's exports to China amounted to AU$75B, and imports from China amounted to AU$61.5B, in 2015-16. Merchandise trade totaled at AU$ 136.7B during the period.
Indeed, Australia and Qatar are rivals in natural gas exports. Natural gas is Australia's third largest exports in value terms, after iron ore and concentrates, and coal. It takes up 5.4% of the country's total exports in 2014. Qatar is the largest exporter of LNG, producing around one-third of the LNG traded. Yet, the rapid ramp-up in LNG investments has raised expectations that Australia would become the world biggest exports by 2020. This hope, was, however, dampened two months ago, as Qatar announced plans to lift the moratorium on further development of its huge North gas field. It was expected that such development could convert to 15.3M tonnes of natural gas per year, in addition to the Middle East country's existing 77M tonnes annual capacity. The market now expects that the boycott would disruption Qatar's exports, benefiting Australia.
RBA Struggled to Keep Rates Unchanged.
As widely anticipated, RBA left the cash rate unchanged at 1.5% in June. Policymakers indicated that, "transition to lower levels of mining investment following the mining investment boom is almost complete". Meanwhile, "business conditions have improved and capacity utilization has increased. Business investment has picked up in those parts of the country not directly affected by the decline in mining investment". While acknowledging growth moderation in the first quarter, the central bank maintained the view that GDP growth would "increase gradually over the next couple of years to a little above +3%". On the job market, policymakers acknowledged the payroll growth but remained concerned over the subdued growth in total hours worked as well as wage growth remains. Policymakers warned that persistently low growth in wage would restrain household consumption.
We believe the RBA has been over-optimistic over the economic growth outlook. The huge volatility of commodity prices and concerns over Chinese economy slowdown are the major headwinds to Australian economy. Meanwhile, as the RBA suggested, consumption growth remains challenging on subdued wage growth. Although government spending might provide a boost, the recent budget signals that fiscal stimuli are not under consideration.
We retain the view that RBA is refraining from reducing interest rates so as not to exacerbate the acceleration in housing prices. Policymakers acknowledged that housing prices have been "rising briskly in some markets, although there are some signs that these conditions are starting to ease". They remained concerned that the growth in housing loan has outpaced that of household income. However, the central bank would be forced ease the monetary policy if the economic developments come in worse than what it has anticipated
Trade Idea: GBP/JPY – Target met and look to sell higher
GBP/JPY - 141.65
Recent wave: Medium term low formed at 120.50 and (A)-(B)-(C) major correction has commenced with (A) leg ended at 148.45, hence wave (B) is unfolding for retreat to 131.00-10.
Trend: Near term up
Original strategy:
Sold at 143.65, met target at 141.65
Position: - Short at 143.65
Target: - 141.65
Stop: -
New strategy :
Look to sell again higher
Position: -
Target: -
Stop:-
Sterling met renewed selling interest at 143.10 yesterday and has fallen again in line with our bearish expectation, our short position entered at 143.65 met downside target at 141.65 (with 200 points profit) and a sustained breach below indicated previous support at 141.50 would extend the selloff from 148.10 top to 141.00 but loss of momentum should limit downside to 140.50-55 and price should stay above psychological support at 140.00, bring rebound later.
As we have taken profit on our short position entered at 143.65, would not chase this fall here and would be prudent to stand aside for now. Above 142.10-15 would bring recovery to 142.55-60 but said resistance at 143.10 should remain intact and bring another decline later. Only a break above 143.10 would suggest low is formed instead, risk a stronger rebound to 143.40-50 but resistance at 143.95-00 should remain intact.
Our preferred count is that larger degree wave V with circle is unfolding from 251.12 with wave (I) 219.34, (II): 241.38 and wave (III) is subdivided into 1: 192.60, 2: 215.89 (23 Jul 2008) and wave 3 ended at 118.87 earlier in 2009. The correction from there to 162.60 is wave 4 which itself is a double three and is labeled as first a-b-c ended at 151.53, followed by wave x at 139.03, 2nd a ended at 162.60, 2nd b at 146.75 and 2nd c leg of wave 4 ended at 163.00. Therefore, the decline from 163.00 to 116.85 is now treated as wave 5 which also marked the end of larger degree wave (III), hence wave (IV) major correction has commenced for retracement of the wave (III) from 241.38 and upside target at 183.95-00 (50% Fibonacci retracement of the wave (II) from 241.38) had been met, a drop below 160.00 would suggest wave (IV) has ended at 195.85, bring decline in wave (V) for initial weakness to 130 (already met) and 120.

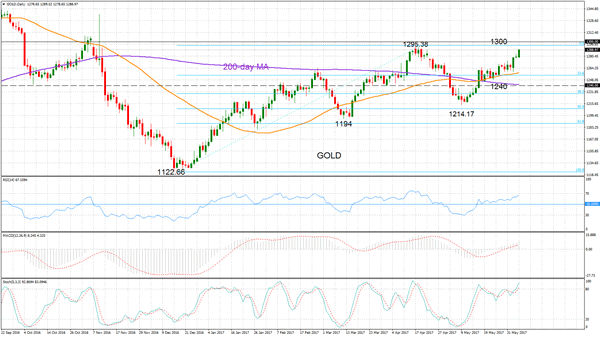
Gold Resumes Bullish Momentum
Gold maintains its bullish outlook as it resumes its upside momentum following a pause in the rally for a few weeks in May after rebounding from a low of 1214.17. There is scope to target the key level at 1300. Prices would have to pass the April 17 high of 1295.38 in order to confirm that a lower low is in place at 1214.17 (May 9 low) and to strengthen the bullish bias. A successful break above 1300 would open the way to the next resistance level at the November high of 1337.12.
The medium-term uptrend remains in progress as gold has been carving out higher highs and higher lows since rising from the mid-December low of 1122.66.
The RSI has picked up momentum and is rising after pausing in the month of May. Being above 50 in bullish territory suggests that there is room for further upside in gold prices. MACD has recently crossed above zero, giving a bullish signal.
Meanwhile, the bullish crossover of the 50-day moving average with the 200-day MA on May 17 supports the overall bullish outlook.
If prices fail to rise and instead decline from current levels, important support comes into view at 1240 and 1214.17. Below this, the market is at risk of changing the medium-term bullish trend to a more bearish one.
Dollar Extends Decline; Aussie Rallies after RBA; Oil Under Pressure
The dollar was broadly weaker and the yen gained on safe haven demand. The aussie rallied after the RBA meeting. Oil remained under pressure.
The Reserve Bank of Australia announced its decision to hold its benchmark interest rate steady at 1.5% and said that its unchanged policy was consistent with sustainable growth and hitting its inflation target. The markets took comfort from the RBA statement and this helped the aussie erase earlier losses to reach a session high of $0.7495. Prior to the RBA announcement the currency had fallen to a session low of $0.7456 after a big miss in Australia's current account balance.
The euro and sterling rose ahead of the ECB meeting and the UK election. Both key events will take place on Thursday.
The euro edged up against the dollar to reach $1.1276, close to a six-month high reached yesterday.
The pound has been quite resilient despite uncertainty regarding the general elections in the UK this week. Recent polls have been mixed. Some polls indicated a narrowing lead for the Conservatives over the Labour Party while British bookmaker William Hill showed increased odds for a majority win by Prime Minister Theresa May. This news combined with a broadly weaker dollar helped cable rise to a session high of $1.2949.
Data out of Japan today showed nominal wages rose last month. Average cash earnings rose 0.5% year-on-year in May versus 0.3% expected.
The dollar / yen pair extended losses after the Japanese data to fall below the key 110-yen level. The greenback was already weighed down by disappointing US data out yesterday on ISM non-manufacturing PMI. The weaker numbers raised concerns that the Federal Reserve would slow down the pace of rate hikes after June. The dollar index touched its lowest level since November, reaching 96.46.
Oil prices extended declines on escalating tensions in the Middle East, after four Arab nations, including Saudi Arabia, cut ties with Qatar. Markets fear the diplomatic spat could hamper a global deal to reduce oil production levels, sending WTI crude prices below $48 a barrel since the news broke yesterday. Prices have been fluctuating around the $47.25 area in the past two trading sessions.
Gold extended gains to reach $1289.38 an ounce, helped by a broadly weaker dollar and safe haven demand.
Trade Idea: EUR/JPY – Hold long entered at 123.75
EUR/JPY - 123.31
Recent wave: wave v of (C) ended at 94.12 and major correction in wave A has ended at 149.79
Trend: Near term up
Original strategy:
Bought at 123.75, Target: 125.75, Stop: 123.15
Position: - Long at 123.75
Target: - 125.75
Stop: - 123.15
New strategy :
Hold long entered at 123.75, Target: 125.75, Stop: 123.15
Position: - Long at 123.75
Target: - 125.75
Stop:- 123.15
Current selloff dampened our near term bullishness and support at 123.16 needs to hold to retain prospect of another rebound later, above 124.15-20 would suggest the retreat from 125.31 has ended, bring test of 124.71 resistance but break there is needed to confirm and bring another test of said resistance at 125.31. Looking ahead, above 125.31 would extend gain towards strong resistance at 125.82 but break there is needed to confirm recent upmove has resumed and extend headway to 126.20-30 and possibly 126.60-70.
In view of this, we are holding on to our long position entered at 123.75. Below support at 123.16 would abort and shift risk back to downside for test of previous support at 122.56 which is likely to hold from here due to broad consolidative outlook.
Our latest preferred count is that wave (ii) is ABC-X-ABC which ended at 123.33 and wave (iii) is unfolding with wave iii ended at 100.77, followed by wave iv at 111.57 and wave v as well as the wave (iii) has ended at 97.04, followed by wave (iv) at 111.43 and wave (v) has ended at 94.12 which is also the end of the larger degree v, this also implied the major wave (C) has also ended there, hence major correction has commenced from there with (A) leg unfolding in its lower degree wave c which has possibly ended at 145.69. Under this count, A-B-C wave (B) has commenced with A leg ended at 136.23, wave B at 143.79 and wave C has possibly ended at 149.79.
Our larger degree count is that the decline from 139.26 is wave (C) and is sub-divided into a diagonal triangle i-ii-iii-iv-v with wave i - 105.44, wave ii- 123.33, wave iii - 97.03, wave iv - 111.43, followed by the final wave v as well as the end of wave (C) at 94.12, this also mark the bottom of larger degree wave B. Under this count, major rise in wave C has commenced as an impulsive wave with minor wave III ended at 145.69, wave V is still in progress for further gain to 150.00. Having said that, this so-called wave V could well be the first leg of larger degree 5-waver wave C and this wave C should bring at least a retest of wave A top at 169.97 (July 2008).

Trade Idea: AUD/USD – Buy at 0.7420
AUD/USD – 0.7477
Recent wave: Wave 5 ended at 1.1081 and major correction has commenced for fall to 0.7000 and then towards 0.6500-10
Trend: Near term down
Original strategy :
Buy at 0.7420, Target: 0.7570, Stop: 0.7360
Position: -
Target: -
Stop: -
New strategy :
Buy at 0.7420, Target: 0.7570, Stop: 0.7360
Position: -
Target: -
Stop:-
As aussie found good support at 0.7372 late last week and has staged a strong rebound above resistance at 0.7476, suggesting the retreat from 0.7518 has ended there and another test of this resistance would be seen, however, break there is needed to signal another leg of rise from 0.7329 low is underway and extend headway towards 0.7592 but resistance at 0.7611 should hold from here due to near term overbought condition.
In view of this, we are looking to buy aussie on dips as 0.7415-20 should limit downside and bring another rise. Below said support at 0.7372 would abort and revive our bearish view that the rebound from 0.7329 has ended at 0.7518 last month, bring further fall towards this level. Only a drop below there would confirm recent decline has resumed and extend weakness to 0.7295-00 (76.4% retracement of 0.7158-0.7750).
On the 4-hour chart, the move from 0.8066 is the wave 5 with i: 0.8860, ii: 0.8315, wave iii is an extended move ended at 1.0183, iv: 0.9706 and wave v has ended at 1.1081 (also the top of entire wave 5). The subsequent selloff is the major correction which is unfolding as ABC-X-ABC and 2nd A leg has ended at 0.8848, followed by a-b-c wave B which ended at 0.9758, hence, 2nd C wave is now in progress and indicated downside target at 0.7000 and 0.6950 had been met, so further fall to 0.6710-20 cannot be ruled out.

GBP/USD Candlesticks and Ichimoku Analysis
Weekly
• Last Candlesticks pattern: Long white candlestick
• Time of formation: 16 Jan 2017
• Trend bias: Down
Daily
• Last Candlesticks pattern: Long white candlestick
• Time of formation: 18 Apr 2017
• Trend bias: Near term up
GBP/USD – 1.3003
Although cable has rebounded after finding support at 1.2769 late last week and consolidation with initial upside bias is seen for recovery to 1.2970-80, reckon 1.3000 would limit upside and price should falter below recent high at 1.3048, bring another retreat later. Below 1.2830 would bring test of said support at 1.2769, break there would signal a temporary top has been formed, bring retracement of recent upmove to the upper Kumo (now at 1.2703) and possibly towards 1.2650, having said that, reckon downside would be limited and previous resistance at 1.2616 would turn into support and contain downside, bring rebound later.
On the upside, whilst initial recovery to 1.2975-85 cannot be ruled out, reckon resistance at 1.3015 would hold from here, bring another retreat later. Only a daily close above said resistance at 1.3015 would signal retreat from 1.3048 has ended, bring retest of this level later. Once this recent high at 1.3048 is penetrated, this would signal the upmove from 1.1986 low (Jan low) has resumed for retracement of early downtrend, hence further gain to 1.3050-60, then 1.3100 would be seen, however, loss of near term upward momentum should prevent sharp move beyond 1.3140-50 (38.2% Fibonacci retracement of 1.5018-1.1986) and reckon 1.3200 would hold.
Recommendation: Stand aside for this week.

On the weekly chart, although cable has rebounded after finding support at 1.2769, break of 1.3015 resistance is needed to signal pullback from 1.3048 has ended, bring retest of this level, once this recent high is penetrated, this would signal the erratic upmove from 1.1986 low (2017 low) has resumed, bring retracement of early decline to 1.3090-00, then towards 1.3140-50 (38.2% Fibonacci retracement of 1.5018-1.1986) but price should falter well below 1.3200-10, risk from there is seen for a retreat to take place later.
On the downside, expect pullback to be limited to 1.2830-40 and bring another rebound. Below 1.2830 would bring test of 1.2769 support, break there would bring correction to the Tenkan-Sen (now at 1.2707), however, downside should be limited to 1.2665-70 and bring another rise. Only below previous resistance at 1.2616 would abort and signal top is formed instead, bring weakness to 1.2550-60, however, still reckon downside would be limited and previous support at 1.2515 should remain intact.

USD/CHF Candlesticks and Ichimoku Analysis
Weekly
• Last Candlesticks pattern: Shooting star
• Time of formation: 7 Mar 2017
• Trend bias: Sideways
Daily
• Last Candlesticks pattern: Morning star
• Time of formation: 9 May 2017
• Trend bias: Near term up
USD/CHF – 0.9643
The greenback has fallen again after meeting renewed selling interest at 0.9808 late last month, adding credence to our bearish view that early decline from 1.0344 top (2016 high) is still in progress and downside bias remains for further fall to 0.9600, then towards support at 0.9550, however, near term oversold condition should prevent sharp fall below latter level and price should stay above psychological level at 0.9500, risk from there has increased for a rebound later.
On the upside, whilst initial recovery to the Tenkan-Sen (now at 0.9715), then 0.9755-60 is likely, reckon upside would be limited to said resistance at 0.9808, bring another decline. A daily close above 0.9859-61 (previous support now resistance and current level of the Kijun-Sen) would defer and suggest a temporary low is formed, bring a stronger rebound to the lower Kumo (now at 0.9966) but price should falter below 1.0000 and bring another selloff.
Recommendation: Sell at 0.9805 for 0.9605 with stop above 0.9905

On the weekly chart, as the greenback has remained under pressure after forming another black candlestick last week, adding credence to our bearish view that early erratic fall from 1.0344 top is still in progress, hence bearishness remains for this move to bring retracement of early upmove to 0.9600, then towards previous support at 0.9550, however, reckon downside would be limited to 0.9500 and another previous support at 0.9444 should remain intact, risk from there has increased for a strong rebound later.
On the upside, although initial recovery to 0.9750-60 cannot be ruled out, reckon said resistance at 0.9808 would limit upside and bring another decline. A weekly close above the Tenkan-Sen (now at 0.9866) would defer and risk a stronger rebound to 0.9940-50 but 1.0007 (previous resistance) should limit upside and price should falter well below 1.0100, bring another selloff later. Above 1.0100 would signal low is formed instead and suggest the aforesaid decline from 1.0344 has ended, bring test of 1.0171 resistance next.

Trade Idea : USD/CHF – Sell at 0.9685
USD/CHF - 0.9641
Most recent candlesticks pattern : N/A
Trend : Near term down
Tenkan-Sen level : 0.9641
Kijun-Sen level : 0.9646
Ichimoku cloud top : 0.9671
Ichimoku cloud bottom : 0.9654
Original strategy :
Sell at 0.9685, Target: 0.9585, Stop: 0.9720
Position : -
Target : -
Stop : -
New strategy :
Sell at 0.9685, Target: 0.9585, Stop: 0.9720
Position : -
Target : -
Stop : -
As the greenback has remained under pressure after Friday’s selloff, bearishness remains for recent decline to resume after consolidation, below support at 0.9622 would extend weakness to 0.9600-05 (50% projection of 1.0100-0.9692 measuring from 0.9808) but oversold condition should limit downside to 0.9570 and price should stay above support at 0.9550, risk from there has increased for a rebound to take place later.
In view of this, we are looking to sell dollar on recovery as 0.9685-90 should limit upside. Only break of resistance at 0.9720 would abort and signal a temporary low is formed instead, bring a stronger rebound to 0.9750 and then 0.9770 but price should falter below resistance at 0.9808.

Trade Idea : GBP/USD – Stand aside
GBP/USD - 1.2928
Most recent candlesticks pattern : N/A
Trend : Near term down
Tenkan-Sen level : 1.2927
Kijun-Sen level : 1.2906
Ichimoku cloud top : 1.2873
Ichimoku cloud bottom : 1.2872
New strategy :
Stand aside
Position : -
Target : -
Stop : -
Although sterling has edged higher again in part due to cross-buying in pound and gain to 1.2950-55 and possibly towards 1.2970 cannot be ruled out, as broad outlook remains consolidative, reckon upside would be limited to 1.3000 and near term overbought condition would cap price below indicated previous resistance at 1.3015, bring retreat later.
In view of this, would not chase this rise here and would be prudent to stand aside for now. Below 1.2890-95 would bring test of 1.2845-50 but break of latter level is needed to signal top is formed, bring test of 1.2830 support, once this level is penetrated, this would signal the rebound from 1.2769 has ended, bring further fall to 1.2800, however, said support at 1.2769 should remain intact.
