
Sample Category Title
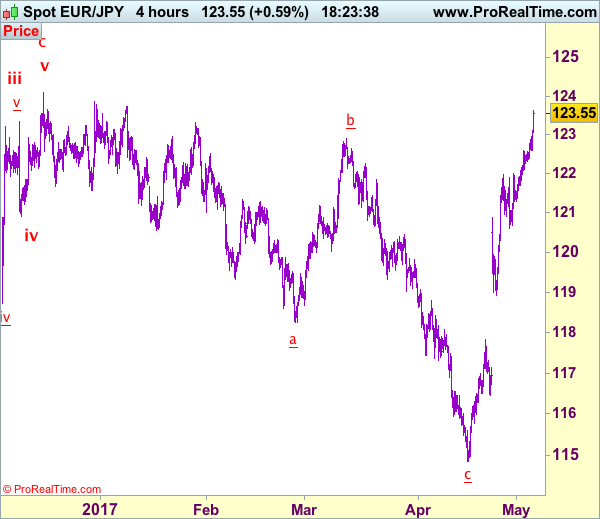
Trade Idea: EUR/JPY – Buy at 122.85
EUR/JPY - 123.45
Recent wave: wave v of (C) ended at 94.12 and major correction in wave A has ended at 149.79
Trend: Near term up
Original strategy:
Buy at 120.65, Target: 122.85, Stop: 120.05
Position: -
Target: -
Stop: -
New strategy :
Buy at 122.85, Target: 124.55, Stop: 122.25
Position: -
Target: -
Stop:-
As the single currency has surged again after brief pullback, adding credence to our view the rise from 114.85 low is still in progress and bullishness remains for further gain to 124.10 resistance, however, break there is needed to retain upside bias for resumption of early upmove to 124.50-60, then towards 125.00 but overbought condition should prevent sharp move beyond there, risk from there is seen for a retreat later.
In view of this, we are looking to buy euro on pullback as 122.85-90 should limit downside and bring another rise. Below support at 122.11 support would defer and risk correction to 121.70 but break of 121.25-30 is needed to signal top is formed, bring retracement of recent rise to 120.85-90 but support at 120.60 should remain intact.
Our latest preferred count is that wave (ii) is ABC-X-ABC which ended at 123.33 and wave (iii) is unfolding with wave iii ended at 100.77, followed by wave iv at 111.57 and wave v as well as the wave (iii) has ended at 97.04, followed by wave (iv) at 111.43 and wave (v) has ended at 94.12 which is also the end of the larger degree v, this also implied the major wave (C) has also ended there, hence major correction has commenced from there with (A) leg unfolding in its lower degree wave c which has possibly ended at 145.69. Under this count, A-B-C wave (B) has commenced with A leg ended at 136.23, wave B at 143.79 and wave C has possibly ended at 149.79.
Our larger degree count is that the decline from 139.26 is wave (C) and is sub-divided into a diagonal triangle i-ii-iii-iv-v with wave i - 105.44, wave ii- 123.33, wave iii - 97.03, wave iv - 111.43, followed by the final wave v as well as the end of wave (C) at 94.12, this also mark the bottom of larger degree wave B. Under this count, major rise in wave C has commenced as an impulsive wave with minor wave III ended at 145.69, wave V is still in progress for further gain to 150.00. Having said that, this so-called wave V could well be the first leg of larger degree 5-waver wave C and this wave C should bring at least a retest of wave A top at 169.97 (July 2008).
Trade Idea: AUD/USD – Sell at 0.7455
AUD/USD – 0.7416
Recent wave: Wave 5 ended at 1.1081 and major correction has commenced for fall to 0.7000 and then towards 0.6500-10
Trend: Near term down
New strategy :
Sell at 0.7455, Target: 0.7300, Stop: 0.7515
Position: -
Target: -
Stop:-
As aussie has fallen again after brief bounce to 0.7556 earlier this week, suggesting recent decline is still in progress and downside bias is seen for further weakness to 0.7380-85 (61.8% Fibonacci retracement of 0.7158-0.7750), then towards 0.7300, however, near term oversold condition should prevent sharp fall below 0.7245-50, bring rebound later.
In view of this, we are looking to sell aussie on recovery as 0.7455-60 should limit upside, bring another decline. Above 0.7500-10 would defer and risk rebound to said resistance at 0.7556 but break there is needed to signal low is formed instead, bring further gain to 0.7580-85 but resistance at 0.7611 should hold from here.
On the 4-hour chart, the move from 0.8066 is the wave 5 with i: 0.8860, ii: 0.8315, wave iii is an extended move ended at 1.0183, iv: 0.9706 and wave v has ended at 1.1081 (also the top of entire wave 5). The subsequent selloff is the major correction which is unfolding as ABC-X-ABC and 2nd A leg has ended at 0.8848, followed by a-b-c wave B which ended at 0.9758, hence, 2nd C wave is now in progress and indicated downside target at 0.7000 and 0.6950 had been met, so further fall to 0.6710-20 cannot be ruled out.

Euro Edges Higher As German Services PMI Beat Expectations
It's been an uneventful week for the euro, which is showing little movement in the Thursday session. Currently, EUR/USD is trading just above the 1.09 line. On the release front, German and Eurozone Services PMIs continue to show expansion and were above expectations. Later in the day, ECB President Mario Draghi will speak at an event in Switzerland. In the US, today's major event is unemployment claims, which is expected to drop to 246 thousand. On Friday, the US releases wage growth and nonfarm payrolls reports, so traders should be prepared for some movement from EUR/USD.
As expected, the Federal Reserve stayed on the sidelines on Wednesday, holding the benchmark rate at 0.75 percent. The Fed rate statement was hawkish, as policymakers emphasized the positives and donwplayed a soft first quarter. The statement noted that consumer spending remains strong and that inflation was 'running close' to the Fed's 2 percent target. The Fed's message is clearly one of optimism, as the central bank remains on track to raise interest rates twice more in 2017. The Fed's bullish statement immediately raised the likelihood of a rate hike at June meeting, which jumped to 74 percent after the statement, up from 63% before meeting. The Fed has two key goals which have been achieved, namely full employment and an inflation rate of 2%. One area of concern is the balance sheet, which stands at $4.5 trillion. The minutes of the March meeting stated that policymakers want to start reducing this figure before the end of 2017, and we could see another reference to the balance sheet in the April minutes.
The eurozone has enjoyed a solid first quarter, and more growth has meant more jobs and lower unemployment figures. Just a year ago, the eurozone unemployment rate was at 10.3%, but the rate has been steadily decreasing since then. The March release remained unchanged at 9.5%, within expectations. Germany has led the way, with the unemployment rate dropping to 5.9% in February. Unemployment rolls continue to shrink in Germany, and the decline of 15,000 unemployed persons was better than the estimate of 10,000. Services PMI reports for March have also looked solid, with the eurozone, Germany and France all posting figures pointing to expansion.
It's Election Day (again) in France on Sunday, with Emmanuel Macron and Marine Le Pen vying for the next president of France. The euro and European stock markets have been very steady in the second round of the campaign, as opinion polls continue to show a comfortable majority for Macron:
The polling average line looks at the five most recent national polls and takes the median value, ie, the value between the two figures that are higher and two figures that are lower.
Source – BBC
French Election Timeline
May 3 – TV debate between the two remaining candidates
May 5 – [from midnight] Poll blackout
May 7 – Second round of French presidential elections. Last polls close at 19:00 BST / 14:00 EDT, with an exit poll result announced immediately.
May 11 – Official proclamation of the new President.
May 14 – [from midnight] End of Francois Hollande's mandate
June 11 – First round of legislative elections
June 18 – Second round of legislative elections.
Technical Outlook: Spot Gold May Attack 100SMA / Daily Cloud Base On Extension Of Strong Post-Fed Bearish Acceleration
Spot Gold accelerated sharply lower on Wednesday, pressed by stronger dollar after Fed and met target at $1234 (Fibo 61.8% of $1197/$1295 rally/daily cloud top).
The price broke few strong supports en- route (200SMA at $1251, 55SMA at $1247 and trendline support at $1240) that weakened the structure.
Fresh weakness on Thursday probed briefly below $1234 pivot, with broken bull-trendline now acting as resistance and capping today’s action.
Fresh bearish signal would be generated on close below $1234 and $1229 (Fibo 38.2% of $1122/$1295) for extension towards next targets at $1222/20 ( daily cloud base / Fibo 76.4% / 100SMA), possibly to $1209 (50% of $1122/$1295).
Oversold slow stochastic on daily chart signals correction but no firmer signal seen so far.
Broken 200SMA is expected to cap extended corrective upticks.
Res: 1241, 1247, 1251, 1256
Sup: 1233, 1229, 1222, 1220
GOLD Strong Selling Pressures, SILVER Important Selling Pressures, CRUDE OIL Targeting Support At 47.01.
GOLD Strong selling pressures.
Gold continues its decline after the yellow metal has faded near the hourly resistance at 1295 (18/04/2017 high). Hourly support located at 1260 (26/04/2017 low) has been broken. The road is wide-open for further decline.
In the long-term, the technical structure suggests that there is a growing upside momentum. A break of 1392 (17/03/2014) is necessary ton confirm it, A major support can be found at 1045 (05/02/2010 low).
SILVER Important selling pressures.
Silver continues its decline. Strong support given at 16.82 (15/03/2017 low) has been broken. Strong resistance is given at a distance at 19.00 (09/11/2017 high). Expected to see continued bearish pressures until at least $16.
In the long-term, the death cross indicates that further downsides are very likely. Resistance is located at 25.11 (28/08/2013 high). Strong support can be found at 11.75 (20/04/2009).
CRUDE OIL Targeting support at 47.01.
Crude oil is trading lower towards key support given at 47.01 (22/01/2017 low). Resistance for a short-term bounce can be found at 50.71 (old support) and 53.70 (12/04/2017 high).
In the long-term, crude oil has recovered after its sharp decline last year. However, we consider that further weakness are very likely. Strong support lies at 24.82 (13/11/2002) while resistance can now be found at 55.24 (03/01/2017 high).
EUR/JPY On Its Way Towards Resistance At 123.31, EUR/GBP Trading Sideways, EUR/CHF Ready For A New Leg Lower.
EUR/JPY On its way towards resistance at 123.31.
EUR/JPY's buying pressures are there. Key resistance area given around 122.00 has been broken. Strong resistance stands at 123.31 (27/01/0217 high). Major support is given at 114.90 (18/04/2017low). Expected to see further increase.
In the longer term, the technical structure validates a medium-term succession of lower highs and lower lows. As a result, the resistance at 149.78 (08/12/2014 high) has likely marked the end of the rise that started in July 2012. Strong support at 94.12 (24/07/2012 low) looks nonetheless far away.
EUR/GBP Trading sideways.
EUR/GBP is trading mixed. The technical structure remains negative as long as the resistance at 0.8530 (25/04/2017 low) holds. Expected to show continued weakness until support given at 0.8304 (05/12/2017 low).
In the long-term, the pair has largely recovered from recent lows in 2015. The technical structure suggests a growing upside momentum. The pair is trading above from its 200 DMA. Strong resistance can be found at 0.9500 psychological level.
EUR/CHF Ready for a new leg lower.
EUR/CHF's selling pressures are increasing. Despite the sharp increase and the recent bullish breakout which is very likely psychological, we believe that the medium-term pattern suggests us to see at some point renewed bearish pressures towards key support that can be found at 1.0623 (24/06/2016 low).
In the longer term, the technical structure is mixed. Resistance can be found at 1.1200 (04/02/2015 high). Yet,the ECB's QE programme is likely to cause persistent selling pressures on the euro, which should weigh on EUR/CHF. Supports can be found at 1.0184 (28/01/2015 low) and 1.0082 (27/01/2015 low).
USD/CHF Gaining Short-Term Bullish Momentum, USD/CAD Consolidating Above 1.3700, AUD/USD Bearish Trend.
USD/CHF Gaining short-term bullish momentum.
USD/CHF starts to trade higher. Yet, the volatility is getting higher. The short-term technical structure is turning positive as long as prices remain above hourly support at 0.9856 (23/04/2017 high).
In the long-term, the pair is still trading in range since 2011 despite some turmoil when the SNB unpegged the CHF. Key support can be found 0.8986 (30/01/2015 low). The technical structure favours nonetheless a long term bullish bias since the unpeg in January 2015.
USD/CAD Consolidating above 1.3700.
USD/CAD stands above 1.3700. The pair keeps on pushing higher. Hourly support can be found at 1.3411 (24/04/2017 high) then 1.3353 (20/01/2017 high). Expected to show continued bullish pressures as long as the pair remains above 1.3530 (27/04/2017 low).
In the longer term, there is a golden cross with the 50 dma crossing the 200 dma indicating further upside pressures. Strong resistance is given at 1.4690 (22/01/2016 high). Long-term support can be found at 1.2461 (16/03/2015 low).
AUD/USD Bearish trend.
AUD/USD is trading below 0.7500. As long as prices remain below the resistance at 0.7608 (17/04/2017 high), the short-term technical structure is negative. Key resistance stands at 0.7681 (30/03/2017 high). Expected to show further weakness.
In the long-term, we are waiting for further signs that the current downtrend is ending. Key supports stand at 0.6009 (31/10/2008 low) . A break of the key resistance at 0.8295 (15/01/2015 high) is needed to invalidate our long-term bearish view.
EUR/USD Trading Sideways, GBP/USD Weakening, USD/JPY Breaking Resistance At 112.20.
EUR/USD Trading sideways.
EUR/USD is trading mixed. Hourly support is given at 1.0852 (27/04/2017 low) then 1.0682 (21/04/2017 base). Stronger support can be found at 1.0494 (22/02/2017 low). Hourly resistance is given at 1.0951 (26/04/2017 high). Expected to show another leg higher towards 1.10.
In the longer term, the death cross late October indicated a further bearish bias. The pair has broken key support given at 1.0458 (16/03/2015 low). Key resistance holds at 1.1714 (24/08/2015 high). Expected to head towards parity.
GBP/USD Weakening.
GBP/USD is consolidating lower. Hourly resistance can be found at 1.2966 (30/04/2017 high). Hourly support can be found at 1.2757 (21/04/2017 low). An unlikely break of this support would indicate further weakness.
The long-term technical pattern is even more negative since the Brexit vote has paved the way for further decline. Long-term support given at 1.0520 (01/03/85) represents a decent target. Long-term resistance is given at 1.5018 (24/06/2015) and would indicate a long-term reversal in the negative trend. Yet, it is very unlikely at the moment
USD/JPY Breaking resistance at 112.20.
USD/JPY keeps on pushing higher since the pair given at 112.20 (31/03/2017 high) has been broken. Hourly support can be found at 110.88 (26/04/2017 low). Stronger support is ocated at 108.13 (17/04/2017 low). Other key supports lie at a distant 106.04 (11/11/2016 low). Expected to show continued bullish pressures.
We favor a long-term bearish bias. Support is now given at 96.57 (10/08/2013 low). A gradual rise towards the major resistance at 135.15 (01/02/2002 high) seems absolutely unlikely. Expected to decline further support at 93.79 (13/06/2013 low).
EM Currencies Tumble As Commodity Prices Slide
EM currencies in the doldrums ahead of NFP and French election
Emerging markets currencies tumbled on Thursday amid a sharp correction in commodity prices and mounting expectations of a June Fed rate hike. The West Texas Intermediate hit $47.31 a barrel this morning while its counterpart from the North Sea fell to $50.26 amid supply glut worries. In China, the price of iron ore fell as much as 8% overnight, before trimming losses at around -5%, amid concerns over weak demand. Iron ore futures for delivery in September on the Dalian Commodity Exchange slid to CNY 499 a metricton.
The South African rand was the worst performing currencies this morning as it tumbled 0.60% against the greenback. The rand retraced more than half of last month’s gains as the country’s unstable political landscape takes centre stage once again. The anti-Zuma sentiment is mounting in the country and international investors definitely do not like it. USD/ZAR has broken the 13.3294 resistance (Fibonacci 38.2% on March-April rally) and is currently heading for the following one at 13.6316 (200dma), if broken the road is wide open towards 13.9578 (high from April 10). We therefore maintain our negative view on the currency and wait for a period of stabilization before betting on a correction.
Earnings growth helps support valuation
Equity markets were well behaved after the FOMC meeting closing slightly lower after pullback. The fact was there was nothing really ground breaking nor indication that rate path would be steep enough to derail current risk rally. US earning season is nearly over any so far the results have been extremely positive. Of the 300 companies reporting 75% have signaled positive growth earnings (even stagnant Apple reported earnings growth while buyers waited for iPhone 8). Upside surprises came from cyclical sectors such as consumer discretionary, industrials and materials but consumer staples and defensive earning were flat. Rise in gasoline prices in 1Q lowered household free cash, support by sluggish retail sales constricted earnings growth.
Steepening of the US yeild curve should benefit financials moving forward. Real estate sector is likely to be most vulnerable by rising interest rates. Should earning growth continued at this pace, calls of overvalution become more complicated. In the ultra short term we could see a minor bearish consolidation ahead of the French elections.
Fed Remains On Hold, Views Growth Slowdown As ‘Transitory’
The FOMC kept its policy unchanged yesterday, while the statement accompanying the decision was little changed from previously, maintaining a neutral tone. Perhaps the most important point was that policymakers view the Q1 slowdown in GDP as transitory, implying they expect growth to regain speed in Q2.
Indeed, the Atlanta Fed GDPNow model is currently pointing to a strong rebound in Q2. In a sense, the Fed reassured investors that there is no reason to worry about the soft Q1, while the Atlanta Fed model adds some validity to that view. Therefore, the probability for a June hike rose slightly after the decision and consequently, the dollar gained somewhat.
Moving forward, we believe that the market may start paying extra attention to US economic releases, as they could prove the main catalyst of whether the Fed will indeed proceed with its next rate increase in summer months. Given the Committee's data dependence, investors are now likely to turn their gaze to tomorrow's employment data for April. A strong report is needed for the greenback to extend its post-FOMC gains.
USD/JPY traded higher on the Fed decision, breaking above the resistance (now turned into support) of 112.35 (S1). Nevertheless, the positive leg was stopped by the 112.90 (R1) resistance level and the downside resistance line taken from the peak of the 3rd of January. Absent any shock, we expect the pair to continue oscillating near that resistance zone, waiting for tomorrow's employment data. A solid report could encourage the bulls to overcome that zone and perhaps initially aim for our next resistance of 113.50 (R2).
UK local elections to set the tone for the General Election?
In the UK, the main event will be local elections. Even though these usually pass unnoticed, investors may look to these results as a gauge of whether Theresa May and the Conservatives are indeed as far ahead as the General Election polls indicate.
Currently, polls suggest that the Conservatives are by far the most popular party, with roughly 46% of the total vote. If they gather less support than that today, this could generate concerns that PM May could fail to gather the majority she is seeking in order to strengthen her negotiating hand. Something like that may cause sterling to give back some of its latest gains. On the other hand, a strong showing by the Conservatives could suggest that the polls are indeed correct, and thereby cause GBP to extend its gains.
GBP/USD slid yesterday following the Fed signals, to hit support slightly above the key support obstacle of 1.2850 (S1). We think that today's elections could prove the trigger of whether the rate will rebound from that zone, or break back below it. In case the market decides not to respond to today's results, we expect the rate to oscillate around the key 1.2850 level, awaiting for tomorrow's US jobs data.
As for the rest of today's highlights:
During the European day, the Norges Bank rate decision will be in the spotlight and the forecast is for the Bank to remain on hold once again. Since the last gathering, data showed that inflation slowed further. Even though we don't expect an actual rate cut due to the financial stability risks involved, we expect the tone of the accompanying statement to remain very dovish, in which case NOK could stay under selling pressure.
As for the economic data, the UK services PMI for April is expected to have declined, but given that the manufacturing and construction indices defied similar expectations and instead surged, we see the risks surrounding that forecast as skewed to the upside. In case of a positive surprise, GBP could come under renewed buying interest.
In the US, the nation's trade deficit is expected to have widened further in March. We also get the preliminary labor costs index for Q1 and initial jobless claims for the week ended on the 28th of April. Factory orders for March are due out as well.
As for the speakers, we have two on the agenda: ECB President Mario Draghi and Executive Board member Sabine Lautenschlager. We think that market attention will probably be on Draghi's remarks, for any hints as to whether the Bank is likely to shift to a more optimistic bias at its upcoming meetings.
USD/JPY
Support: 112.35 (S1), 111.90 (S2), 111.40 (S3)
Resistance: 112.90 (R1), 113.50 (R2), 114.50 (R3)
GBP/USD
Support: 1.2770 (S1), 1.2700 (S2), 1.2615 (S3)
Resistance: 1.2950 (R1), 1.3000 (R2), 1.3050 (R3)