Sample Category Title
Canada’s Trade Deficit Narrowed in March
Canada's trade deficit narrowed to $135 million in March (previously $1.1 billion), as a 3.8% rise exports outpaced the 1.7% increase in imports. In real terms, the picture was even better, as export volumes were up 2.5% and imports slipped 0.2%.
The rise in exports was widespread, led by energy, consumer goods and metal and non-metallic mineral products which were all up by 7% during the month. The jump in energy exports was driven largely by higher natural gas and coal exports. A decline in motor vehicle and metal ores and non-metallic minerals provided some offset.
Canada's trade surplus with the U.S. narrowed to $4 billion in March (previously $4.5 billion), while its deficit with the rest of the world narrowed to $4.1 billion (previously $5.6 billion).
Key Implications
The bounce back in export volumes is certainly a welcome development, but strong imports and weak exports earlier in the year means that net trade will weigh on economic growth in the first quarter of this year. Even with this drag, the Canadian economy is still on track to advance by a robust 3.4% in Q1. Moreover, March's trade data will provide a solid hand off for the second quarter.
Going forward, the recent momentum in exports should continue, as the Canadian dollar remains under pressure - the loonie fell below 73 US cents this week for the first time in over a year - and economic activity in the U.S. is set to pick up after a slow start to the year.
The key risk to the outlook remains any potential changes to trade policy with the United States. Last week's (preliminary) announcement that Canadian softwood lumber exports will be hit with a hefty tariff shows that the new President intends to make good on his promise to ensure fair trade for America. While a NAFTA re-negotiation is almost certain to come, we suspect that the agreement will remain largely intact given the close trading relationship between these two countries and effectively balanced trading relationship when services are accounted for.
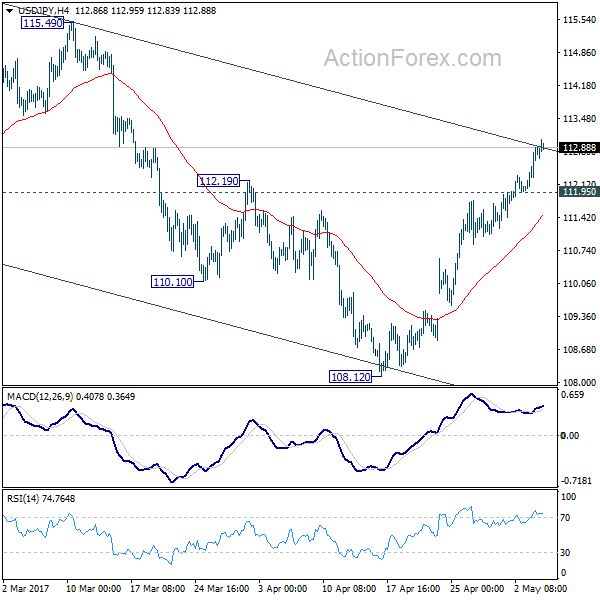
USD/JPY Mid-Day Outlook
Daily Pivots: (S1) 112.22; (P) 112.49; (R1) 113.04; More...
Intraday bias in USD/JPY remains on the upside as rise from 108.12 continues and is picking up momentum again. As noted before, corrective fall from 118.65 has completed with three waves down to 108.12 already. Current rise should target 115.49 resistance. Break of 115.49 will resume larger rally from 98.97 to 125.85 high. On the downside, below 111.95 minor support will turn bias neutral and bring consolidations first.
In the bigger picture, price actions from 125.85 high are seen as a corrective pattern. It's uncertain whether it's completed yet. But in case of another fall, downside should be contained by 61.8% retracement of 75.56 to 125.85 at 94.77 to bring rebound. Meanwhile, break of 115.49 resistance will extend the rise from 98.97 to retest 125.85. Overall, rise from 75.56 is still expected to resume later after the correction from 125.85 completes.
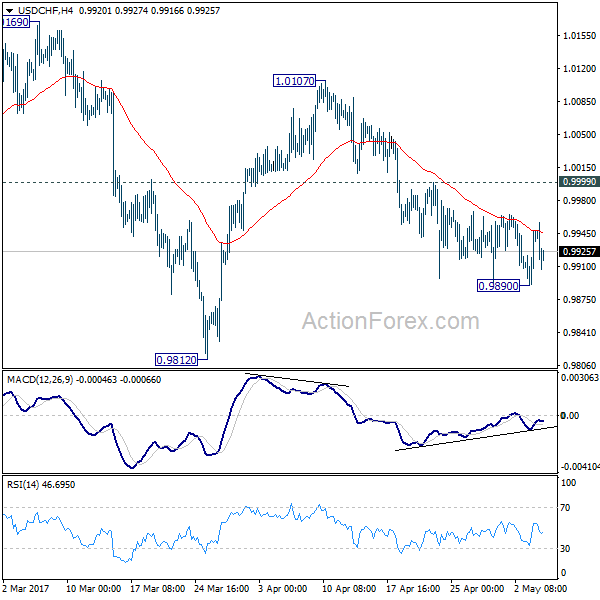
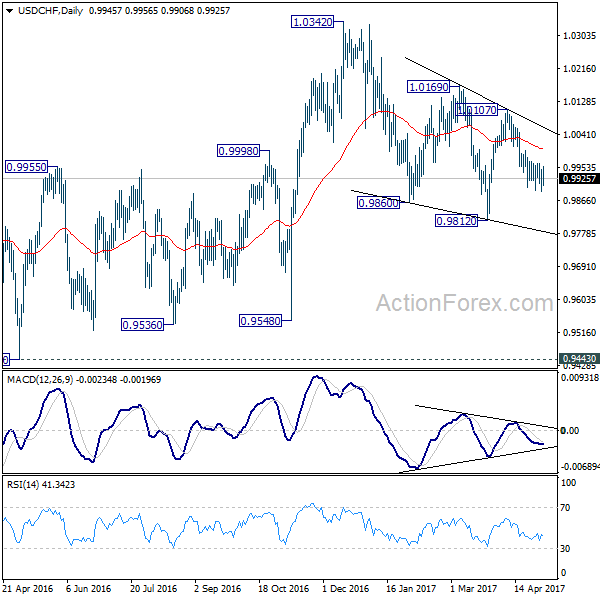
USD/CHF Mid-Day Outlook
Daily Pivots: (S1) 0.9908; (P) 0.9928; (R1) 0.9965; More.....
Intraday bias in USD/CHF remains neutral for the moment. With 0.9999 minor resistance holds, deeper decline is mildly in favor. Below 0.9890 will target 0.9812 and below to extend the correction from 1.0342. But break of 0.9812 should be brief and we will look for bottoming signal below there. On the upside, above 0.9999 minor resistance argues that fall from 1.0107 is finished, with bullish convergence condition in 4 hour MACD. In that case, intraday bias will be flipped back to the upside for 1.0107 resistance first.
In the bigger picture, we're still maintaining that firm break of 1.0342 key resistance is needed to confirm underlying bullish momentum in the pair. However, the corrective nature of the fall from 1.0342 is starting to give the medium term outlook a bullish favor. Hence, in stead of looking for topping signal around 1.0342, we'd now pay closer attention to upside acceleration as USD/CHF approaches this level again.
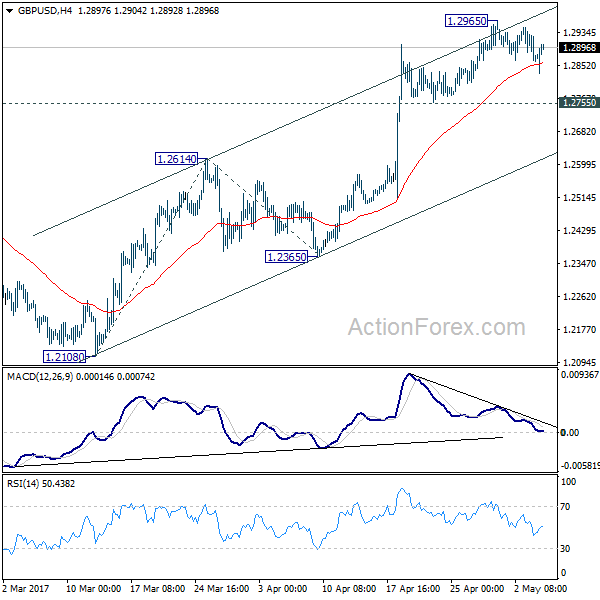
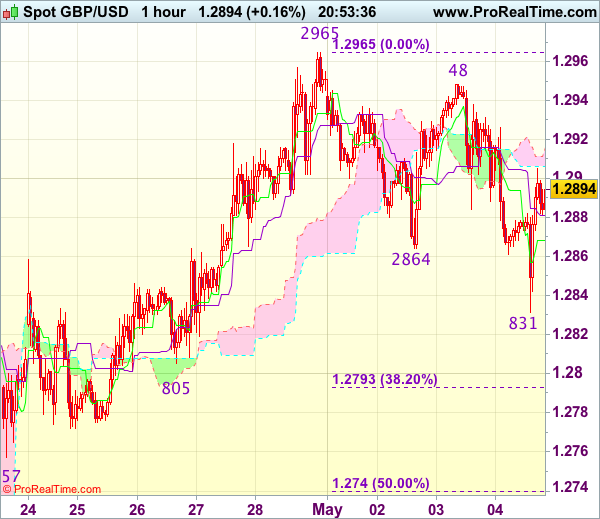
GBP/USD Mid-Day Outlook
Daily Pivots: (S1) 1.2838; (P) 1.2893; (R1) 1.2921; More...
GBP/USD is still staying in consolidative trading in range of 1.2755/2965 and intraday bias remains neutral. Another rise is mildly in favor with 1.2755 support intact. Break of 1.2965 will target 161.8% projection of 1.2108 to 1.2614 from 1.2365 at 1.3184. At this point, price actions from 1.1946 are still seen as a correction pattern. Therefore, we'd expect strong resistance below 1.3444 to bring larger down trend resumption. On the downside, break of 1.2755 minor support will turn bias to the downside. Further break of 1.2614 resistance turned support will now indicate near term reversal.
In the bigger picture, fall from 1.7190 is seen as part of the down trend from 2.1161. There is no sign of medium term reversal yet. Sustained trading below 61.8% projection of 2.1161 to 1.3503 from 1.7190 at 1.2457 will target 100% projection at 0.9532. Overall, break of 1.3444 resistance is needed to confirm medium term bottoming. Otherwise, outlook will remain bearish.
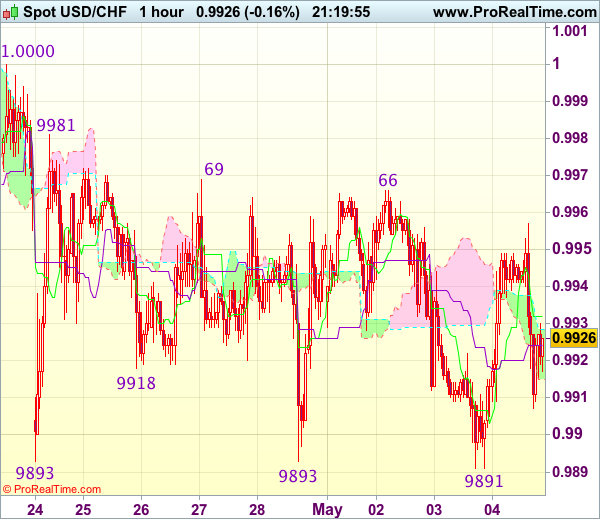
Trade Idea Update: USD/CHF – Stand aside
USD/CHF - 0.9923
New strategy :
Stand aside
Position : -
Target : -
Stop : -
Despite yesterday’s brief fall to 0.9891, lack of follow through selling on break of previous support at 0.9893 and the subsequent rebound has retained our view that further consolidation is in store and test of 0.9966-69 resistance cannot be ruled out, however, a break of 0.9981 is needed to signal low is formed, bring a stronger rebound to 1.0000-08 resistance, above there would confirm a temporary low has been formed at 0.9891, bring retracement of recent decline to 1.0020-30 (61.8% Fibonacci retracement of 1.0108-0.9891) but price should falter well below resistance at 1.0067.
On the downside, below 0.9905-10 would bring retest of 0.9891 but break there is needed to confirm recent decline from 1.0108 top has resumed and extend weakness to 0.9865-70 (2 times extension of 1.0108-1.0008 measuring from 1.0067), however, support at 0.9831 would hold from here, bring rebound later. As near term outlook is still mixed, would be prudent to stand aside for now.
Trade Idea Update: GBP/USD – Buy at 1.2790
GBP/USD - 1.2900
Original strategy :
Buy at 1.2790, Target: 1.2910, Stop: 1.2755
Position : -
Target : -
Stop : -
New strategy :
Buy at 1.2790, Target: 1.2910, Stop: 1.2755
Position : -
Target : -
Stop : -
Although cable has rebounded after intra-day brief fall to 1.2831, reckon upside would be limited to 1.2910-15 and near term downside risk remains for the corrective fall from 1.2965 to bring retracement of recent upmove, below said support at 1.2831 would extend weakness to 1.2790-95 (38.2% Fibonacci retracement of 1.2515-1.2965) where renewed buying interest should emerge, bring another rise later. Above 1.2948 would bring retest of 1.2965, break there would confirm upmove has resumed for headway towards 1.2990-00 (1.236 times projection of 1.2109-1.2616 measuring from 1.2365 and psychological resistance).
In view of this, would not chase this rise here and would be prudent to buy cable on further subsequent pullback as downside should be limited to 1.2790-95. A drop below previous support at 1.2757 would abort and signal top is formed instead, bring correction to 1.2740 (50% Fibonacci retracement of 1.2515-1.2965) first.
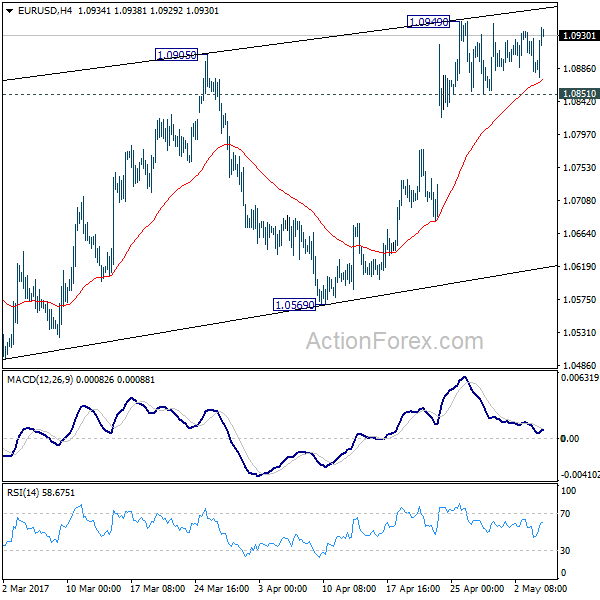
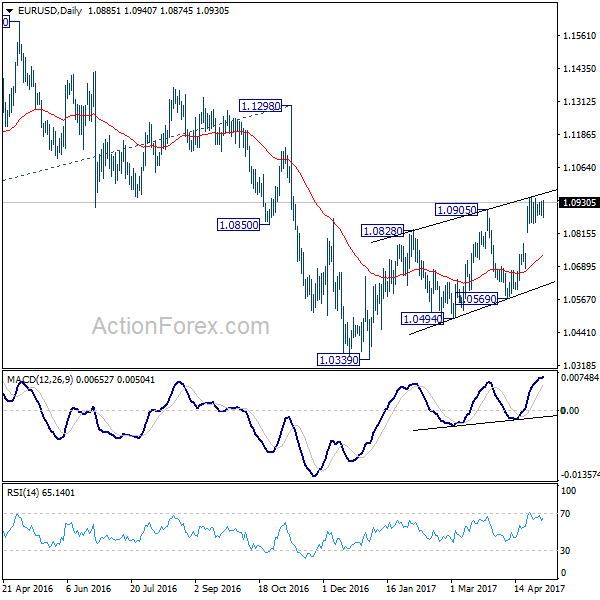
EUR/USD Mid-Day Outlook
Daily Pivots: (S1) 1.0865; (P) 1.0900 (R1) 1.0919; More....
EUR/USD recovers strongly today after being supported above 4 hour 55 EMA. But it's staying below 1.0949 temporary low. Intraday bias remains neutral for the moment. At this point, further rise is still in favor as long as 1.0851 minor support holds. However, choppy rebound from 1.0339 is seen as a correction. Hence we'd look for topping again on next rise. Meanwhile, on the downside, break of 1.0777 will turn turn bias to the downside for 1.0851 support first.
In the bigger picture, as long as 1.1298 key resistance holds, whole down trend from 1.6039 (2008 high) is still expected to continue. Break of 1.0339 low will send EUR/USD through parity to 61.8% projection of 1.3993 to 1.0461 from 1.1298 at 0.9115. However, considering bullish convergence condition in weekly MACD, break of 1.1298 will indicate term reversal. This would also be supported by sustained trading above 55 week EMA.
Dollar Lower Despite Sharp Fall in Initial Jobless Claims, Euro and CAC Lifted by French Macron
Dollar trades softer against European majors as the brief lift from FOMC statement fades. Economic data from US are solid but provide little support to the greenback. Initial jobless claims dropped -19k to 238k in the week ended April 29, below expectation of 246k. Continuing claims dropped 23k ti 1.96m, lowest in 17 year. Challenger report showed -42.9% yoy fall in planned layoff in April. Trade deficit narrowed slightly to USD -43.7b in March. Non-farm productivity dropped -0.6% in Q1 while unit labor costs rose 3.0%.
French stocks and Euro surges
French stocks and Euro surges as pro-Euro centrist Emmanuel Macron performed well in the final TV debate against EU-sceptic far-right Marine Le Pen. CAC is trading up 0.95% at the time of writing and hit the highest level in more than nine years. According to a viewers poll by French broadcaster BFMTV, 63% of viewers voted Macron as the "most convincing" of the pair after the debate. According to latest running poll average, Macron is still having 18% lead over Le Pen and is still widely tipped to win the presidential election this Sunday. Released from Eurozone, retail sales rose 0.3% mom in March. Eurozone services PMI was revised higher to 56.4 in April. Italy services PMI rose sharply to 56.2 in April. Also from Europe, SECO consumer confidence dropped to -8 in April.
UK PMI services shone
UK PMI services rose to 55.8 in April, up from 55.0, and beat expectation of 54.6. That's also the highest level this year. Markit noted that "UK business activity growth gained momentum for a second successive month in April, with a hat-trick of faster growth signalled by the three PMI surveys." And, "the improvement in the survey data indicates that economic growth has revived after having slowed sharply in the first quarter of the year." Countering weakness in household-facing business, UK economy could achieve 0.4% growth in Q2 as a whole. Also from UK, mortgage approvals dropped to 67k in March. M4 Money supply rose 0.3% mom in March.
Aussie catching up the slump iron ore prices
Recent decline in Australian dollar is viewed as a catch-up of the selloff of the iron ore price from its February peak. Spot price for 62% benchmark iron ore slumped more than 30% in 2 months after reading a peak of US$90/tones on February 21. During the period, AUDUSD had been trading within a broad range and dropped around -2%. The relatively resilience in Aussie was likely driven by the broad-based weakness in the greenback as soft dataflow had diminished expectations of a rate June rate hike. Recall the selloff of iron ore prices accelerated in March, after China's pledge reduce steel capacity. The tighter liquidity conditions in China's money markets have reinforced concerns over the government's efforts to crack down the steel industry. More in Australian Dollar Dived On Concerns Over China's Iron Ore Demand Outlook
EUR/USD Mid-Day Outlook
Daily Pivots: (S1) 1.0865; (P) 1.0900 (R1) 1.0919; More....
EUR/USD recovers strongly today after being supported above 4 hour 55 EMA. But it's staying below 1.0949 temporary low. Intraday bias remains neutral for the moment. At this point, further rise is still in favor as long as 1.0851 minor support holds. However, choppy rebound from 1.0339 is seen as a correction. Hence we'd look for topping again on next rise. Meanwhile, on the downside, break of 1.0777 will turn turn bias to the downside for 1.0851 support first.
In the bigger picture, as long as 1.1298 key resistance holds, whole down trend from 1.6039 (2008 high) is still expected to continue. Break of 1.0339 low will send EUR/USD through parity to 61.8% projection of 1.3993 to 1.0461 from 1.1298 at 0.9115. However, considering bullish convergence condition in weekly MACD, break of 1.1298 will indicate term reversal. This would also be supported by sustained trading above 55 week EMA.
Economic Indicators Update
| GMT | Ccy | Events | Actual | Forecast | Previous | Revised |
|---|---|---|---|---|---|---|
| 01:30 | AUD | Trade Balance (AUD) Mar | 3.11B | 3.33B | 3.57B | |
| 01:45 | CNY | Caixin China PMI Services Apr | 51.5 | 52.6 | 52.2 | |
| 05:45 | CHF | SECO Consumer Confidence Apr | -8 | 3 | -3 | |
| 07:45 | EUR | Italy Services PMI Apr | 56.2 | 53.7 | 52.9 | |
| 07:50 | EUR | France Services PMI Apr F | 56.7 | 57.7 | 57.7 | |
| 07:55 | EUR | Germany Services PMI Apr F | 55.4 | 54.7 | 54.7 | |
| 08:00 | EUR | Eurozone Services PMI Apr F | 56.4 | 56.2 | 56.2 | |
| 08:30 | GBP | Services PMI Apr | 55.8 | 54.6 | 55 | |
| 08:30 | GBP | Mortgage Approvals Mar | 67K | 67K | 68K | |
| 08:30 | GBP | M4 Money Supply M/M Mar | 0.30% | 0.20% | -0.30% | -0.20% |
| 09:00 | EUR | Eurozone Retail Sales M/M Mar | 0.30% | 0.10% | 0.70% | |
| 11:30 | USD | Challenger Job Cuts Y/Y Apr | -42.90% | -2.00% | ||
| 12:30 | CAD | International Merchandise Trade (CAD) Mar | -0.1B | 0.3B | -1.0B | -1.1B |
| 12:30 | USD | Non-Farm Productivity Q1 P | -0.60% | 0.00% | 1.30% | |
| 12:30 | USD | Unit Labor Costs Q1 P | 3.00% | 2.60% | 1.70% | |
| 12:30 | USD | Trade Balance Mar | -43.7B | -44.9B | -43.6B | -43.8B |
| 12:30 | USD | Initial Jobless Claims (29 APR) | 238K | 246K | 257K | |
| 14:00 | USD | Factory Orders Mar | 0.60% | 1.00% | ||
| 14:30 | USD | Natural Gas Storage | 74B |
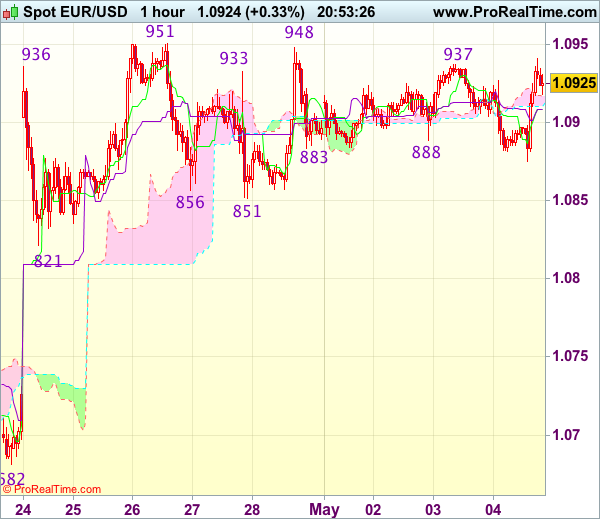
Trade Idea Update: EUR/USD – Buy at 1.0900
EUR/USD - 1.0930
Original strategy :
Buy at 1.0900, Target: 1.1000, Stop: 1.0870
Position : -
Target : -
Stop : -
New strategy :
Buy at 1.0900, Target: 1.1000, Stop: 1.0870
Position : -
Target : -
Stop : -
Although the single currency fell briefly to 1.0875, lack of follow through selling and current rebound suggest consolidation with upside bias would be seen and test of indicated resistance at 1.0951 (last week’s high) would be seen, however, break there is needed to signal recent upmove from 1.0340 low has resumed for headway to 1.0975-80 and possibly towards 1.1000 but price should falter below 1.1025 (50% projection of 1.0602-1.0951 measuring from 1.0851).
In view of this, we are looking to buy euro on dips. Below intra-day support at 1.0875 would prolong consolidation below said resistance at 1.0951, bring correction towards support at 1.0851 but price should stay above 1.0821 support, bring another rise later.
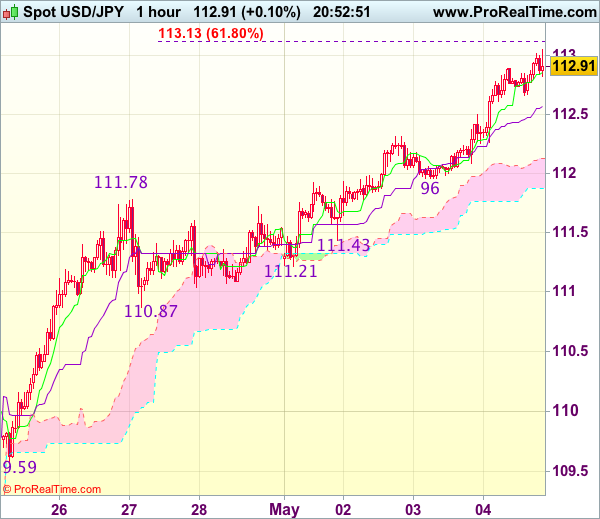
Trade Idea Update: USD/JPY – Buy at 112.50
USD/JPY - 112.88
Original strategy :
Buy at 112.00, Target: 113.00, Stop: 111.65
Position : -
Target : -
Stop : -
New strategy :
Buy at 112.50, Target: 113.50, Stop: 112.15
Position : -
Target : -
Stop : -
As the greenback has surged again after finding renewed buying interest at 111.96 yesterday, adding credence to our view that recent upmove is still in progress and bullishness remains for further subsequent gain to 113.10-15 (61.8% projection of 108.13-111.78 measuring from 110.87) but near term overbought condition should limit upside to previous resistance at 113.54 and reckon 113.75-80 (76.4% retracement of 115.51-108.13) would hold, risk from there has increased for a retreat to take place later.
In view of this, would not chase this rise here and would be prudent to buy dollar on subsequent pullback as 112.45-50 should limit downside. Only below indicated support at 111.96 would defer and suggest top is formed, bring correction of recent rise to previous resistance at 111.78.